

Inflammatory burden index: associations between osteoarthritis and all-cause mortality among individuals with osteoarthritis
- PMID: 39138465
- PMCID: PMC11323649
- DOI: 10.1186/s12889-024-19632-1
Inflammatory burden index: associations between osteoarthritis and all-cause mortality among individuals with osteoarthritis
Abstract
Background: The newly described inflammatory burden index (IBI) reflects a patient's inflammatory burden. This study aimed to estimate the association between IBI, osteoarthritis (OA), and all-cause mortality in patients with OA.
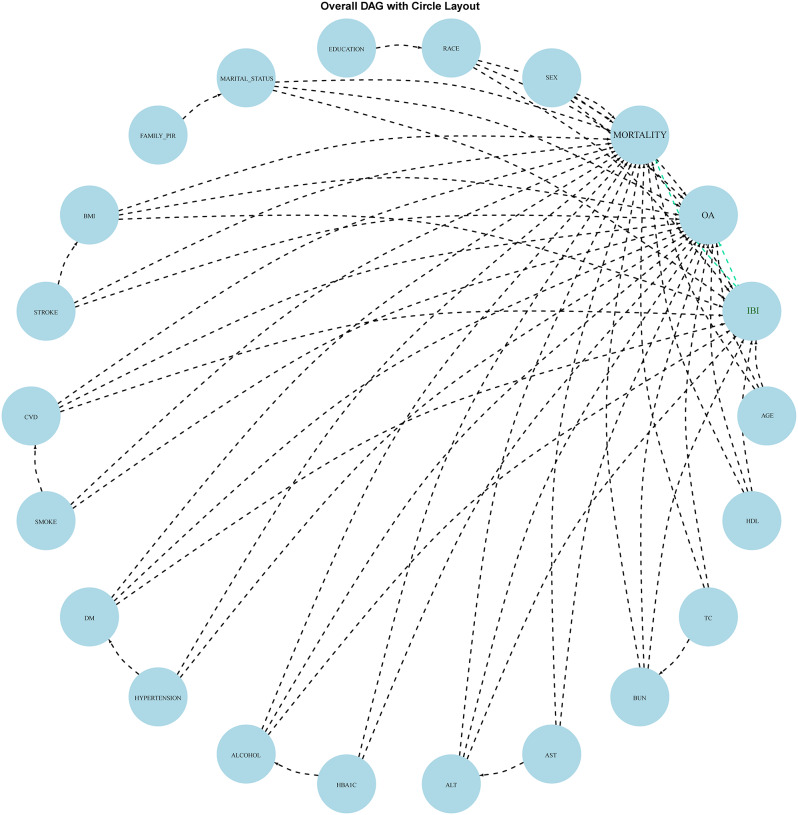
Methods: We extracted the data of adults from the National Health and Nutrition Examination Survey database between 1999 and 2018. After using appropriate survey weights to correct for sample bias, we conducted multivariate logistic regression analyses to explore the association between IBI and OA across three models: in the unadjusted model, partially adjusted model (adjusting age, sex, race, education level, marital status, PIR, BMI, smoking status, drinking status, stroke, CVD, DM, and hypertension) and fully adjusted model (which included additional variables: HBA1C, ALT, AST, BUN, TC, and HDL). And the odds ratios (OR) and 95% confidence intervals (CI) were calculated. Similarly, using comparable survey weights and covariates adjustments, we employed Cox proportional hazards regression analysis to investigate the association between IBI and all-cause mortality in the other 3 models. The Cox proportional hazards regression models were fitted to calculate the hazard ratios (HR) and 95% CI of the association between IBI and all-cause mortality. A restricted cubic spline (RCS) was used to explore the nonlinear relationships between association effects. Subgroup analysis was performed to validate the reliability of their effects.
Results: In total, 22,343 eligible participants were included. Multiple logistic regression models revealed that participants with the highest IBI had 2.54 times (95%CI, 2.23, 2.90)) higher risk of OA than those with the lowest IBI in Model 1, whereas the OR was 1.21 (95%CI, 1.03, 1.42) in Model 2 and 1.23 (95%CI,1.05, 1.45) in Model 3. Multiple Cox regression models showed participants with the highest IBI had 186% (95%CI, 1.50, 2.31) times risk of developing all-cause death than those with the lowest IBI in Model 1. This trend remained stable in Models 2 (HR,1.54; 95%CI,1.22, 1.95) and 3 (HR, 1.41; 95%CI, 1.10, 1.80). The RCS revealed a significant positive association between IBI and OA risk. With respect to the association between IBI and all-cause mortality, a slight decrease in mortality was observed from the lowest quartile to the second quartile of IBI, and the mortality risk increased with increasing IBI. Subgroup analyses showed that age, cardiovascular disease, and hypertension were pivotal in the association of IBI with all-cause mortality, whereas the association of IBI with OA remained stable after stratification by other factors such as sex, race, education level, marital, smoking, and drinking status, hypertension, and most serological indices.
Conclusions: This study provides evidence of a positive association between IBI, OA, and all-cause mortality. IBI may be a promising signature for assessing the inflammatory burden in patients with OA, which, in turn, is conducive to precise references for high-risk population recognition, anti-inflammatory guidance, and reducing mortality intervention.
Keywords: All-cause mortality; CDC; Inflammatory burden index; NHANES; Osteoarthritis; Positive association.
© 2024. The Author(s).
Conflict of interest statement
The authors declare no competing interests.
Figures


References
Publication types
MeSH terms
LinkOut - more resources
Full Text Sources
Medical
