. 2024 Aug 13;16(1):98.
doi: 10.1186/s13073-024-01367-8.

Spatial multiomics reveals a subpopulation of fibroblasts associated with cancer stemness in human hepatocellular carcinoma

Affiliations

Spatial multiomics reveals a subpopulation of fibroblasts associated with cancer stemness in human hepatocellular carcinoma

Si-Yu Jing et al. Genome Med. .

Abstract

Background: Cancer-associated fibroblasts (CAFs) are the prominent cell type in the tumor microenvironment (TME), and CAF subsets have been identified in various tumors. However, how CAFs spatially coordinate other cell populations within the liver TME to promote cancer progression remains unclear.

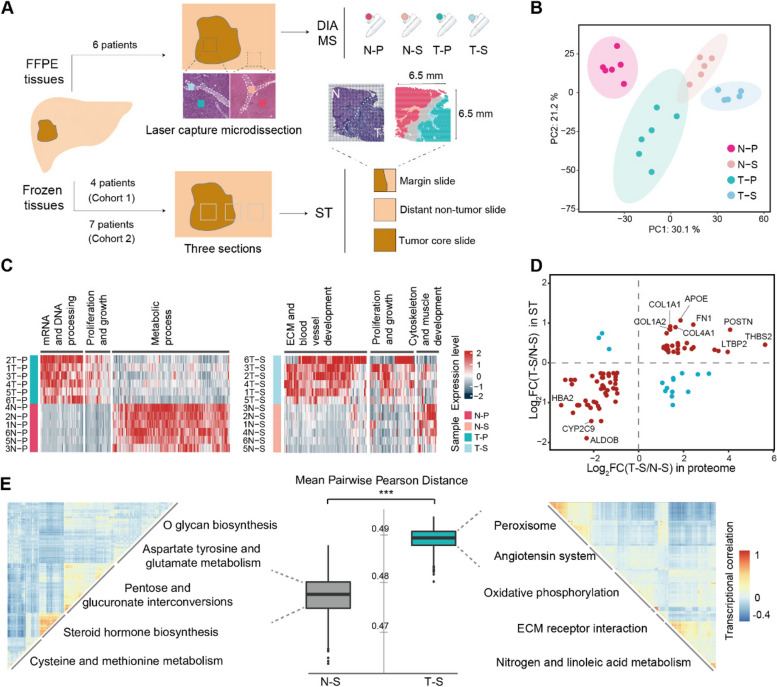
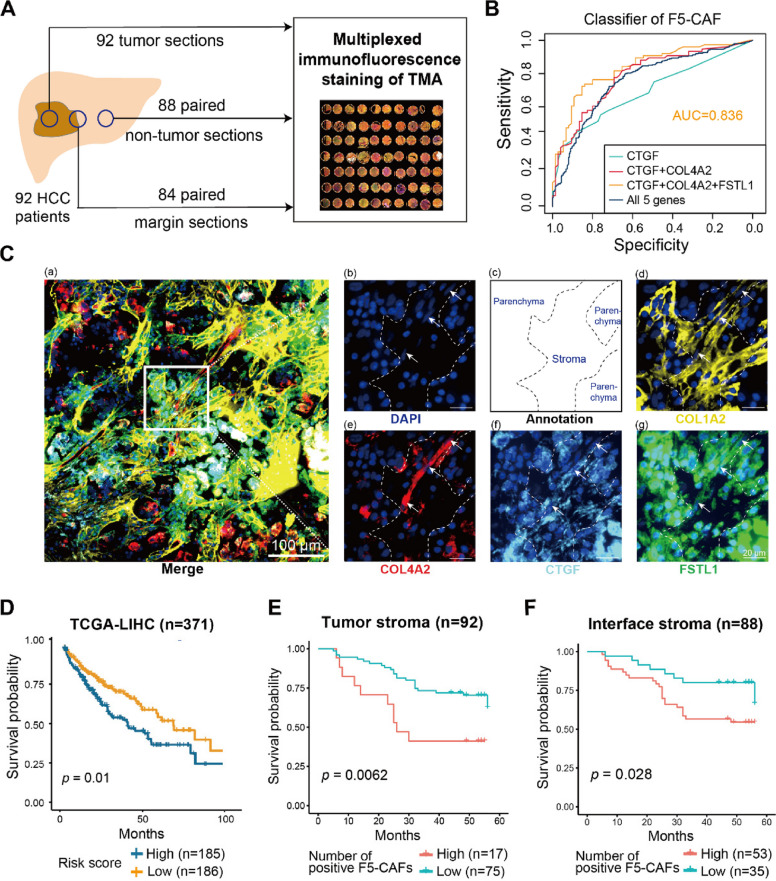
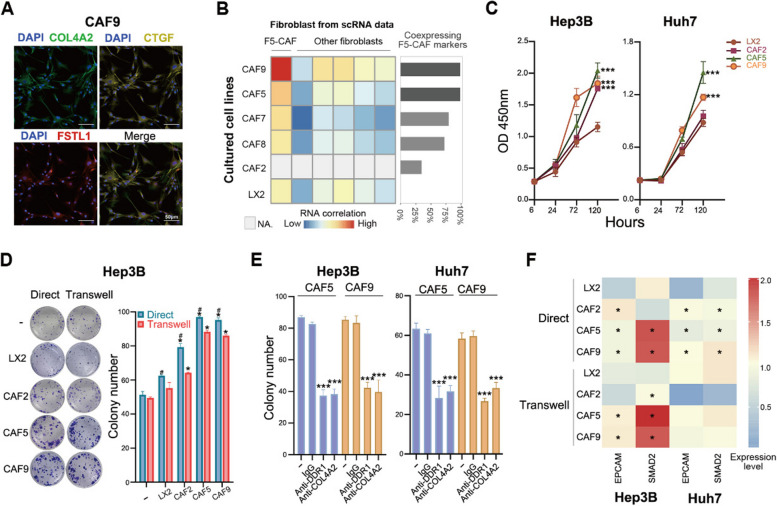
Methods: We combined multi-region proteomics (6 patients, 24 samples), 10X Genomics Visium spatial transcriptomics (11 patients, 25 samples), and multiplexed imaging (92 patients, 264 samples) technologies to decipher the expression heterogeneity, functional diversity, spatial distribution, colocalization, and interaction of fibroblasts. The newly identified CAF subpopulation was validated by cells isolated from 5 liver cancer patients and in vitro functional assays.

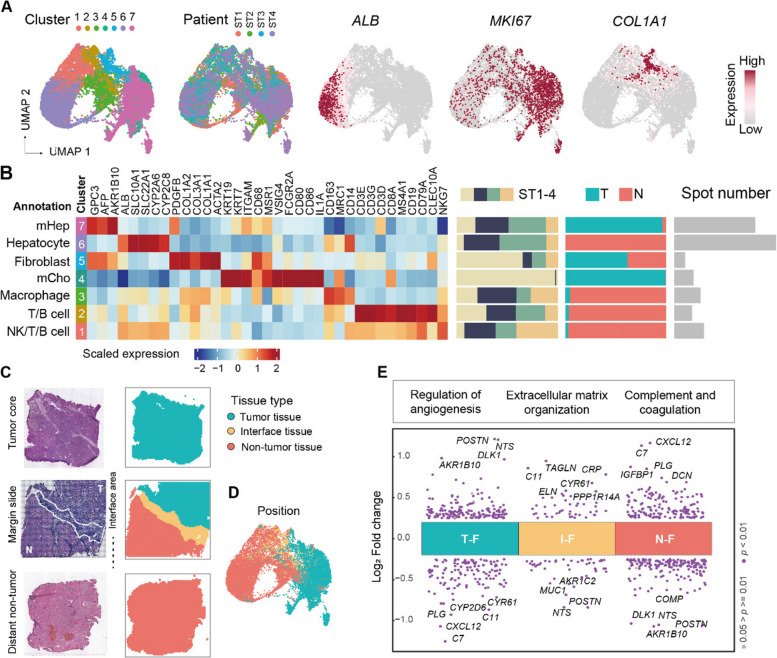
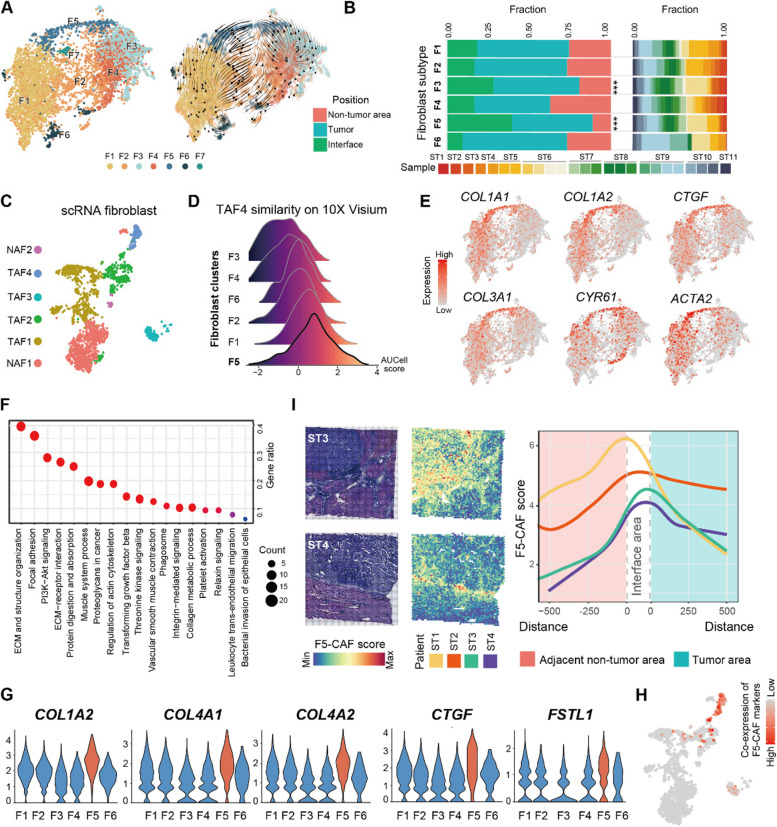
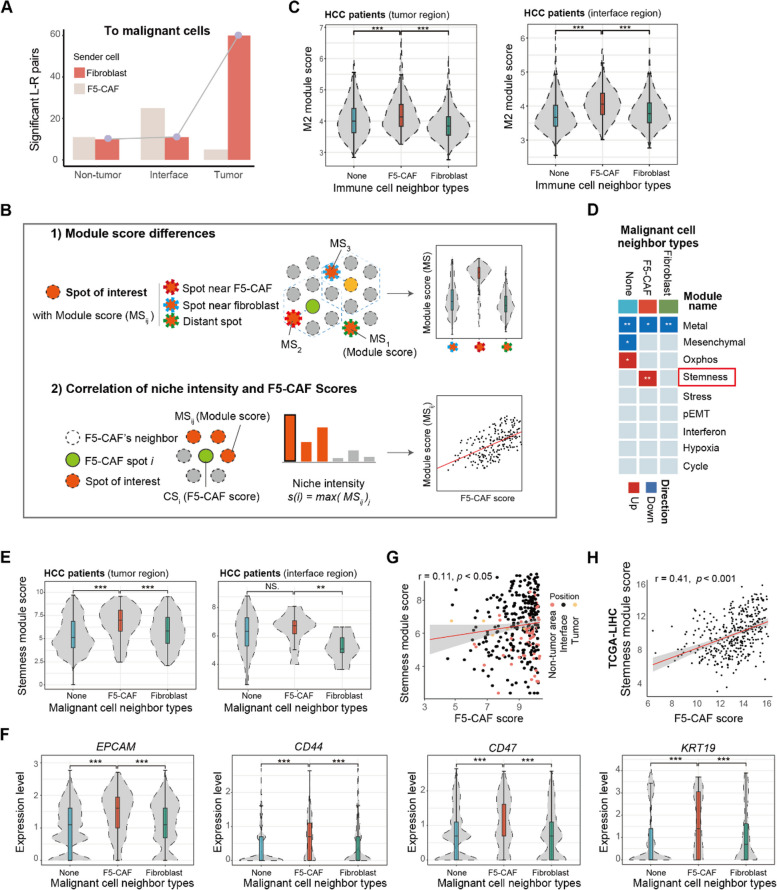
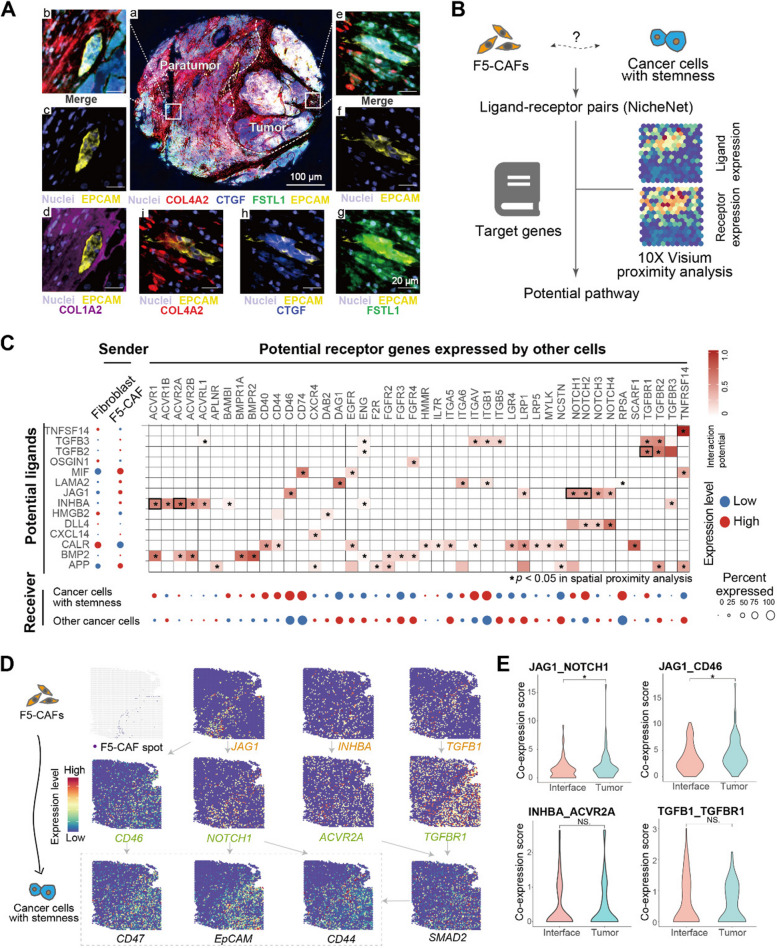
Results: We identified a liver CAF subpopulation, marked by the expression of COL1A2, COL4A1, COL4A2, CTGF, and FSTL1, and named F5-CAF. F5-CAF is preferentially located within and around tumor nests and colocalizes with cancer cells with higher stemness in hepatocellular carcinoma (HCC). Multiplexed staining of 92 patients and the bulk transcriptome of 371 patients demonstrated that the abundance of F5-CAFs in HCC was associated with a worse prognosis. Further in vitro experiments showed that F5-CAFs isolated from liver cancer patients can promote the proliferation and stemness of HCC cells.

Conclusions: We identified a CAF subpopulation F5-CAF in liver cancer, which is associated with cancer stemness and unfavorable prognosis. Our results provide potential mechanisms by which the CAF subset in the TME promotes the development of liver cancer by supporting the survival of cancer stem cells.

Keywords: Cancer stem cell; Cancer-associated fibroblast; Liver cancer; Spatial transcriptomics; Tumor microenvironment.


Conflict of interest statement

The authors declare that they have no competing interests.

Figures

Fig. 1
Fig. 1
Functional diversity and heterogeneity of the tumor stroma in human liver cancer revealed by proteomic and ST analysis. A Tissue processing workflow for proteome and spatial transcriptome. ST, 10X Genomics Visium spatial transcriptomics; DIA-MS, data independent collection-mass spectrometry. B Principal component analysis of protein quantification of all samples. Background ellipses indicate 95% confidence intervals. C Differentially expressed proteins in parenchymal cells (left) and stromal cells (right) in different tissues and their corresponding functions. T–P, tumor parenchymal samples; N–P, non-tumor parenchymal samples; T–S, tumor stroma samples; N‒S, non-tumor stroma samples. D Comparison of the degree of differential gene regulation between T–S and N–S in proteomic and transcriptomic data. Red dots are genes with similar changes between the two datasets, and blue dots are genes with opposite changes. E The heterogeneity of the stromal spots in different areas. The boxplot indicates Pearson’s distance, and heatmaps indicate the similarity of the transcriptional profile, clustered by transcriptional correlation. ***, p < 0.001 by Wilcoxon rank sum test. See also Fig. S1
Fig. 2
Fig. 2
Functional diversity and heterogeneity of fibroblasts revealed by ST analysis. A Uniform manifold approximation and projection (UMAP) of ST spots labeled by clusters (left), patients (median), and highlighted by three marker genes (right). B Left, average expression of highly variable genes in each cluster. Right, cluster composition, displayed by individual patient, tumor area, and spot number. mHep, malignant hepatocyte; mCho, malignant cholangiocyte; NK, natural killer; T, tumor; N, non-tumor. C Representative H&E-stained slides (left) and the corresponding spatial location of the spots (right). D UMAP of ST spots labeled by location. E Differential gene expression analysis showing up- and downregulated genes in different locations of fibroblast groups. The functional terms of some upregulated genes in each group are shown in the upper box. T–F, fibroblasts in the tumor area; I–F, fibroblasts in the interface area; N–F, fibroblasts in the non-tumor area. See also Fig. S2
Fig. 3
Fig. 3
A CAF subpopulation in liver cancer and its transcriptional characteristics. A UMAP (left) and trajectory (right) of 5803 fibroblast-enriched spots colored by clusters. B Fibroblast subset composition displayed as percentages at different locations and in individual patients. Stars indicate significant tumor enrichment (Fisher test, p < 0.001). C UMAP of 1836 fibroblasts from the scRNA-seq data colored by clusters. TAF, fibroblasts enriched in the tumor; NAF, other fibroblast subpopulations. D AUCell score matched to TAF4 fibroblasts for each ST cluster. E UMAP feature plots of myofibroblast marker expression in fibroblast-enriched spots. F Gene Ontology (GO) terms for the top 200 upregulated genes in F5 versus other fibroblasts. G The expression of the marker genes of F5. All five genes were significantly highly expressed in F5 (t test, adjusted p < 0.05). H The summed expression of the marker genes in G. Gray indicates that at least one of the 5 marker genes is not expressed, while red reflects a higher combined expression of the marker genes. I The spatial distribution of the F5-CAF score, defined by marker genes in G. Left, representative spatial distribution of the F5-CAF score in two ST tissue sections stained with H&E. Right, line chart of the F5-CAF score by tumor border distance. See also Fig. S3
Fig. 4
Fig. 4
F5-CAFs in HCC patients were associated with an unfavorable prognosis. A The experimental workflow of multiplexed immunofluorescence (mIF) staining of a hepatocellular carcinoma (HCC) tissue microarray (TMA). B Receiver operating characteristic curves of gene combinations predicted by the random forest model. AUC, area under the curve. C Representative composite image of the tumor core tissue by using mIF staining (COL1A2, yellow; COL4A2, red; CTGF, blue; FSTL1, green; and DAPI, dark blue). a, merged image; b, an enlarged subsection of the core highlighted in (a), colored by DAPI nuclear marker with arrows indicating F5-CAF; c, an annotated drawing of the location of parenchymal and stromal tissues; d–g, showing each of the individual markers, together with the DAPI nuclear marker and the autofluorescence signal (pseudocolored black). The spindle cells indicated by the white arrows are fibroblasts that are positive for all five markers. D Overall survival of patients in the TCGA cohort based on the risk score, defined by the expression of F5-CAF markers, stratified by the median value. E Overall survival analysis of HCC patients with a high or low number of F5-CAFs in the tumor stroma, stratified by the best cutoff value. F Overall survival analysis of HCC patients with a high or low number of F5-CAFs in the interface stroma, stratified by the best cutoff value. See also Fig. S4
Fig. 5
Fig. 5
Spatial colocalization of F5-CAFs with other cells in the HCC TME. A Significant L–R pairs for F5-CAF/other fibroblast-malignant cells in non-tumor, interface, and tumor areas. Location of malignant cells from malignant spots. B Schematic of the cellular neighborhood. Top, red spots indicate the presence of the cell type of interest and can be divided into three groups (dashed lines in different colors) according to their proximity to fibroblast subpopulations. The dashed hexagon represents a community of fibroblast spots. Bottom, schematic of the calculation of “niche intensity” for each community. C Violin plots of the M2 module score of immune-enriched spots in different groups. ***, p < 0.001 and NS, p > 0.05 by Wilcoxon rank-sum test. D Heatmap of cancer cell states enriched in different groups in the tumor and interface area. The three groups correspond to the definitions in B. The red box marks the significant state in F5-CAF-surrounding malignant spots. Oxphos, oxidative phosphorylation; pEMT, partial epithelial-mesenchymal transition. E Violin plots of the stemness module score of malignant spots in different groups. ***, p < 0.001 and NS, p > 0.05 by Wilcoxon rank-sum test. F Expression of cancer stem cell markers across malignant spots from distinct groups. ***, p < 0.001 and *, p < 0.05 by Wilcoxon rank-sum test. G Pearson correlation between the F5-CAF score and stemness module score in fibroblast-cancer cell communities. The module score was calculated by ssgsea (see the “Methods” section). H Similar to F, for TCGA-LIHC samples. See also Fig. S5 and Fig. S6
Fig. 6
Fig. 6
Cellular crosstalk between F5-CAFs and HCC CSCs. A Representative composite mIF image of the HCC interface area (EPCAM, yellow; COL4A2, red; CTGF, blue; FSTL1, green; COL1A2, purple and DAPI, weak purple). a, merged image. The dashed curve indicates the boundary of the tumor tissue. b–i, enlarged subsection highlighted in the non-tumor area (b–d) or in the tumor area (e–i) as in (a), showing five merged markers (b, e) or the individual marker(s) in the composite image after spectral unmixing, together with the nuclear marker DAPI (pseudocolored purple) and the autofluorescence signal (pseudocolored black). B Schematic of F5-CAF ligand‒receptor (L–R) analysis in the TME. C Left, average expression of the top ligands predicted by NicheNet across F5-CAFs and other fibroblast subpopulations modulating cancer cells. Middle, heatmap of significant L-R pairs in ST. The black box marks the pathway shown in D. Bottom, average expression of ligand-matched receptors expressed by malignant spots. D Spatial feature plots (ST2 sample) of select ligands expressed by F5-CAFs and cognate receptor expression by cancer cells with stemness. E L–R co-expression scores at different locations. *, p < 0.05 and NS, p > 0.05 by Wilcoxon rank-sum test. See also Fig. S6
Fig. 7
Fig. 7
Patient-derived F5-CAFs promote the in vitro proliferation and stemness of liver cancer cells. A Co-expression of the F5-CAF markers (CTGF, COL4A2, and FSTL1) in cultured primary CAF9 cells in mIF staining data. A representative microscopic field of view is shown. B Relationships between cultured primary CAF cells and F5-CAF subtypes in Fig. 3. Correlation of RNA profiles (left) and percentage of cells on mIF data for simultaneous expression of F5-CAF markers as in A (right). Five primary CAF lines were from resected tumor tissues; LX2, human hepatic stellate cell. CAF2 was not included due to insufficient starting cell material for RNA-seq. C CCK-8 experiments showing the effect of the conditioned culture supernatant of CAFs on the growth of liver cancer cells. Note that on day 5, some tumor cells cocultured with CAF9 cells died due to overgrowth. ***, p < 0.001 by ANOVA, compared with LX2. D Colony-formation ability of Hep3B liver cancer cells when cocultured with CAFs directly or in transwells. A representative image of each condition is shown on the left. * and #, p < 0.05, compared with LX2 or Transwell, respectively. E Colony-formation ability of liver cancer cells cocultured directly with CAFs. Culture medium was added without ( −) or with the indicated neutralizing antibody. ***, p < 0.001 by ANOVA, compared with IgG. F Heatmap showing the expression levels of two stemness genes in liver cancer cells after coculture with the indicated CAFs or LX2 cells. *, higher expression level compared with LX2 and p < 0.05. See also Fig. S7

References

    1. Brassart-Pasco S, et al. Tumor Microenvironment: Extracellular Matrix Alterations Influence Tumor Progression. Front Oncol. 2020;10:397. 10.3389/fonc.2020.00397 - DOI - PMC - PubMed
    1. Lv B, et al. Immunotherapy: Reshape the Tumor Immune Microenvironment. Front Immunol. 2022;13: 844142. 10.3389/fimmu.2022.844142 - DOI - PMC - PubMed
    1. Gaggianesi M, et al. Messing Up the Cancer Stem Cell Chemoresistance Mechanisms Supported by Tumor Microenvironment. Front Oncol. 2021;11: 702642. 10.3389/fonc.2021.702642 - DOI - PMC - PubMed
    1. Lavie D, et al. Cancer-associated fibroblasts in the single-cell era. Nat Cancer. 2022;3(7):793–807. 10.1038/s43018-022-00411-z - DOI - PMC - PubMed
    1. Cox TR. The matrix in cancer. Nat Rev Cancer. 2021;21(4):217–38. 10.1038/s41568-020-00329-7 - DOI - PubMed

MeSH terms

LinkOut - more resources