. 2024 Jul 30:17:1439442.
doi: 10.3389/fnmol.2024.1439442. eCollection 2024.

Multiple aspects of amyloid dynamics in vivo integrate to establish prion variant dominance in yeast

Affiliations

Multiple aspects of amyloid dynamics in vivo integrate to establish prion variant dominance in yeast

Jennifer Norton et al. Front Mol Neurosci. .

Abstract

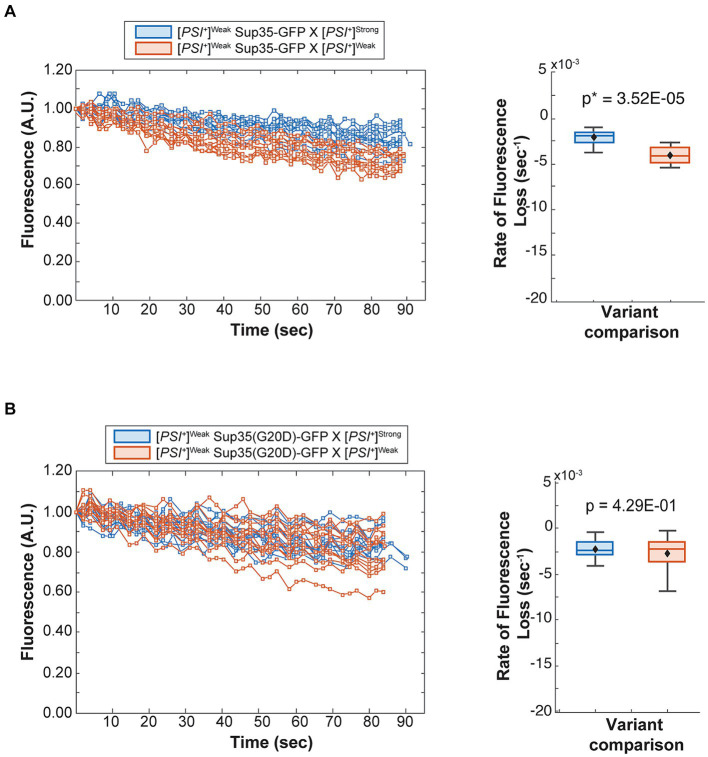
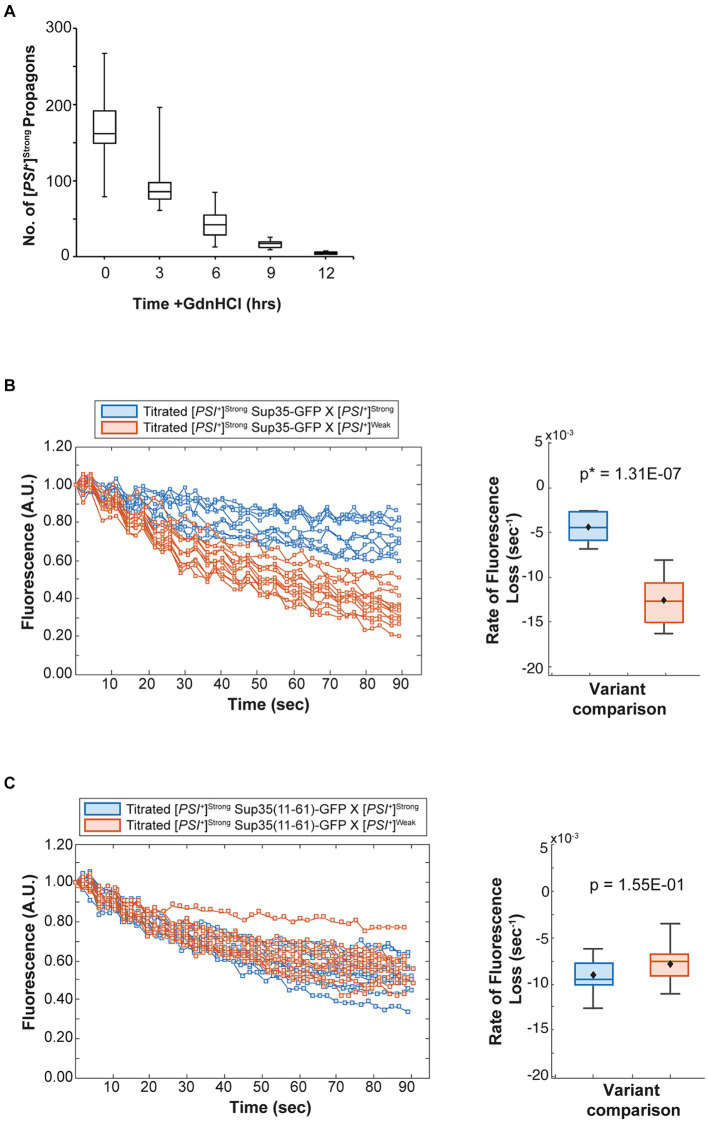
Prion variants are self-perpetuating conformers of a single protein that assemble into amyloid fibers and confer unique phenotypic states. Multiple prion variants can arise, particularly in response to changing environments, and interact within an organism. These interactions are often competitive, with one variant establishing phenotypic dominance over the others. This dominance has been linked to the competition for non-prion state protein, which must be converted to the prion state via a nucleated polymerization mechanism. However, the intrinsic rates of conversion, determined by the conformation of the variant, cannot explain prion variant dominance, suggesting a more complex interaction. Using the yeast prion system [PSI+ ], we have determined the mechanism of dominance of the [PSI+ ]Strong variant over the [PSI+ ]Weak variant in vivo. When mixed by mating, phenotypic dominance is established in zygotes, but the two variants persist and co-exist in the lineage descended from this cell. [PSI+ ]Strong propagons, the heritable unit, are amplified at the expense of [PSI+ ]Weak propagons, through the efficient conversion of soluble Sup35 protein, as revealed by fluorescence photobleaching experiments employing variant-specific mutants of Sup35. This competition, however, is highly sensitive to the fragmentation of [PSI+ ]Strong amyloid fibers, with even transient inhibition of the fragmentation catalyst Hsp104 promoting amplification of [PSI+ ]Weak propagons. Reducing the number of [PSI+ ]Strong propagons prior to mating, similarly promotes [PSI+ ]Weak amplification and conversion of soluble Sup35, indicating that template number and conversion efficiency combine to determine dominance. Thus, prion variant dominance is not an absolute hierarchy but rather an outcome arising from the dynamic interplay between unique protein conformations and their interactions with distinct cellular proteostatic niches.

Keywords: Hsp104; SUP35; amyloid; chaperone; prion; variant competition.


Conflict of interest statement

The authors declare that the research was conducted in the absence of any commercial or financial relationships that could be construed as a potential conflict of interest.

Figures

Figure 1
Figure 1
The [PSI+]Strong phenotype is established immediately after variant mixing. (A) Δade1 [psi] (dark grey), Δade1 [PSI+]Weak (light gray), and Δade1 [PSI+]Strong (white) haploids were mated to wildtype (WT) [psi], [PSI+]Weak, and [PSI+]Strong haploids, and budding from the zygotes on synthetic complete medium was quantified. Results are presented as box-whisker plots. Horizontal lines indicate 25th, 50th, and 75th percentiles; whiskers indicate 10th and 90th percentiles; diamonds indicate means; outliers are presented as dots. The number of zygotes analyzed is presented in parentheses below each box plot. The equality of means across all groups was tested using Welch’s ANOVA test (p*ANOVA); p-values were determined using pairwise unequal variance t-tests and are presented above each box plot for comparisons within a cross. The absence of a p-value for comparisons within a cross indicates a lack of significant difference. Full statistical comparisons are available in Supplementary Table S1. (B) WT [psi], [PSI+]Strong, and [PSI+]Weak haploids were mated to a [PSI+]Weak haploid expressing a fluorescent, nuclear localizing readthrough reporter, GST(UGA)-YFP-NLS. Representative epifluorescence images (eYFP) of the zygotes are shown alongside merged eYFP and Normarski images (DIC). (C) Fluorescence intensity within zygotes, representing stop codon readthrough levels, was quantified and presented in a box-whisker plot. Horizontal lines indicate 25th, 50th, and 75th percentiles; whiskers indicate 10th and 90th percentiles; diamonds indicate means; outliers are presented as dots. The number of zygotes analyzed is presented in parentheses below each box plot. The equality of means across all groups was tested using Welch’s ANOVA test (p*ANOVA); p-values were determined using pairwise unequal variance t-tests and are presented above each box plot for comparisons within a cross. The absence of a p-value for comparisons within a cross indicates a lack of significant difference. Full statistical comparisons are available in Supplementary Table S2.
Figure 2
Figure 2
The [PSI+]Weak variant persists after mating to the dominant [PSI+]Strong variant. (A) Wildtype (WT) [psi], [PSI+]Weak, and [PSI+]Strong haploids were mated to a WT [PSI+]Strong haploid without treatment (untreated, dark gray), in the presence of 3 mM GdnHCl (treated, light gray), and in the presence of 3 mM GdnHCl following growth of the [PSI+]Strong haploid (1N) in the presence of GdnHCl for 12 h (titrated, white). The number of [PSI+]Strong propagons from the resulting zygotes and a [PSI+]Strong haploid was quantified and presented as box-whisker plots. Horizontal lines indicate 25th, 50th, and 75th percentiles; whiskers indicate 10th and 90th percentiles; diamonds indicate means; outliers are presented as dots. The number of zygotes analyzed is presented in parentheses below each box plot. The equality of means across all groups was tested using Welch’s ANOVA test (p*ANOVA); p-values were determined using pairwise unequal variance t-tests and are presented above each box plot for comparisons within a cross. The absence of a p-value for comparisons within a cross indicates a lack of significant difference. Full statistical comparisons are available in Supplementary Table S3. (B) The number of [PSI+]Weak propagons from the zygotes presented in (A) was quantified and presented as box-whisker plots as in (A). The equality of means across all groups was tested using Welch’s ANOVA test (p*ANOVA); p-values were determined using pairwise unequal variance t-tests and are presented above each box plot for comparisons within a cross. The absence of a p-value for comparisons within a cross indicates a lack of significant difference. Full statistical comparisons are available in Supplementary Table S4. (C) The persistence of the [PSI+]Weak variant was observed by microscopy in crosses between [PSI+]Strong and [PSI+]Weak haploids expressing Sup35(G20D)-GFP under the control of the P tetO7 promoter. GFP foci were detected in cells at the periphery of the resulting microcolony, indicated by white arrows in the inset (200-fold magnification).
Figure 3
Figure 3
The dominant [PSI+]Strong variant interferes with amplification of [PSI+]Weak propagons. A wildtype (WT) [PSI+]Weak haploid (1 N) was mated to WT [psi], [PSI+]Weak, and [PSI+]Strong haploids without treatment (untreated, dark gray) or in the presence of 3 mM GdnHCl (treated, white). The number of [PSI+]Weak propagons from the zygotes and the [PSI+]Weak haploid was quantified and presented in box-whisker plots. Horizontal lines indicate 25th, 50th, and 75th percentiles; whiskers indicate 10th and 90th percentiles; diamonds indicate means. The number of zygotes analyzed is presented in parentheses below each box plot. The equality of means across all groups was tested using Welch’s ANOVA test (p*ANOVA); p-values were determined using pairwise unequal variance t-tests and are presented above each box plot for comparisons within a cross; the absence of a p-value for comparisons within a cross indicates a lack of significant. Full statistical comparisons are available in Supplementary Table S5.
Figure 4
Figure 4
The dominant [PSI+]Strong variant competes for soluble Sup35 more efficiently than the recessive [PSI+]Weak variant. (A) Wildtype [PSI+]Strong (blue) and [PSI+]Weak haploids (salmon) were mated to a [PSI+]Weak haploid expressing GFP-tagged Sup35 under the control of the P MFA1 promoter. Fluorescence intensity was quantified in the mother lobe of a singly budded zygote following repeated photobleaching of the daughter (left), and the rate of fluorescence loss was calculated and presented as box-whisker plots (right, n ≥ 11). Horizontal lines indicate 25th, 50th, and 75th percentiles; whiskers indicate 10th and 90th percentiles; diamonds indicate means. An unequal variance t-test was used to determine p values (B) A [PSI+]Weak haploid expressing a GFP-tagged Sup35 mutant (G20D) under the control of the P MFA1 promoter was mated to wildtype [PSI+]Strong (blue) and [PSI+]Weak (salmon) haploids and analyzed as in (A, n ≥ 13).
Figure 5
Figure 5
Competing variants are differentially affected by fragmentation activity. (A,B) A [PSI+]Weak haploid expressing GFP-tagged Sup35 under the control of the P MFA1 promoter was mated to the indicated wildtype haploids in the presence or absence of guanidine hydrochloride (+/-GdnHCl). For each cross, a representative zygote (left column) and its resulting microcolony (right column) are shown (n > 8). Note that the differences in fluorescent intensity between zygotes (+/- GdnHCl) are explained by the incorporation of soluble Sup35-GFP onto newly introduced prion aggregates that are or are not being fragmented, as expected (Satpute-Krishnan et al., 2007).
Figure 6
Figure 6
The competitive advantage of [PSI+]Strong is limited by template abundance. (A) The number of [PSI+]Strong propagons was determined at 3-h intervals in the presence of guanidine hydrochloride (GdnHCl) (n > 12). Results are presented as box-whisker plots. Horizontal lines indicate 25th, 50th, and 75th percentiles; whickers indicate 10th and 90th percentiles. (B) A [PSI+]Strong haploid expressing GFP-tagged Sup35 under the control of the P MFA1 promoter was grown in the presence of GdnHCl for 12 h then mated to wildtype [PSI+]Strong (blue) or [PSI+]Weak haploids (salmon). The daughters of singly budded zygotes were subjected to repeated photobleaching while fluorescence intensity in the mother lobes was monitored (left) and the rates of fluorescence decay were calculated and presented as box-whisker plots (right, n ≥ 9). Horizontal lines indicate 25th, 50th, and 75th percentiles; whiskers indicate 10th and 90th percentiles. An unequal variance t-test was used to determine p-values. (C) A [PSI+]Strong haploid expressing a GFP-tagged Sup35 mutant (11–61) under the control of the P MFA1 promoter was grown in the presence of GdnHCl for 12 h and then crossed to wildtype [PSI+]Strong (blue) and [PSI+]Weak (salmon) haploids and analyzed as in (B, n ≥ 11).

Similar articles

References

    1. Allsop D., Ikeda S., Bruce M., Glenner G. G. (1988). Cerebrovascular amyloid in scrapie-affected sheep reacts with antibodies to prion protein. Neurosci. Lett. 92, 234–239. doi: 10.1016/0304-3940(88)90067-5 - DOI - PubMed
    1. Astor M. T., Kamiya E., Sporn Z. A., Berger S. E., Hines J. K. (2018). Variant-specific and reciprocal Hsp40 functions in Hsp104-mediated prion elimination. Mol. Microbiol. 109, 41–62. doi: 10.1111/mmi.13966, PMID: - DOI - PMC - PubMed
    1. Atarashi R., Moore R. A., Sim V. L., Hughson A. G., Dorward D. W., Onwubiko H. A., et al. . (2007). Ultrasensitive detection of scrapie prion protein using seeded conversion of recombinant prion protein. Nat. Methods 4, 645–650. doi: 10.1038/nmeth1066, PMID: - DOI - PubMed
    1. Atarashi R., Sim V. L., Nishida N., Caughey B., Katamine S. (2006). Prion strain-dependent differences in conversion of mutant prion proteins in cell culture. J. Virol. 80, 7854–7862. doi: 10.1128/jvi.00424-06 - DOI - PMC - PubMed
    1. Bartz J. C., Bessen R. A., McKenzie D., Marsh R. F., Aiken J. M. (2000). Adaptation and selection of prion protein strain conformations following interspecies transmission of transmissible mink encephalopathy. J. Virol. 74, 5542–5547. doi: 10.1128/JVI.74.12.5542-5547.2000, PMID: - DOI - PMC - PubMed

LinkOut - more resources