A computational study of gene expression patterns in head and neck squamous cell carcinoma using TCGA data
- PMID: 39140365
- PMCID: PMC11326450
- DOI: 10.1080/20565623.2024.2380590
A computational study of gene expression patterns in head and neck squamous cell carcinoma using TCGA data
Abstract
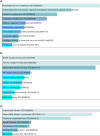
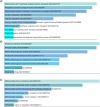
Aim: Head and Neck squamous cell carcinoma (HNSCC) is the second most prevalent cancer in Pakistan. Methods: Gene expression data from TCGA and GETx for normal genes to analyze Differentially Expressed Genes (DEGs). Data was further investigated using the Enrichr tool to perform Gene Ontology (GO). Results: Our analysis identified most significantly differentially expressed genes and explored their established cellular functions as well as their potential involvement in tumor development. We found that the highly expressed Keratin family and S100A9 genes. The under-expressed genes KRT4 and KRT13 provide instructions for the production of keratin proteins. Conclusion: Our study suggests that factors such as poor oral hygiene and smokeless tobacco can result in oral stress and cellular damage and cause cancer.
Keywords: Big Data; DEG; Gene Ontology; HNSCC; KRT13; TCGA.
Plain language summary
The Cancer Genome Atlas (TCGA) holds vast cancer data processed with powerful computers and cloud tech. This sparks new bioinformatics for better cancer diagnosis, treatment, and prevention. In Southeast Asia, Head and Neck Squamous Cell Carcinoma (HNSCC) is prevalent. We used TCGA and GETx data to study gene expression. High-expression Keratin and S100A9 genes fight cellular damage under stress, while under-expressed KRT4 and KRT13 genes shape cell structure. Poor oral care and smokeless tobacco could induce cell damage, sparking cancer mutations. Unveiling HNSCC mechanisms may guide targeted treatments and preventive strategies.
Conflict of interest statement
The authors have no competing interests or relevant affiliations with any organization or entity with the subject matter or materials discussed in the manuscript. This includes employment, consultancies, honoraria, stock ownership or options, expert testimony, grants or patents received or pending, or royalties.
Figures


References
-
- Huang DW, Sherman BT, Lempicki RA. Bioinformatics enrichment tools: paths toward the comprehensive functional analysis of large gene lists. Nucleic Acids Res. 37(1), 1–13 (2008). - PMC - PubMed
-
• In this paper, author provides the tool for scientific community and it also provides help in the Bioinformatics related work.
-
- Min S, Lee B, Yoon S. Deep learning in bioinformatics. Brief. Bioinform. 18(5), 851–869 (2017). - PubMed
-
- Ullah S, Gao T, Rahman Wet al. . LDBPR: Latest Database of Protein Research. J. Bioinform. System. Biol. 5(1), 34–44 (2022).
LinkOut - more resources
Full Text Sources
Research Materials
Miscellaneous
