. 2024 Aug 20;121(34):e2405959121.
doi: 10.1073/pnas.2405959121. Epub 2024 Aug 14.

mTORC1 phosphorylates and stabilizes LST2 to negatively regulate EGFR

Affiliations

mTORC1 phosphorylates and stabilizes LST2 to negatively regulate EGFR

Stefania Battaglioni et al. Proc Natl Acad Sci U S A. .

Abstract

TORC1 (target of rapamycin complex 1) is a highly conserved protein kinase that plays a central role in regulating cell growth. Given the role of mammalian TORC1 (mTORC1) in metabolism and disease, understanding mTORC1 downstream signaling and feedback loops is important. mTORC1 recognizes some of its substrates via a five amino acid binding sequence called the TOR signaling (TOS) motif. mTORC1 binding to a TOS motif facilitates phosphorylation of a distinct, distal site. Here, we show that LST2, also known as ZFYVE28, contains a TOS motif (amino acids 401 to 405) and is directly phosphorylated by mTORC1 at serine 670 (S670). mTORC1-mediated S670 phosphorylation promotes LST2 monoubiquitination on lysine 87 (K87). Monoubiquitinated LST2 is stable and displays a broad reticular distribution. When mTORC1 is inactive, unphosphorylated LST2 is degraded by the proteasome. The absence of LST2 enhances EGFR (epidermal growth factor receptor) signaling. We propose that mTORC1 negatively feeds back on its upstream receptor EGFR via LST2.

Keywords: LST2; TOS motif; mTOR signaling; negative feedback; phosphorylation substrate.


Conflict of interest statement

Competing interests statement:T.M. and M.N.H. collaborate with Aukera Therapeutics GmbH. M.N.H. is affiliated with F. Hoffmann-La Roche Ltd., Swiss Rockets AG and Torqur AG.

Figures
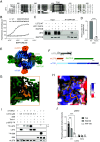
Fig. 1.
Fig. 1.
LST2 binds RAPTOR through its TOS motif and is phosphorylated by mTORC1 on S670. (A) Sequence alignment of the LST2 protein from different species. Uniprot ID of human: Q9HCC9, mouse: Q6ZPK7, rat: A0A8I5ZMR3, Xenopus: Q0P4S0, zebrafish: A0JMD2, drosophila: Q9VB70 and C. elegans: Q9TZD0. The TOS motif, which is conserved in vertebrates, is indicated by a black box. (B) Binding of synthetic N-terminally FITC labeled peptides representing the WT and F401A mutant of the LST2 TOS motif to RAPTOR measured by fluorescence anisotropy. Kd (WT) = 330 nM, N = 3. (C) Coimmunoprecipitation of full-length LST2-WT or -F401A mutant with RAPTOR. LST2 is 96 kDa and runs at 130 kDa on SDS-PAGE, as previously shown in (11). (D) Quantification of C. Unpaired t test, N = 3, ****P < 0.0001. (E) Cryo-EM reconstruction of mTORC1 in the presence of full-length LST2. A composite map from two locally refined protomers (map 1 from SI Appendix, Fig. S2) is contoured at 10.5 electron/Å2. Map regions are colored according to proteins, LST2 is colored yellow and indicated by a box, RAPTOR in green, mLST8 in orange, and mTOR in shades of blue, as in panel F. (F) Schematic representation of the domain architecture of mTORC1 and LST2. The resolved region of LST2 is indicated in yellow. (G) Cryo-EM reconstruction of the LST2 TOS peptide bound to mTORC1. A map at 3.27 Å resolution (map 6 from SI Appendix, Fig. S3) from a local refinement is contoured at 0.52 electron/Å2, displaying the same region indicated in panel E by a box, coloring corresponds to panel E, F. (H) Interactions of the LST2 TOS peptide bound to mTORC1. Surface representation of the RAPTOR TOS-binding pocket region colored by charge (blue and red indicating positive and negative charge, respectively). The LST2 peptide is shown in cartoon representation in yellow with side chains displayed in stick representation with dark yellow for carbon atoms, light yellow for sulfur, blue for nitrogen, and red for oxygen. LST2 peptide amino acids are labeled. (I) Radioactive in vitro mTORC1 kinase assay. Each reaction was carried out with 10 µM radioactive [γ-32P]-ATP (2.5 µCi). The SDS-PAGE gel was first exposed for radioactive detection then transferred and membrane probed with indicated antibodies. (J) Quantitative mass spectrometric analysis of LST2 phosphorylation on S670. Intensities have been normalized for WT Fed condition. Two-way ANOVA, N = 3, ***P < 0.001, ****P < 0.0001.
Fig. 2.
Fig. 2.
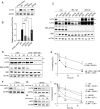
LST2 is stabilized by mTORC1-mediated phosphorylation. (A) Immunoblots upon empty vector and LST2-WT, LST2-F401A, LST2-S670A, LST2-S670E overexpression in HEK293T cells. Media replenished 4 h before cell collection. ACTIN serves as a loading control. (B) Quantification of A. One-way ANOVA, N = 4, ****P < 0.0001. (C) Immunoblots upon LST2-WT, LST2-F401A, LST2-S670A, LST2-S670E overexpression in HeLa cells. Cells were treated with DMSO (Ctrl), 200 nM INK-128, or 10 µM MG132 for 20 h. ACTIN serves as a loading control. (D) Immunoblots upon LST2-WT overexpression in HEK293T cells treated with 100 µg/mL cycloheximide (CHX) with or without 200 nM INK-128 for the indicated times. ACTIN serves as a loading control. (E) Quantification of D. Nonlinear fit. Inhibitor vs. response (three parameters), N = 3. Multiple unpaired t test, N = 3, *P < 0.05, **P < 0.01. Statistical difference is shown comparing CHX + INK-128 to CHX in the illustrated time points. (F) Immunoblots upon LST2-F401A overexpression in HEK293T cells treated with 100 µg/mL cycloheximide (CHX) for the indicated times. ACTIN serves as a loading control. (G) Immunoblots upon LST2-S670A overexpression in HEK293T cells treated with 100 µg/mL cycloheximide (CHX) for the indicated times. ACTIN serves as a loading control. (H) Immunoblots upon LST2-S670E overexpression in HEK293T cells treated with 100 µg/mL cycloheximide (CHX) for the indicated times. ACTIN serves as a loading control. (I) Quantification of D, F, G, and H. Nonlinear fit. Inhibitor vs. response (three parameters), N = 3. Multiple unpaired t test, N = 3, *P < 0.05, ***P < 0.001. Statistical difference is shown for the specific mutant in comparison to WT in the illustrated time points.
Fig. 3.
Fig. 3.
Phosphorylation on S670 is required for LST2 ubiquitination. (A) Immunoblots upon empty vector and LST2-WT and LST2-K87R overexpression in HEK293T cells. Media replenished 4 h before cell collection. ACTIN serves as a loading control. (B) Immunoblots upon LST2-WT and LST2-K87R overexpression in HEK293T cells treated with 100 µg/mL cycloheximide (CHX) for the indicated times. ACTIN serves as a loading control. (C) Quantification of B. Nonlinear fit. Inhibitor vs. response (three parameters), N = 3. Multiple unpaired t test, N = 3, *P < 0.05, **P < 0.01. Quantification of WT is as in Fig. 2E. Statistical difference is shown in comparison to WT in the illustrated time points. (D) HMF tagged LST2-WT, LST2-K87R, LST2-F401A, LST2-S670A, and LST2-S670E overexpressed in HEK293T cells. LST2 immunoprecipitated with flag beads. Immunoblot of equally loaded LST2. Input in SI Appendix, Fig S4A. (E) Quantification of D. One-way ANOVA, N = 3, *P < 0.05, **P < 0.01. (F) Immunoblots upon LST2-WT, LST2-K87R, LST2-S670E, LST2-S670E-K87R overexpression in HEK293T cells. Media replenished 4 h before cell collection. ACTIN serves as a loading control. (G) Quantification of F. LST2 levels were first normalized to ACTIN then ratio made as indicated. One-way ANOVA, N = 3, ***P < 0.001, ****P < 0.0001.
Fig. 4.
Fig. 4.
LST2 S670 phosphorylation promotes reticular distribution of LST2. (A) HeLa cells overexpressing mCherry tagged EEA1 in combination with GFP tagged LST2-WT, LST2-K87R, LST2-F401A, LST2-S670A, or LST2-S670E. Cells fixed in 4% PFA. In blue, DAPI staining. 2 µm bar scale. (B) Quantification of A. Manders’ coefficient LST2/EEA1, One-way ANOVA, N = 60, ****P < 0.0001. (C) HeLa cells overexpressing mCherry tagged LAMP1 in combination with GFP tagged LST2-WT, LST2-K87R, LST2-F401A, LST2-S670A, or LST2-S670E. Cells fixed in 4% PFA. In blue, DAPI staining. 2 µm bar scale. (D) Quantification of C. Manders’ coefficient LST2/LAMP1, One-way ANOVA, N = 60, ****P < 0.0001.
Fig. 5.
Fig. 5.
LST2 is a negative regulator of EGFR. (A) Immunoblot of WT and LST2-KO MDA-MB-231 cells. Cells serum-starved for 3 h and 100 ng/mL of EGF provided for the indicated time. CALNEXIN serves as a loading control. (B) Quantification of A. Two-way ANOVA, N = 3, ****P < 0.0001. (C) Immunoblot of WT and LST2-KO MDA-MB-231 cells. Cells were serum-starved for 3 h (Ctrl) and then stimulated for 30 min with 100 ng/mL of EGF. 20 µM AG-1478 or 10 µM PD153035 or 1:500 of DMSO (Vehicle) were provided 1 h before EGF as indicated. ACTIN serves as a loading control. (D) Quantification of C. Two-way ANOVA, N = 3. ns, no significance. (E) Schematic model of LST2 regulation by mTORC1. This figure has been generated with BioRender.com.

References

    1. Liu G. Y., Sabatini D. M., mTOR at the nexus of nutrition, growth, ageing and disease. Nat. Rev. Mol. Cell Biol. 21, 183–203 (2020). - PMC - PubMed
    1. Dazert E., Hall M. N., mTOR signaling in disease. Curr. Opin. Cell Biol. 23, 744–755 (2011). - PubMed
    1. Battaglioni S., Benjamin D., Wälchli M., Maier T., Hall M. N., mTOR substrate phosphorylation in growth control. Cell 185, 1814–1836 (2022). - PubMed
    1. Loewith R., et al. , Two TOR complexes, only one of which is rapamycin sensitive, have distinct roles in cell growth control. Mol. Cell 10, 457–468 (2002). - PubMed
    1. Wullschleger S., Loewith R., Hall M. N., TOR signaling in growth and metabolism. Cell 124, 471–484 (2006). - PubMed

Substances