. 2024 Nov;23(11):e14287.
doi: 10.1111/acel.14287. Epub 2024 Aug 14.

Aging human abdominal subcutaneous white adipose tissue at single cell resolution

Affiliations

Aging human abdominal subcutaneous white adipose tissue at single cell resolution

K L Whytock et al. Aging Cell. 2024 Nov.

Abstract

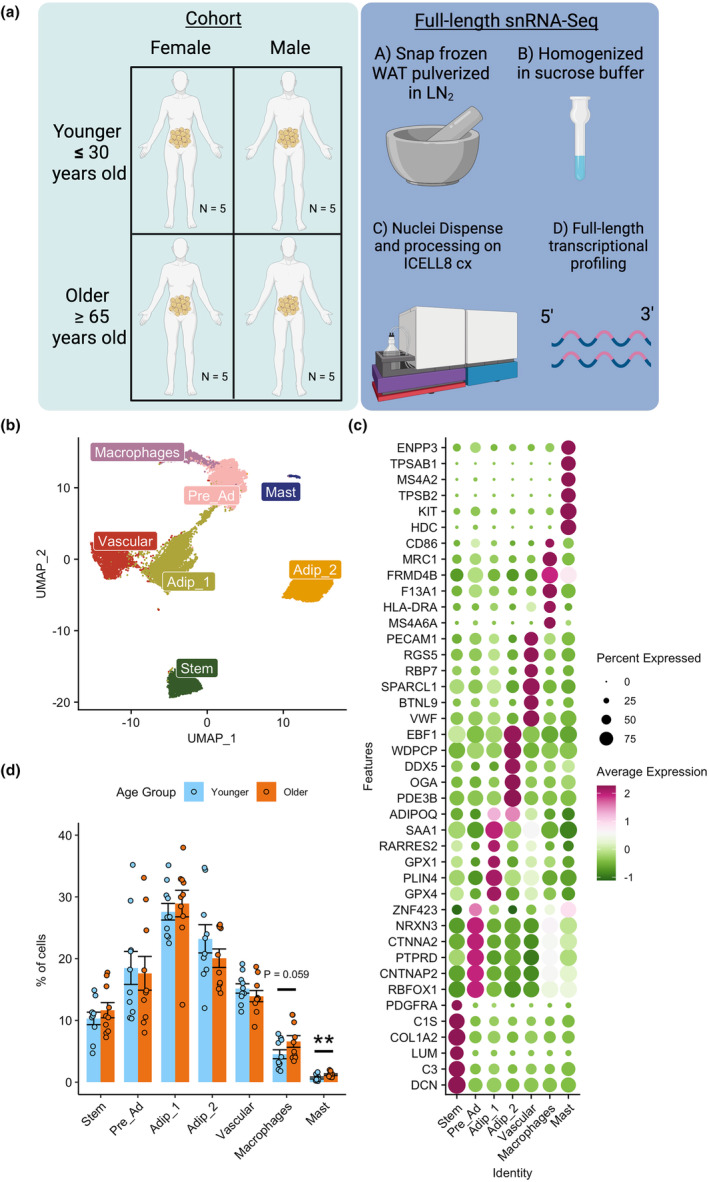
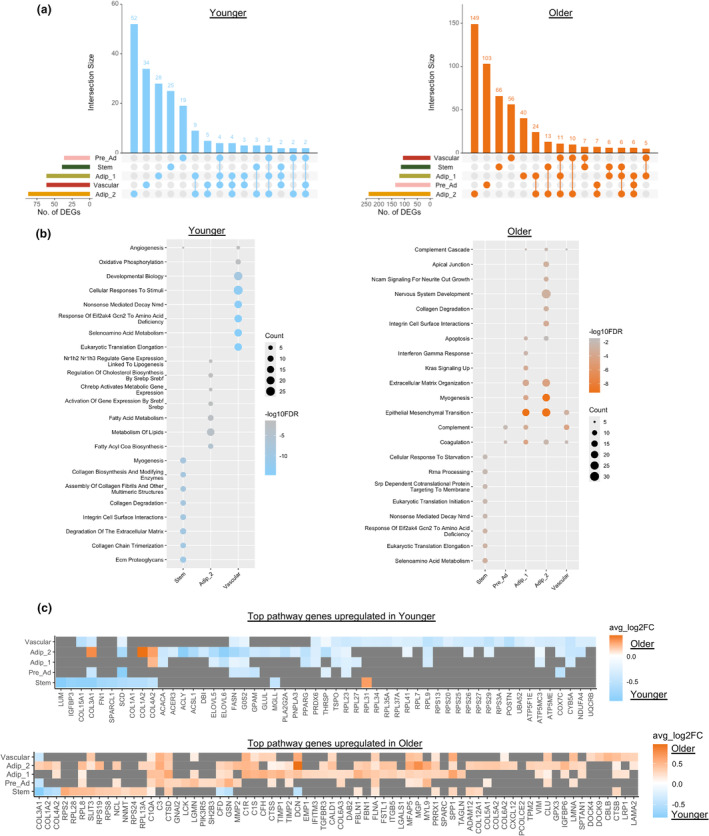
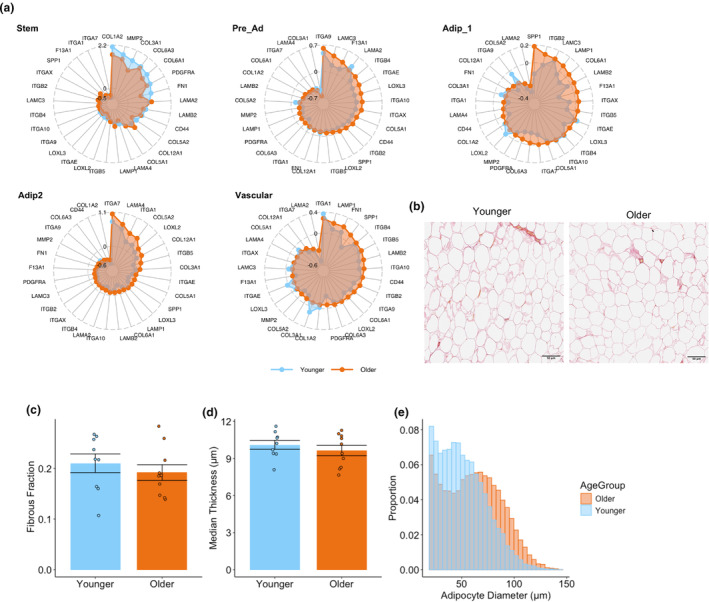
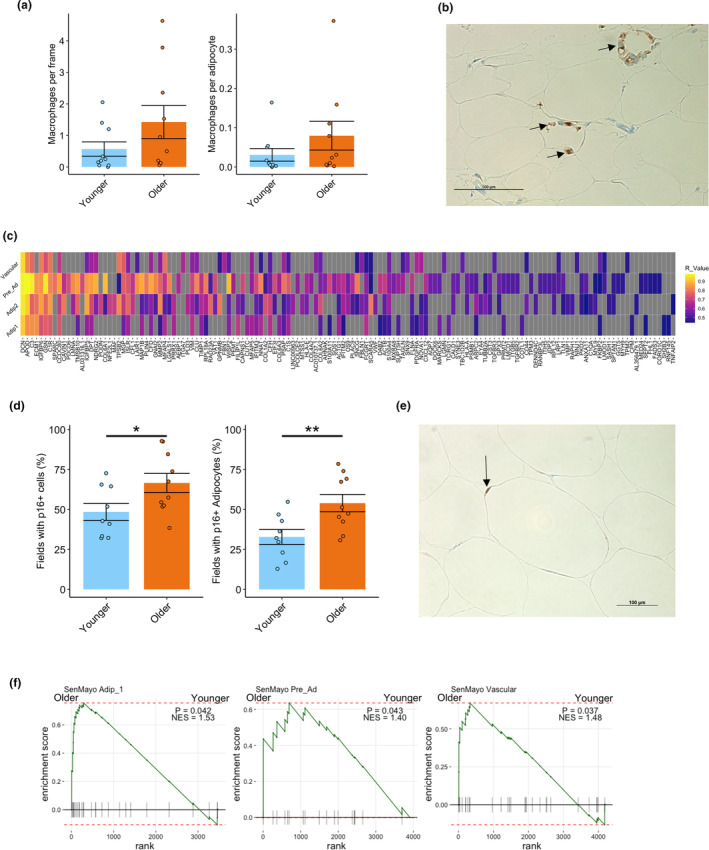
White adipose tissue (WAT) is a robust energy storage and endocrine organ critical for maintaining metabolic health as we age. Our aim was to identify cell-specific transcriptional aberrations that occur in WAT with aging. We leveraged full-length snRNA-Seq and histology to characterize the cellular landscape of human abdominal subcutaneous WAT in a prospective cohort of 10 younger (≤30 years) and 10 older individuals (≥65 years) balanced for sex and body mass index (BMI). The older group had greater cholesterol, very-low-density lipoprotein, triglycerides, thyroid stimulating hormone, and aspartate transaminase compared to the younger group (p < 0.05). We highlight that aging WAT is associated with adipocyte hypertrophy, increased proportions of lipid-associated macrophages and mast cells, an upregulation of immune responses linked to fibrosis in pre-adipocyte, adipocyte, and vascular populations, and highlight CXCL14 as a biomarker of these processes. We show that older WAT has elevated levels of senescence marker p16 in adipocytes and identify the adipocyte subpopulation driving this senescence profile. We confirm that these transcriptional and phenotypical changes occur without overt fibrosis and in older individuals that have comparable WAT insulin sensitivity to the younger individuals.

Keywords: White adipose tissue; aging; senescence; single nuclei RNA‐Seq.


Conflict of interest statement

The authors declare no conflict of interest.

Figures

FIGURE 1
FIGURE 1
Single nuclei transcriptional profiling of aging human abdominal subcutaneous white adipose tissue (WAT). Schematic overview of study design and methods (a). UMAP of 23,702 nuclei from abdominal subcutaneous white adipose tissue (WAT) of 10 younger and 10 older participants highlighting different cell populations (b). Dotplot of top 5 upregulated differentially expressed genes for each cell population and known cell markers (PDGFRA – Stem, ZNF423 – pre‐adipocytes, ADIPOQ – adipocytes, PECAM1 – vascular, CD86 – macrophages, ENPP3 – mast cells) (c). Nuclei composition differences between older and younger participants highlighting immune cells are elevated in the older Group (d).
FIGURE 2
FIGURE 2
Adipocyte heterogeneity. Heatmap of top differentially expressed genes between Adip_1 and Adip_2 (a). Selected significant (FDR < 0.05) pathways upregulated in Adip_1 and Adip_2 determined by an overrepresentation test from significant (adjusted p value < 0.05) upregulated (logFC >0.25) genes, highlighting Adip_1 to be enriched in genes related to oxidation and immune responses whereas Adip_2 was enriched in genes related to insulin signaling and lipid metabolism (b). Comparison of differentially expressed genes from previous publications, Whytock et al. (2022) and Bäckdahl et al. (2021) in relation to differences between Adip_1 and Adip_2 highlighting transcriptional similarities from previous work (c). If the dot is colored, it signifies the gene is significantly differentially regulated between Adip_1 and Adip_2.
FIGURE 3
FIGURE 3
Cell‐type transcriptional differences between older and younger participants. Upset plots showing overlap of differentially expressed genes (DEGs) (adjusted p value < 0.05 and logFC > 0.25) between cell types that are upregulated in younger and older groups (a). Top Hallmark and Reactome pathways significantly (FDR < 0.05) upregulated in each cell type for the younger and older group determined by an overrepresentation test on significantly (adjusted p value < 0.05) upregulated (logFC > 0.25) genes highlighting cell‐type transcriptional differences between the groups (b). If a cell type is not present, it did not have a significant pathway upregulated. Heatmaps of top differentially expressed genes contributing to the top pathways upregulated in the younger (upper panel) and older (lower panel) groups (c). Tiles that are grey do not have gene expression significantly different between older and younger groups for that cell type.
FIGURE 4
FIGURE 4
Fibrosis in aging WAT. Radar plots of differentially expressed extracellular remodeling and fibrosis genes in different cell types highlighting increased fibrosis in the older group in non‐stem cell populations (a). Representative picrosirius red staining in white adipose tissue in younger and older group (b). The fraction of adipose tissue with picrosirius red staining between younger and older group was not significantly different (c). The average median fibrosis thickness of each adipocyte between younger and older was not significantly different (d). Combined histogram of adipocyte size distribution normalized for total counts and split by age (e).
FIGURE 5
FIGURE 5
Macrophages and senescence in aging WAT. The number of macrophages per frame and per adipocytes stained for CD68 was not significantly different between the younger and older group (a). Representative image of macrophage crown‐like structure in the older group stained for CD68 (b). Heatmap of genes that positively correlated with CXCL14 expression in cell types that show markers of inflammation and fibrosis in the older group (c) Tiles that are grey do not have significant positive correlation to CXCL14 expression for that cell type. The percentage of 20X magnification fields that had cells and adipocytes with p16 staining was greater in older compared to younger participants (d). Representative image of p16 cell staining from an older individual with p16 in and adipocyte highlighted (e). GSEA plots of the SenMayo gene set showing greater enrichment in older compared to younger participants for Adip_1, Pre_Ad and Vascular cells (f). *p < 0.05; **p < 0.01. GSEA, gene set enrichment analysis.

Update of

Similar articles

Cited by

References

    1. Acosta, J. R. , Joost, S. , Karlsson, K. , Ehrlund, A. , Li, X. , Aouadi, M. , Kasper, M. , Arner, P. , Rydén, M. , & Laurencikiene, J. (2017). Single cell transcriptomics suggest that human adipocyte progenitor cells constitute a homogeneous cell population. Stem Cell Research & Therapy, 8(1), 250. 10.1186/s13287-017-0701-4 - DOI - PMC - PubMed
    1. Andreatta, M. , & Carmona, S. J. (2021). STACAS: Sub‐type anchor correction for alignment in Seurat to integrate single‐cell RNA‐seq data. Bioinformatics (Oxford, England), 37(6), 882–884. 10.1093/bioinformatics/btaa755 - DOI - PMC - PubMed
    1. Angueira, A. R. , Sakers, A. P. , Holman, C. D. , Cheng, L. , Arbocco, M. N. , Shamsi, F. , Lynes, M. D. , Shrestha, R. , Okada, C. , Batmanov, K. , Susztak, K. , Tseng, Y. H. , Liaw, L. , & Seale, P. (2021). Defining the lineage of thermogenic perivascular adipose tissue. Nature Metabolism, 3(4), 469–484. 10.1038/s42255-021-00380-0 - DOI - PMC - PubMed
    1. Aversa, Z. , White, T. A. , Heeren, A. A. , Hulshizer, C. A. , Saul, D. , Zhang, X. , Molina, A. J. A. , Redman, L. M. , Martin, C. K. , Racette, S. B. , Huffman, K. M. , Bhapkar, M. , Khosla, S. , Das, S. K. , Fielding, R. A. , Atkinson, E. J. , & LeBrasseur, N. K. (2023). Calorie restriction reduces biomarkers of cellular senescence in humans. Aging Cell, 23, e14038. 10.1111/acel.14038 - DOI - PMC - PubMed
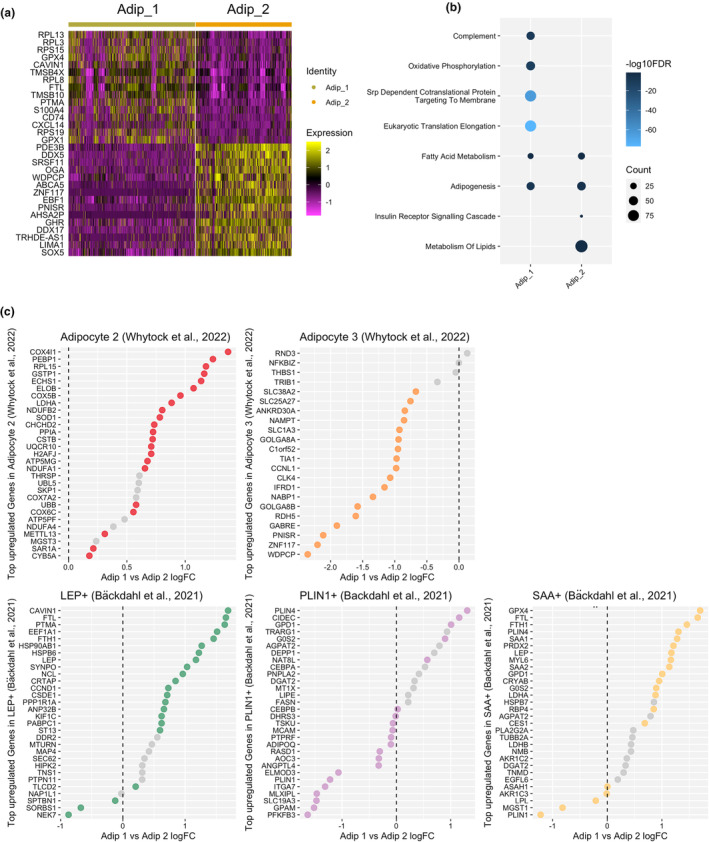
    1. Bäckdahl, J. , Franzén, L. , Massier, L. , Li, Q. , Jalkanen, J. , Gao, H. , Andersson, A. , Bhalla, N. , Thorell, A. , Rydén, M. , Ståhl, P. L. , & Mejhert, N. (2021). Spatial mapping reveals human adipocyte subpopulations with distinct sensitivities to insulin. Cell Metabolism, 33, 1869–1882. 10.1016/j.cmet.2021.07.018.e6. - DOI - PubMed