. 2024 Aug 16;10(33):eadn5993.
doi: 10.1126/sciadv.adn5993. Epub 2024 Aug 14.

Remodeling p38 signaling in muscle controls locomotor activity via IL-15

Affiliations

Remodeling p38 signaling in muscle controls locomotor activity via IL-15

Cintia Folgueira et al. Sci Adv. .

Abstract

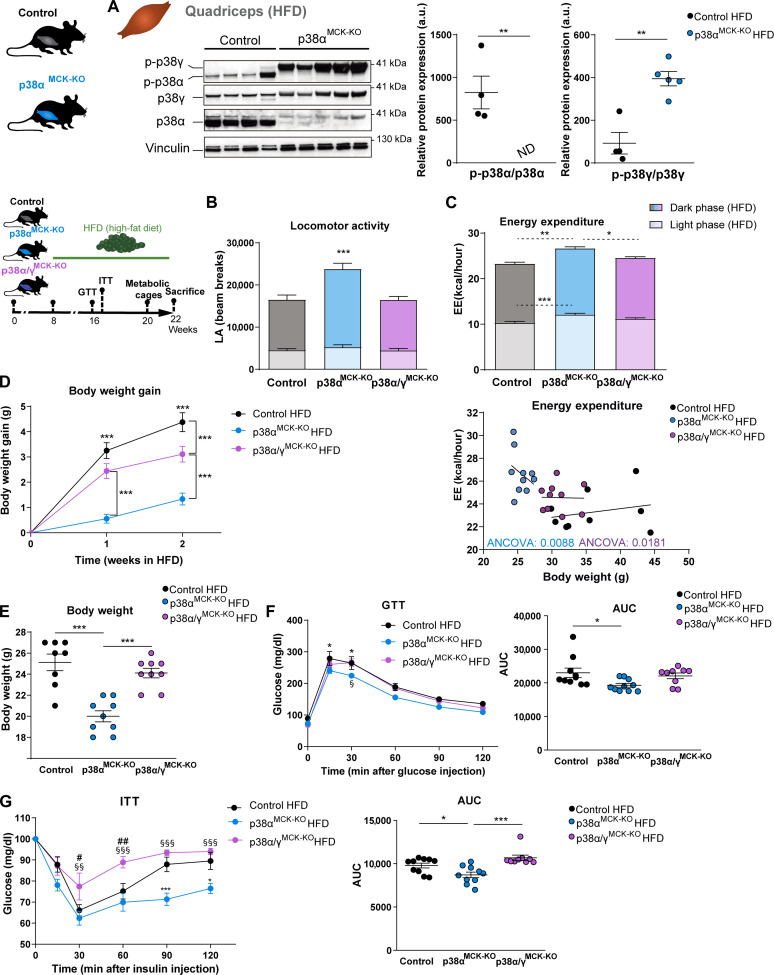
Skeletal muscle has gained recognition as an endocrine organ releasing myokines upon contraction during physical exercise. These myokines exert both local and pleiotropic health benefits, underscoring the crucial role of muscle function in countering obesity and contributing to the overall positive effects of exercise on health. Here, we found that exercise activates muscle p38γ, increasing locomotor activity through the secretion of interleukin-15 (IL-15). IL-15 signals in the motor cortex, stimulating locomotor activity. This activation of muscle p38γ, leading to an increase locomotor activity, plays a crucial role in reducing the risk of diabetes and liver steatosis, unveiling a vital muscle-brain communication pathway with profound clinical implications. The correlation between p38γ activation in human muscle during acute exercise and increased blood IL-15 levels highlights the potential therapeutic relevance of this pathway in treating obesity and metabolic diseases. These findings provide valuable insights into the molecular basis of exercise-induced myokine responses promoting physical activity.


Figures

Fig. 1.
Fig. 1.. Lack of p38α in striated muscle decreases body weight, improves glucose homeostasis, and exhibits enhanced and faster running behavior in mice fed an ND.
(A) Representative Western blot of human muscle samples from two individuals before exercise (Pre) and immediately after exercise (Post) {at the end of the incremental test to exhaustion [post exhaustion test (Exh)] and post Wingate test (Win)} was examined with antibody against phospho-p38. Quantifications are shown. Vinculin protein expression was monitored as a loading control. Data are normalized to pre-exercise levels and shown as means ± SEM; *P < 0.05 and **P < 0.01. Student’s t test; n = 10. a.u., arbitrary units. (B to F) Eight-week-old p38αMCK-KO and control mice were fed a normal chow diet (ND). (B) Body weight; (C) fasting and fed plasma glucose levels at 16 weeks old; (D) glucose tolerance test (GTT) and area under the curve (AUC). Mice fasted overnight were injected intraperitoneally with glucose (1 g/kg) and blood glucose concentration was measured at the indicated time points. (E) Distance run and (F) speed during 24-hour period measured in metabolic cages with wheels. Data are shown as means ± SEM; *P < 0.05 and ***P < 0.001; Student’s t test (B to F); two-way analysis of variance (ANOVA) coupled to Bonferroni’s multiple comparisons test (D); n = 7 to 13.
Fig. 2.
Fig. 2.. Lack of p38α in striated muscle increases voluntary locomotor activity, protects against HFD-induced obesity, improves glucose metabolism, and reduces hepatic steatosis.
p38αMCK-KO and control mice were fed HFD, and body weight was monitored for 8 weeks. (A) Body weight gain measured at the indicated times during HFD treatment. (B) Body weight measured at sacrifice. (C) Locomotor activity (LA) during a 48-hour period after HFD. (D) Energy expenditure (EE) and analysis of covariance (ANCOVA). (E) Fasting and fed plasma glucose levels. (F) Fasting plasma insulin levels. (G) Insulin resistance rate calculated as homeostasis model assessment of insulin resistance (HOMA-IR) ratio. (H) GTT and AUC. Mice fasted overnight were injected intraperitoneally with glucose (1 g/kg). (I) Insulin release assay and AUC. Mice fasted overnight were injected intraperitoneally with glucose (2 g/kg), and insulin levels were measured at the indicated points. (J) Insulin tolerance test (ITT) and AUC. Mice fed ad libitum were injected intraperitoneally with insulin (0.75 U/kg). Blood glucose concentration was measured at the indicated points in GTT and ITT. Data are shown as means ± SEM; *P < 0.05, **P < 0.01, and ***P < 0.001; two-way ANOVA coupled to Bonferroni’s multiple comparisons test (A and H to J); Student’s t test [with Welch’s correction for LA-dark phase, for glucose (fasted) and HOMA-IR] (B to J); n = 6 to 14. Gluc, glucose; Ins, insulin. (K and L) p38αMCK-KO and control mice were fed an HFD, fasted overnight, and euthanized. (K) Representative H&E– and (L) Oil Red O–stained liver sections are presented. Scale bars, 150 μm. n = 5.
Fig. 3.
Fig. 3.. Lack of p38γ in p38αMCK-KO mice loses their protection against HFD-induced obesity and diabetes.
Eight-week-old p38αMCK-KO and control mice were fed an HFD, fasted overnight, and euthanized. (A) Extracts prepared from quadriceps were examined by immunoblot analysis with antibodies against phospho (p)–p38 and total protein levels. Quantifications are shown. Vinculin protein expression was monitored as a loading control. Student’s t test; n = 4 to 5. (B and C) p38α/γMCK-KO, p38αMCK-KO, and control mice were fed an HFD, and metabolic parameters were assayed. (B) LA and (C) EE and ANCOVA. Data are shown as means ± SEM; *P < 0.05, **P < 0.01, and ***P < 0.001; one-way ANOVA coupled to Bonferroni’s multiple comparisons test; n = 9 to 10. * Symbols indicate differences between p38αMCK-KO and control mice unless otherwise indicated. (D and E) p38α/γMCK-KO, p38αMCK-KO, and control mice were fed HFD, and body weight was monitored for 2 weeks. (D) Body weight gain measured at the indicated times during HFD treatment. (E) Body weight measured during HFD feeding. Data are shown as means ± SEM; ***P < 0.001; one-way (E) or two-way ANOVA (D) coupled to Bonferroni’s multiple comparisons test; n = 8 to 9. * Symbols indicate differences between p38αMCK-KO and control mice unless otherwise indicated. (F and G) p38α/γMCK-KO, p38αMCK-KO, and control mice were fed a HFD for 3 weeks. (F) GTT and AUC. (G) ITT and AUC. Data are shown as means ± SEM; *, #, or §P < 0.05; ## or §§P < 0.01; *** or §§§P < 0.001; two-way ANOVA coupled to Bonferroni’s multiple comparisons test; n = 9 to 10. * Symbols depict significant differences between p38αMCK-KO and control mice; # symbols indicate significant differences between p38α/γMCK-KO and control mice; and § symbols depict significant differences between p38α/γMCK-KO and p38αMCK-KO mice.
Fig. 4.
Fig. 4.. p38γ activation increase LA.
Eight-week-old WT mice fed an ND were injected intravenously (iv) with 5 × 10¹¹ per mice AAV-scramble or AAV-sk-cm4-cherry-p38γ* (active p38γ). (A) Representative anti-cherry immunohistochemistry muscle sections are presented at ×20 magnification. (B) LA, (C) wheel distance run, (D) wheel speed in metabolic cages, and (E) body weight change 4 weeks after AAV-scramble or AAV-sk-cm4-cherry-p38γ* intravenous injection. (F and G) Measurement of exercise capacity using a graded exercise treadmill, and mice were run to exhaustion. (F) Maximal velocity, total distance, work, and power were evaluated in p38αMCK-KO and control mice and (G) in WT mice 4 weeks after AAV-scramble or AAV-sk-cm4-cherry-p38γ* intravenous injection. Data are shown as means ± SEM; *P < 0.05, **P < 0.01, and ***P < 0.001. Student’s t test (B to G); n = 7 to 10.
Fig. 5.
Fig. 5.. p38αMCK-KO mice have higher muscle IL-15 expression and increased plasma IL-15 levels following exercise controlled by the motor cortex.
(A to C) RNA-seq analysis with gastrocnemius samples from HFD-fed p38αMCK-KO, p38α/γMCK-KO, and control mice, fasted overnight. (A) Venn diagram illustrating differentially expressed genes (DEGs) for secreted proteins comparing p38αMCK-KO or p38α/γMCK-KO mice with controls, (B) heatmap, (C) Il-15 mRNA expression in RNA-seq. (D) Il-15 measure by qRT-PCR normalized to Rps18 mRNA. Data are normalized to control mice (E) IL-15 levels of mice subjected to treadmill exercise for 30 min. (F and G) Eight-week-old WT mice fed an ND were injected iv with IL-15 (500 pg per mice). (F) LA and (G) EE and ANCOVA 48 hours after injection. (H) Tail suspension test performed in 18- to 23-week-old mice fed a ND. (I) Extracts prepared from the motor cortex were examined by immunoblot analysis with indicated antibodies. Data are normalized to control mice. (J to N) Eight- to 11-week-old mice were injected in the motor cortex with an shRNA targeting IL-15Rα (shIL-15Rα) or a control sequence (shScramble) by stereotaxic surgery. (J) Schematic representation of the brain area targeted during the surgical procedure. (K) LA during a 48-hour period 4 weeks after stereotaxic injection. (L and M) Four weeks after stereotaxic injection p38αMCK-KO, and control mice were placed on an HFD and GTT and AUC were measured. Mice fasted overnight were injected intraperitoneally with glucose (1 g/kg). (N) Tail suspension test was performed. Data are shown as means ± SEM; (A to D, H, and I) one-way ANOVA coupled to Bonferroni’s multiple comparisons test or Student’s t test (E and G); *, $, or #P < 0.05; **, $$, or ##P < 0.01; ***, $$$, or ###P < 0.001.
Fig. 6.
Fig. 6.. Muscle p38γ activation upon exercise stimulates IL-15 secretion.
(A and B) Eight-week-old control mice were subjected to treadmill exercise for 30 min, and (A) gastrocnemius and (B) blood samples were extracted after exercise. Immunoblot analysis and quantification of muscle phospho-p38γ, p38γ total, and circulating IL-15 levels immediately after exercise are shown. Data are shown as means ± SEM; *P < 0.05, **P < 0.01, and ***P < 0.001; Student’s t test; n = 4. (C and D) Gastrocnemius samples were extracted from trained and non-trained mice. Immunoblot analysis and quantification of muscle phospho-p38γ (p-p38γ)/phospho-p38α (p-p38α) and phospho-p38γ (p-p38γ)/phospho-p38α (p-p38α) ratio and p38γ/p38α ratio. Vinculin protein expression was monitored as a loading control. Data are shown as means ± SEM; **P < 0.01; Student’s t test; n = 4. (E) Muscle human samples obtained before exercise, immediately after exercise (at the end of the incremental test to exhaustion (post exhaustion test) and post Wingate test) were examined by immunoblot analysis with antibodies against phospho-p38γ, p38γ total, and IL-15. Vinculin protein expression was monitored as a loading control. (F) Il-15 circulating levels were measured in human samples obtained before exercise and after exercise. Quantifications are shown. Data are normalized to pre-exercise levels and shown as means ± SEM; *P < 0.05, **P < 0.01, and ***P < 0.001. Student’s t test; n = 13 to 16. (G) Circulating IL-15 expression in patient controls and patients with obesity. Data are shown as means ± SEM; **P < 0.01. Student’s t test; n = 8 to 9.

References

    1. World Health Organization (WHO), “Obesity and overweight” (WHO, 2020); www.who.int/news-room/fact-sheets/detail/obesity-and-overweight.
    1. Greenwood B. N., Foley T. E., Le T. V., Strong P. V., Loughridge A. B., Day H. E., Fleshner M., Long-term voluntary wheel running is rewarding and produces plasticity in the mesolimbic reward pathway. Behav. Brain Res. 217, 354–362 (2011). - PMC - PubMed
    1. Atakan M. M., Kosar S. N., Guzel Y., Tin H. T., Yan X., The role of exercise, diet, and cytokines in preventing obesity and improving adipose tissue. Nutrients 13, 1459 (2021). - PMC - PubMed
    1. Priest C., Tontonoz P., Inter-organ cross-talk in metabolic syndrome. Nat. Metab. 1, 1177–1188 (2019). - PubMed
    1. Chow L. S., Gerszten R. E., Taylor J. M., Pedersen B. K., van Praag H., Trappe S., Febbraio M. A., Galis Z. S., Gao Y., Haus J. M., Lanza I. R., Lavie C. J., Lee C. H., Lucia A., Moro C., Pandey A., Robbins J. M., Stanford K. I., Thackray A. E., Villeda S., Watt M. J., Xia A., Zierath J. R., Goodpaster B. H., Snyder M. P., Exerkines in health, resilience and disease. Nat. Rev. Endocrinol. 18, 273–289 (2022). - PMC - PubMed

Publication types

Substances