. 2024 Sep:107:105283.
doi: 10.1016/j.ebiom.2024.105283. Epub 2024 Aug 13.

Regulator of G-protein signaling expression in human intestinal enteroendocrine cells and potential role in satiety hormone secretion in health and obesity

Affiliations

Regulator of G-protein signaling expression in human intestinal enteroendocrine cells and potential role in satiety hormone secretion in health and obesity

Alison N McRae et al. EBioMedicine. 2024 Sep.

Abstract

Background: Gut L-type enteroendocrine cells (EECs) are intestinal chemosensory cells that secrete satiety hormones GLP-1 and PYY in response to activation of G-protein coupled receptors (GPCRs) by luminal components of nutrient digestion and microbial fermentation. Regulator of G-protein Signaling (RGS) proteins are negative regulators of GPCR signaling. The expression profile of RGS in EECs, and their potential role in satiety hormone secretion and obesity is unknown.

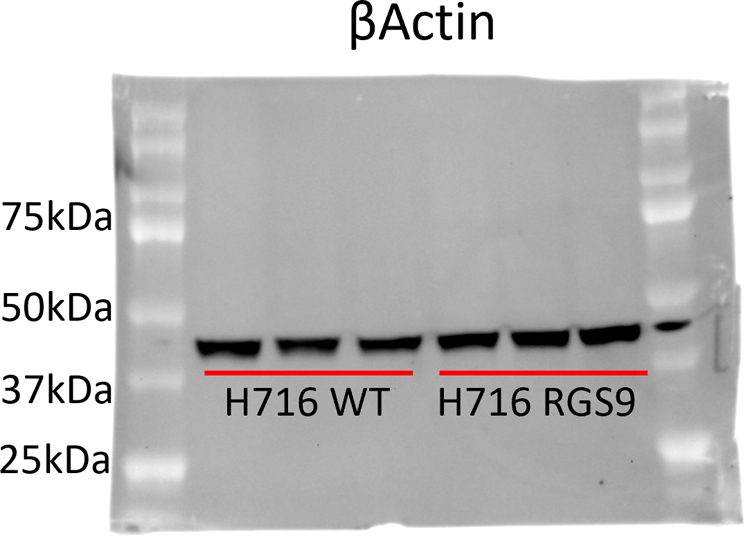
Methods: Transcriptomic profiling of RGS was completed in native colonic EECs was completed using single-cell RNA sequencing (scRNA-Seq) in lean and obesity, and human jejunal EECs with data obtained from a publicly available RNAseq dataset (GSE114853). RGS validation studies were completed using whole mucosal intestinal tissue obtained during endoscopy in 61 patients (n = 42 OB, n = 19 Lean); a subset of patients' postprandial plasma was assayed for GLP-1 and PYY. Ex vivo human intestinal cultures and in vitro NCI-H716 cells overexpressing RGS9 were exposed to GLP-1 secretagogues in conjunction with a nonselective RGS-inhibitor and assayed for GLP-1 secretion.

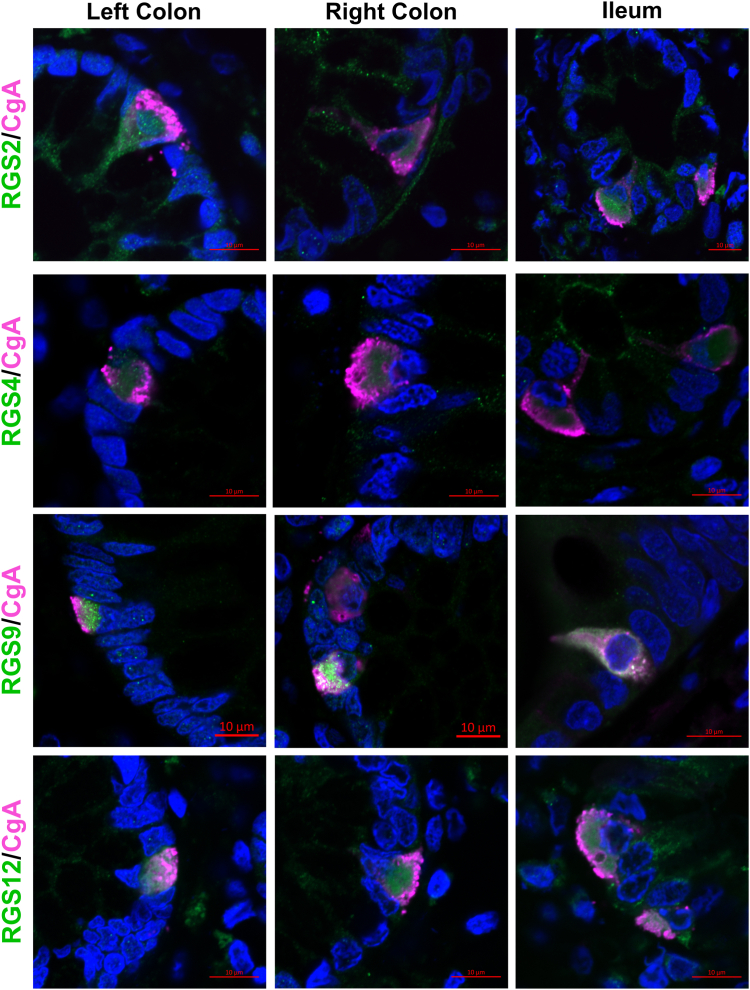
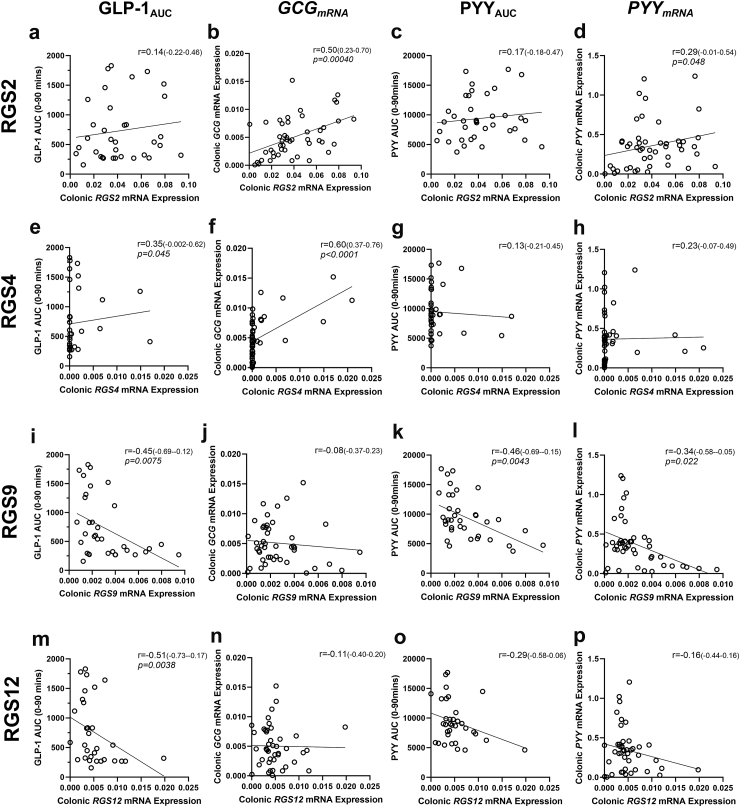
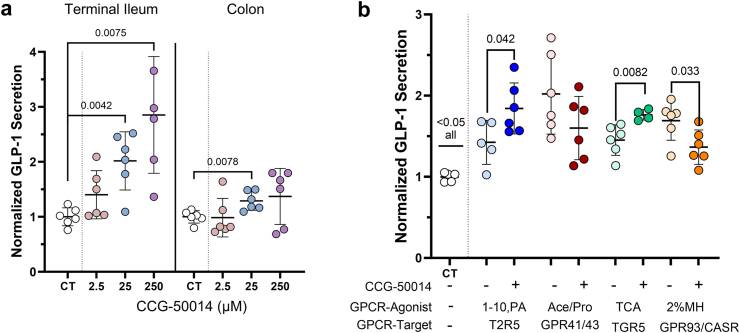
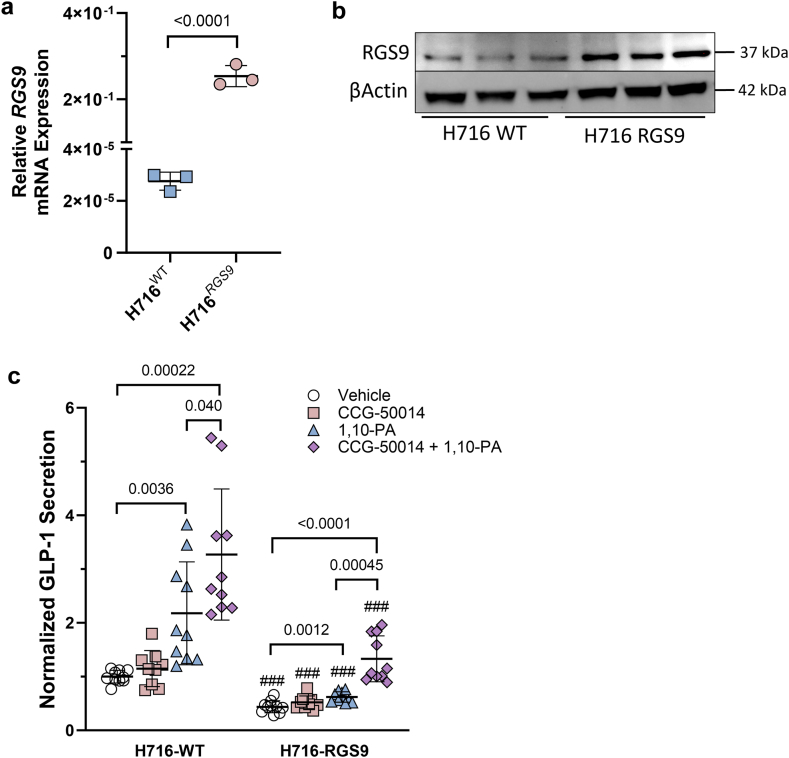
Findings: Transcriptomic profiling of colonic and jejunal enteroendocrine cells revealed a unique RGS expression profile in EECs, and further within GLP-1+ L-type EECs. In obesity the RGS expression profile was altered in colonic EECs. Human gut RGS9 expression correlated positively with BMI and negatively with postprandial GLP-1 and PYY. RGS inhibition in human intestinal cultures increased GLP-1 release from EECs ex vivo. NCI-H716 cells overexpressing RGS9 displayed defective nutrient-stimulated GLP-1 secretion.

Interpretation: This study introduces the expression profile of RGS in human EECs, alterations in obesity, and suggests a role for RGS proteins as modulators of GLP-1 and PYY secretion from intestinal EECs.

Funding: AA is supported by the NIH(C-Sig P30DK84567, K23 DK114460), a Pilot Award from the Mayo Clinic Center for Biomedical Discovery, and a Translational Product Development Fund from The Mayo Clinic Center for Clinical and Translational Science Office of Translational Practice in partnership with the University of Minnesota Clinical and Translational Science Institute.

Keywords: Enteroendocrine cells; GLP-1; L-cells; Obesity; PYY; RGS; scRNA-Seq.


Conflict of interest statement

Declaration of interests AA is a stockholder in Gila Therapeutics, Phenomix Sciences. AA provides consulting services for Rhythm Pharmaceuticals, General Mills, Amgen, RareStone, and Bausch Health. DH provides consulting services for Novo Nordisk and receives presentation compensation from the Obesity Medicine Association and The Menopause Society.

Figures

Fig. 1
Fig. 1
Transcriptomic profiling of the RGS family in intestinal human EECs and alterations in obesity a) mRNA Expression levels of RGS family genes within three defined cell types: L-type EECs (red bars), non-L-type EECs (blue bars) and non EECs (green bars) in the human colon profiled from the present scRNAseq study (striped bars), and human jejunum profiled from previous a RNAseq study from Roberts et al., 2019 (solid bars). Fold-Enrichment values of RGS family mRNA expression within b) L-type EECs compared to non-L-type EECs and c) L-type EECs compared to non-EECs in human colon profiled from the present scRNAseq study (red bars), and human jejunum profiled from previous a RNAseq study from Roberts et al., 2019 (blue bars). The average proportion of d) all colon EECs within cluster or e) L-type cells within EECs expressing detected RGS family genes. f) RGS family genes demonstrating differential expression in all EECs within cluster for obesity compared to lean. Bar charts display the Mean value for respective data. Error bar lines denote SD. # denotes physiologically relevant finding defined as RGS genes displaying differential Log2FC in obesity with p < 0.20 in either all EECs or L-type EECs.
Fig. 2
Fig. 2
Validation of the colonic enteroendocrine cell RGS profile and its intestinal transcriptomic alterations in obesity. a) colonic RGS expression comparing lean (green triangle, n = 16 total cohort) and obesity (purple diamonds, n = 31 total cohort). Associations of BMI (kg/m2) with colonic mRNA expression of b)RGS2c)RGS4d)RGS9, and e)RGS12. Significance testing used a two-tailed unpaired Welch's t-test to compare between lean and obesity; data showing individual values within a group include a vertical error bar line, denoting SD, and a horizontal line denoting Mean value. The Spearman rank correlation analysis quantified the relationship between respective RGS expression and BMI. Spearman's correlation coefficient (r) is reported with 95% CI.
Fig. 3
Fig. 3
Validation of RGS Expression in Human Intestinal Tissue. Immunofluorescence (IF) staining of human mucosal colonic and ileal tissue sections demonstrating coexpression of RGS (green) with CgA (pink); red bar indicates 10 μm, nuclei stained with DAPI (Blue). 40x water Immersion objective.
Fig. 4
Fig. 4
Correlation of colonic RGS expression and satiety hormones. mRNA Expression of colonic RGS2 associations with area under the curve (AUC) for plasma concentrations of a) GLP-1, and c) PYY for time points 0–90 min postprandial (n = 34), and colonic expression of b)GCG and d)PYY mRNA (n = 47). mRNA Expression of colonic RGS4 associations with AUC 0-90 mins for plasma concentrations of e) GLP-1, and g) PYY and colonic expression of f)GCG and h)PYY mRNA. mRNA Expression of colonic RGS9 associations with AUC 0-90 mins for plasma concentrations of i) GLP-1, and k) PYY and colonic expression of j)GCG and l)PYY mRNA. mRNA Expression of colonic RGS12 associations with AUC 0-90 mins for plasma concentrations of m) GLP-1, and o) PYY and colonic expression of n)GCG and p)PYY mRNA. Cohort of 47 participants with colonic biopsies, 34 of which also had postprandial plasma GLP-1 and PYY. Significance testing used the Spearman rank correlation test to quantify the relationship between the two tested variables in each panel. Spearman's correlation coefficient (r) is reported with 95% CI.
Fig. 5
Fig. 5
Human gut RGS and functional relation to GPCR-mediated hormone secretion. a) Primary cultures of human terminal ileum and colon were treated for 2 h with increasing doses of the nonspecific RGS inhibitor CCG-50014 and measured for secretion of GLP-1 into the media. b) Primary cultures of human terminal ileum were treated with known satiety hormone secretagogues (2% meat hydrolysate, 500 μM 1,10-Phenanthroline, 500 μM sodium acetate) in the presence or absence of 25 μM CCG-50014 and measured for secretion of GLP-1. Data expressed as fold-change to the respective controls. Data showing individual values within a group include a vertical error bar line, denoting SD, and a horizontal line denoting Mean value. Significance testing used a two-tailed unpaired Welch's t-test to compare between signified groups.
Fig. 6
Fig. 6
NCI–H716 transgenic line overexpressing RGS9 and GPCR-mediated hormone secretion. a) Relative mRNA, measured by RT-qPCR and protein expression using b) Western blot and of RGS9 in wild-type (H716WT) or RGS9 overexpressing H716 cells (H716RGS9). c) GLP-1 secretion from H716WT and H716RGS9 cells treated for 2 h without and with CCG-50014 in response to 1,10 Phenanthroline (1 mM), compared to vehicle control (DPBS). Data expressed as normalized to protein content, and as fold-change to the wild-type control. Data showing individual values within a group include a vertical error bar line, denoting SD, and a horizontal line denoting Mean value. Significance testing used a two-tailed unpaired Welch's t-test to compare between signified groups among respective cells. Significance testing used a two-tailed unpaired Welch's t-test to compare GLP-1 between wild-type and H716RGS9 for respective treatments ###p < 0.001.
WB BACT Original.png
WB RGS9 Original.png

References

    1. Gribble F.M., Reimann F. Function and mechanisms of enteroendocrine cells and gut hormones in metabolism. Nat Rev Endocrinol. 2019;15(4):226–237. - PubMed
    1. Gribble F.M., Reimann F. Enteroendocrine cells: chemosensors in the intestinal epithelium. Annu Rev Physiol. 2016;78:277–299. - PubMed
    1. Beumer J., Artegiani B., Post Y., et al. Enteroendocrine cells switch hormone expression along the crypt-to-villus BMP signalling gradient. Nat Cell Biol. 2018;20(8):909–916. - PMC - PubMed
    1. Haber A.L., Biton M., Rogel N., et al. A single-cell survey of the small intestinal epithelium. Nature. 2017;551(7680):333–339. - PMC - PubMed
    1. Mace O.J., Tehan B., Marshall F. Pharmacology and physiology of gastrointestinal enteroendocrine cells. Pharmacol Res Perspect. 2015;3(4) - PMC - PubMed