. 2024 Sep:75:103300.
doi: 10.1016/j.redox.2024.103300. Epub 2024 Aug 10.

Loss of NAMPT and SIRT2 but not SIRT1 attenuate GLO1 expression and activity in human skeletal muscle

Affiliations

Loss of NAMPT and SIRT2 but not SIRT1 attenuate GLO1 expression and activity in human skeletal muscle

Edwin R Miranda et al. Redox Biol. 2024 Sep.

Abstract

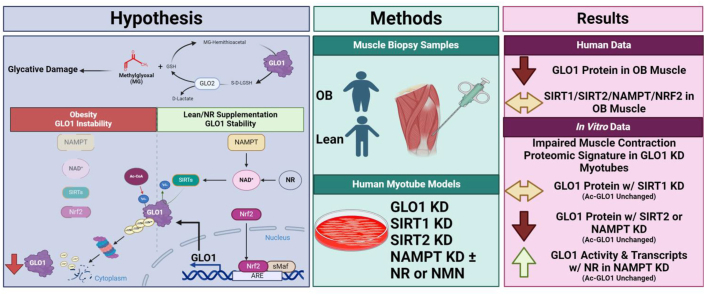
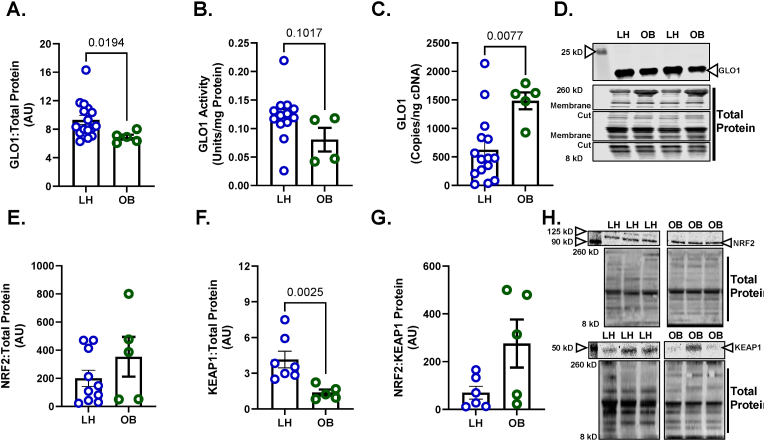
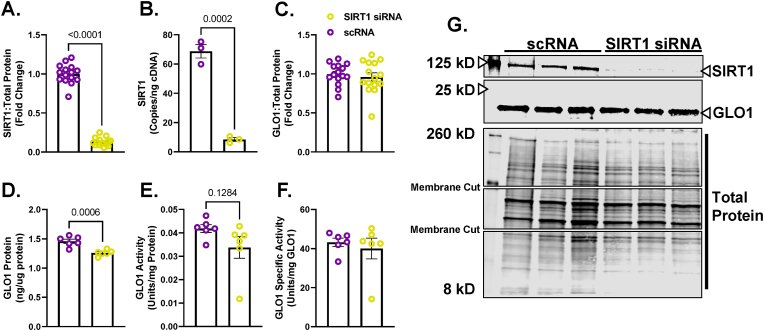
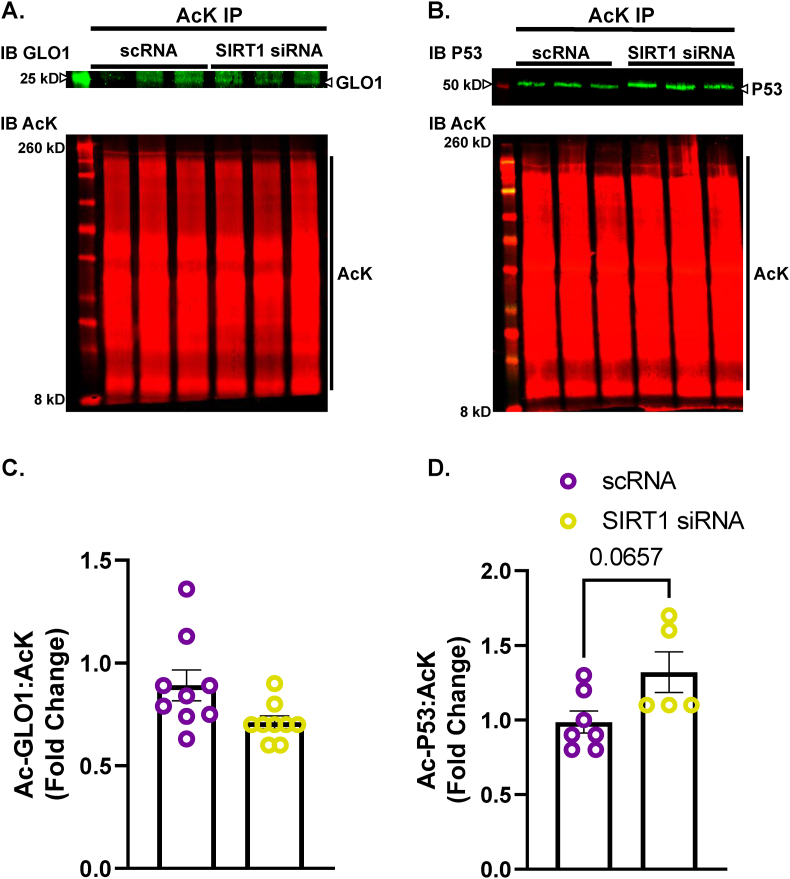
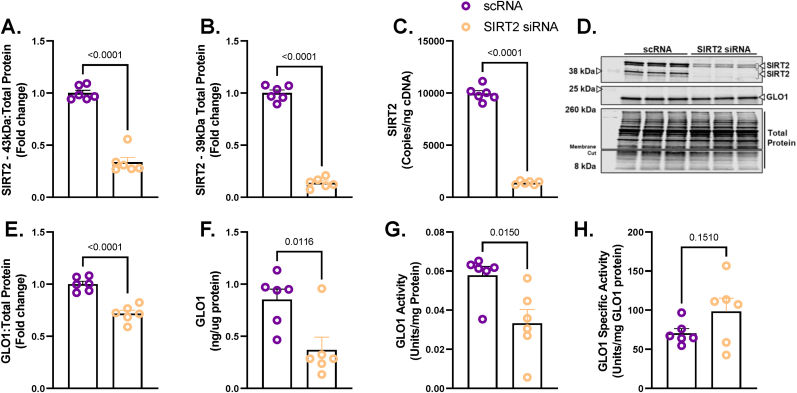
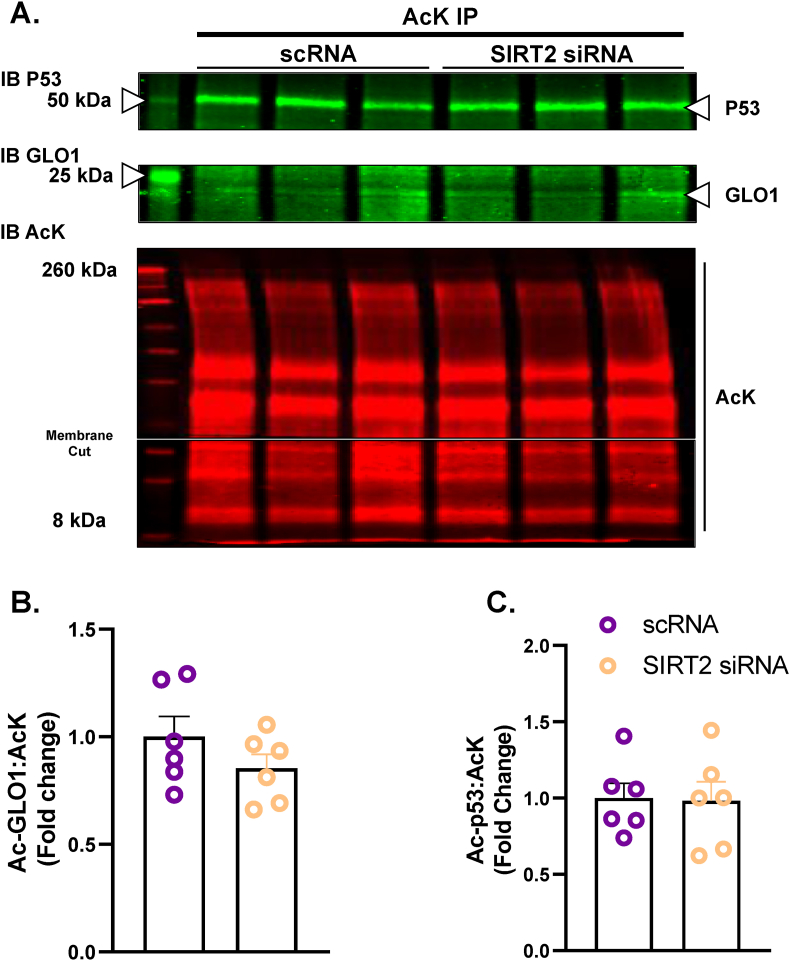
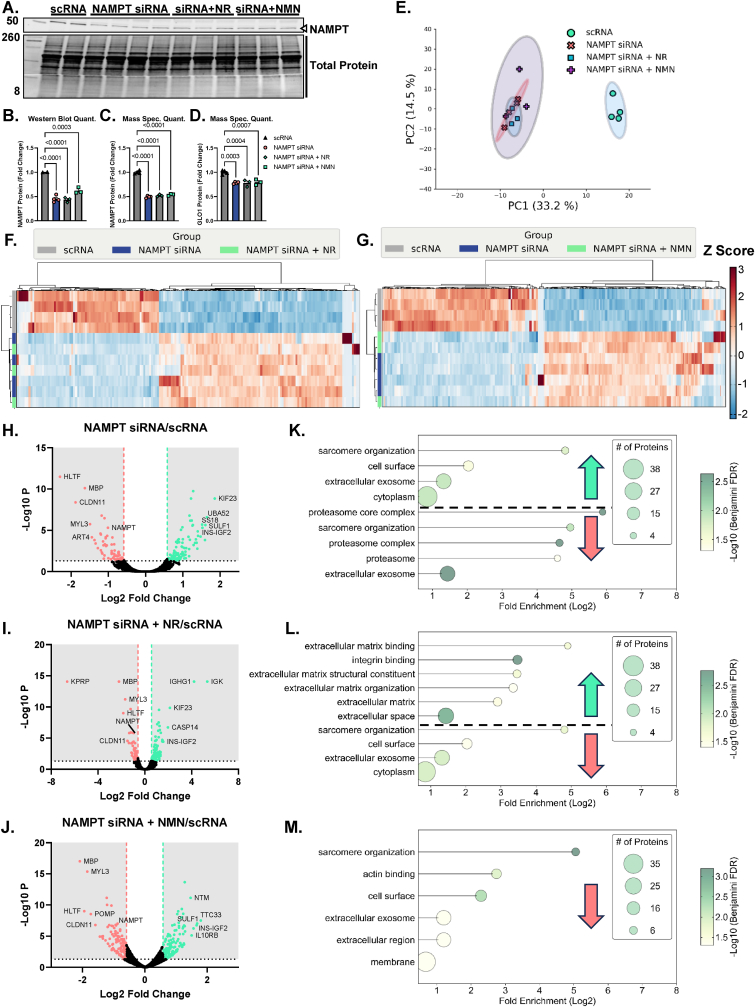
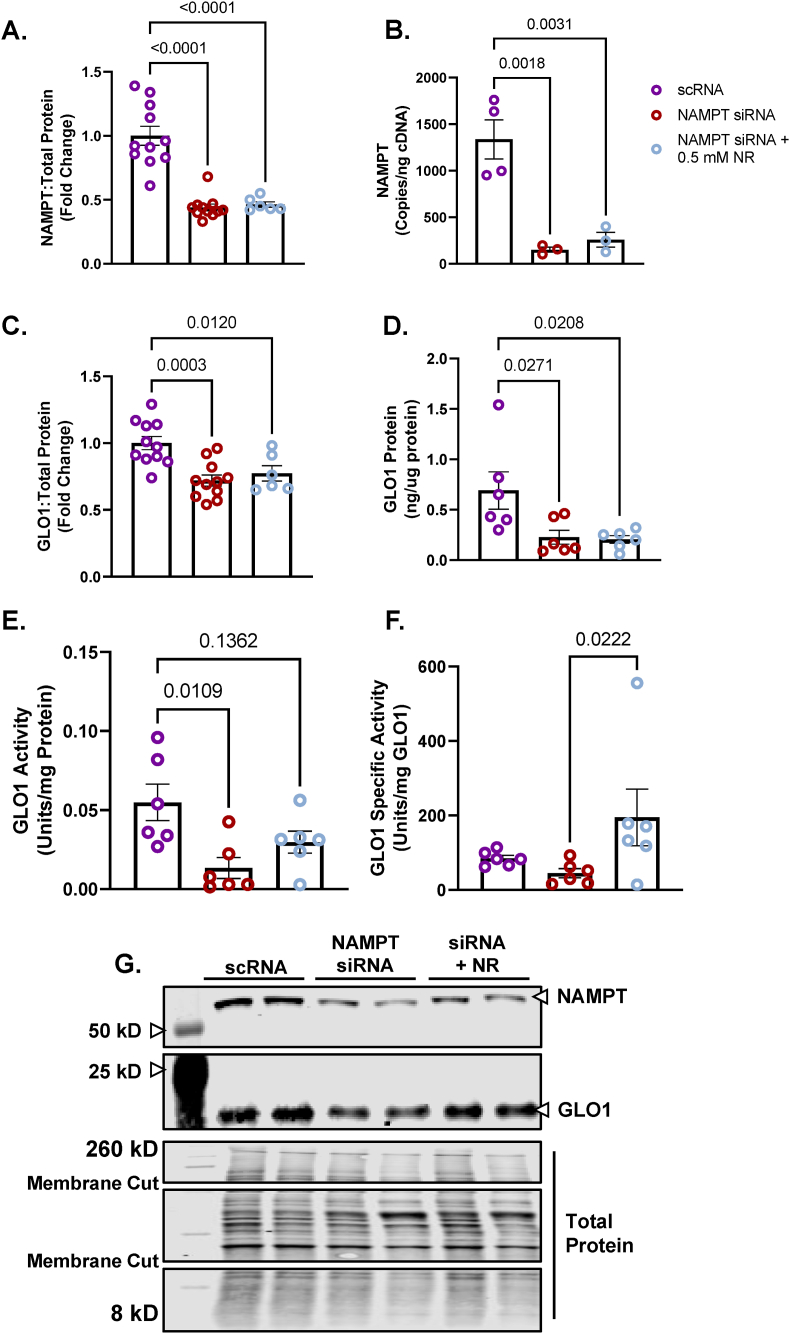
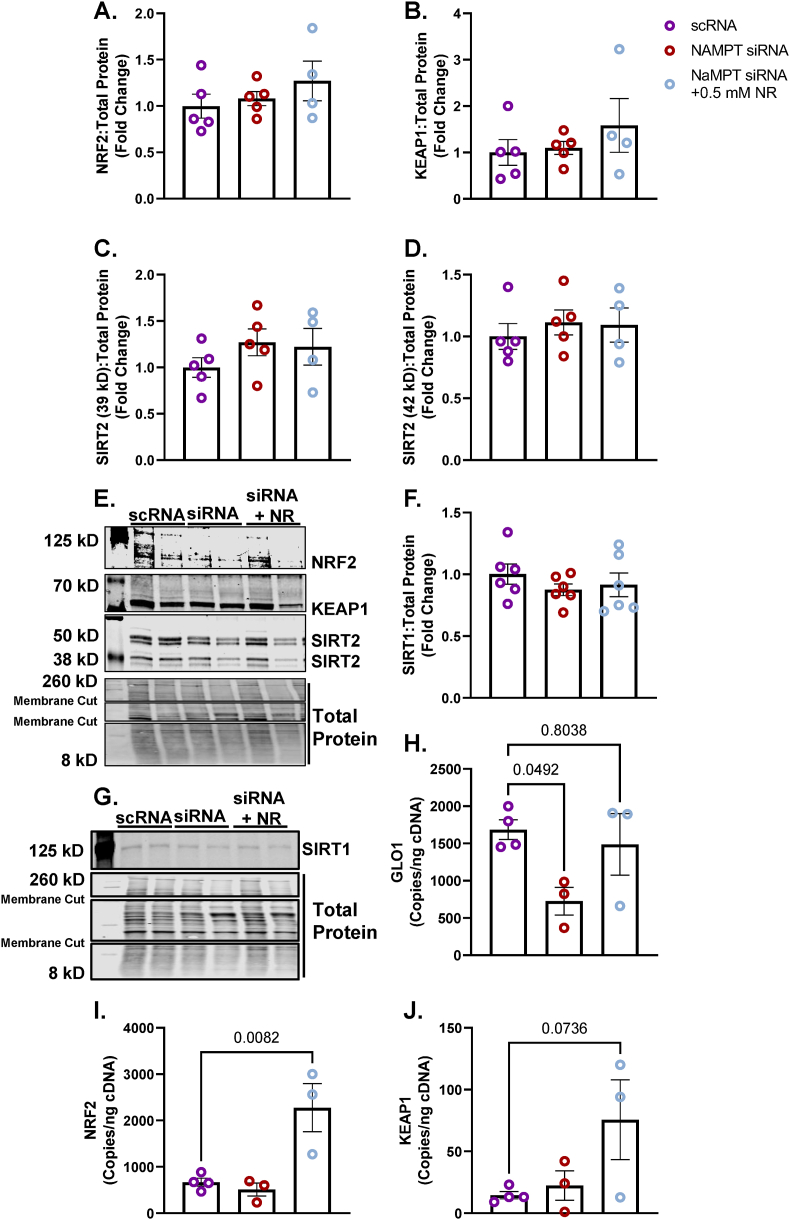
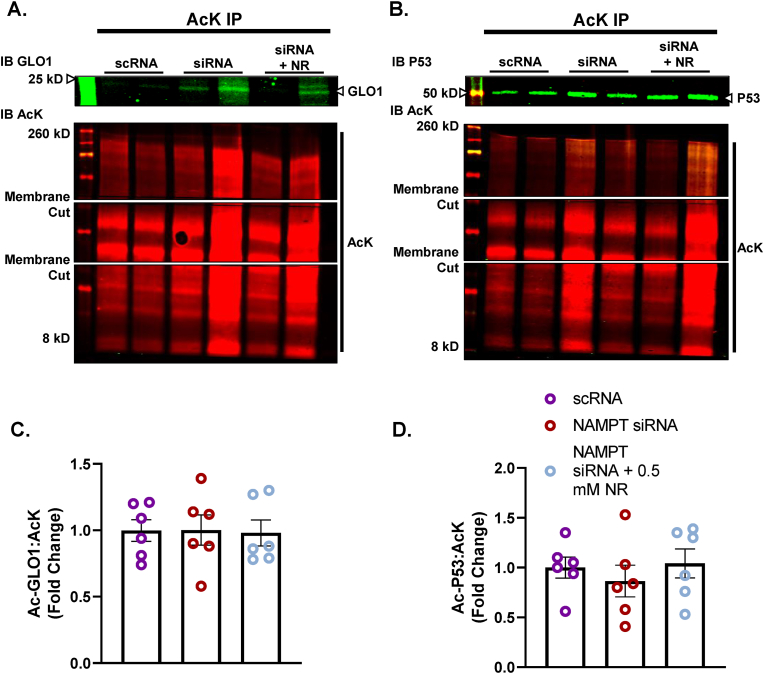
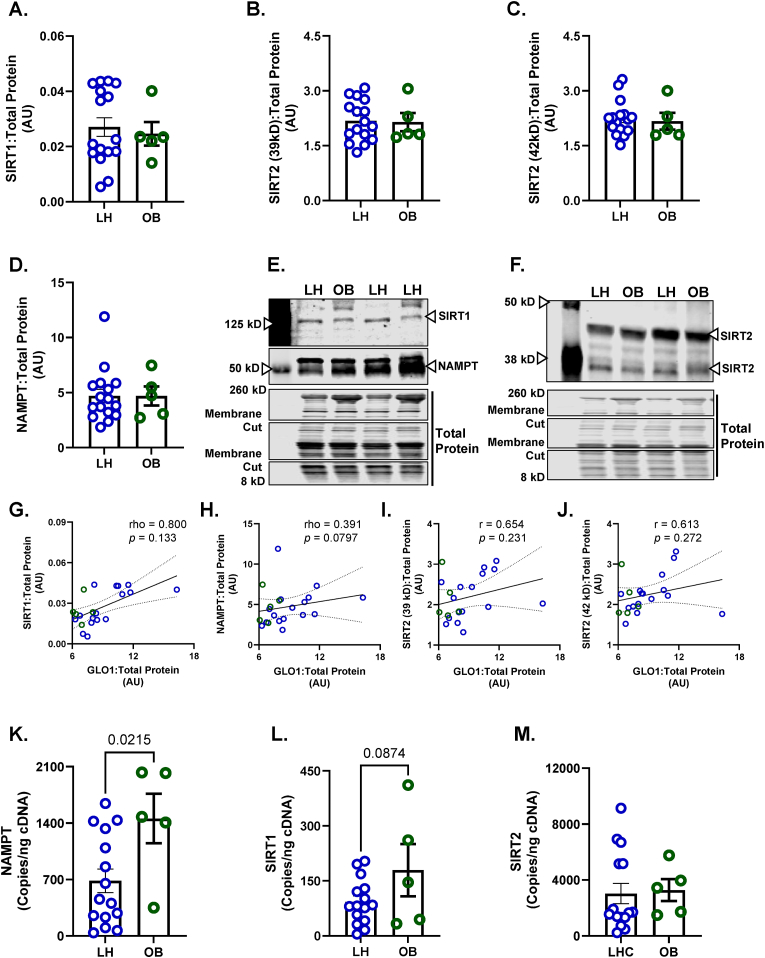
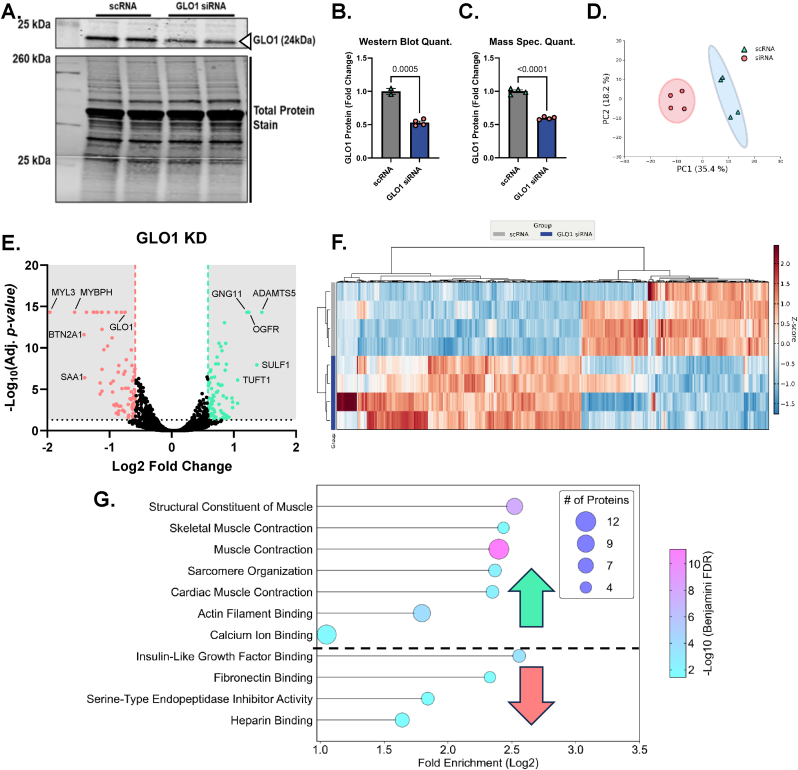
Glyoxalase I (GLO1) is the primary enzyme for detoxification of the reactive dicarbonyl methylglyoxal (MG). Loss of GLO1 promotes accumulation of MG resulting in a recapitulation of diabetic phenotypes. We previously demonstrated attenuated GLO1 protein in skeletal muscle from individuals with type 2 diabetes (T2D). However, whether GLO1 attenuation occurs prior to T2D and the mechanisms regulating GLO1 abundance in skeletal muscle are unknown. GLO1 expression and activity were determined in skeletal muscle tissue biopsies from 15 lean healthy individuals (LH, BMI: 22.4 ± 0.7) and 5 individuals with obesity (OB, BMI: 32.4 ± 1.3). GLO1 protein was attenuated by 26 ± 0.3 % in OB compared to LH skeletal muscle (p = 0.019). Similar reductions for GLO1 activity were observed (p = 0.102). NRF2 and Keap1 expression were equivocal between groups despite a 2-fold elevation in GLO1 transcripts in OB skeletal muscle (p = 0.008). GLO1 knock-down (KD) in human immortalized myotubes promoted downregulation of muscle contraction and organization proteins indicating the importance of GLO1 expression for skeletal muscle function. SIRT1 KD had no effect on GLO1 protein or activity whereas, SIRT2 KD attenuated GLO1 protein by 28 ± 0.29 % (p < 0.0001) and GLO1 activity by 42 ± 0.12 % (p = 0.0150). KD of NAMPT also resulted in attenuation of GLO1 protein (28 ± 0.069 %, p = 0.003), activity (67 ± 0.09 %, p = 0.011) and transcripts (50 ± 0.13 %, p = 0.049). Neither the provision of the NAD+ precursors NR nor NMN were able to prevent this attenuation in GLO1 protein. However, NR did augment GLO1 specific activity (p = 0.022 vs NAMPT KD). These perturbations did not alter GLO1 acetylation status. SIRT1, SIRT2 and NAMPT protein levels were all equivocal in skeletal muscle tissue biopsies from individuals with obesity and lean individuals. These data implicate NAD+-dependent regulation of GLO1 in skeletal muscle independent of altered GLO1 acetylation and provide rationale for exploring NR supplementation to rescue attenuated GLO1 abundance and activity in conditions such as obesity.

Keywords: Dicarbonyl stress; Methylglyoxal; NAD(+); Nicotinamide riboside.


Conflict of interest statement

Declaration of competing interest The authors declare that they have no known competing financial interests or personal relationships that could have appeared to influence the work reported in this paper.

Figures

Image 1
Graphical abstract
Fig. 1
Fig. 1
GLO1 is Attenuated in Skeletal Muscle from Individuals with Obesity Human skeletal muscle biopsy samples (vastus lateralis) were analyzed for A) GLO1 protein abundance, B) GLO1 activity, and C) GLO1 transcripts. A representative Western blot for GLO1 and total protein used for normalizing signal quantification of target proteins are displayed in panel D. Protein level of GLO1's transcription factor NRF2 (E), its negative regulator KEAP1 (F), and their ratio (G) were measured via Western blot. A representative Western blot for NRF2, KEAP1, and total protein are displayed in panel H. Data are presented as mean ± SEM with individual data points superimposed. Data were compared via independent student's T Test or Mann-Whitney U test, depending on normality, with significance set to p < 0.05.
Fig. 2
Fig. 2
Effect of SIRT1 Knock Down On GLO1 in Human Immortalized Myotubes Human Immortalized Myotubes transfected with SIRT1 siRNA for 48 h resulting in depletion of SIRT1 protein (A), and transcripts (B). The effect of SIRT1 KD on GLO1 protein abundance was determined via Western blot (C) and ELISA (D). GLO1 specific activity (F) was determined by making GLO1 activity (E) relative to GLO1 abundance in each sample which was determined via ELISA. A representative Western blot for GLO1, SIRT1 and total protein used for normalizing signal quantification of target proteins are displayed in panel G. Data are presented as mean ± SEM with individual data points superimposed. Data were compared via independent student's T Test with significance set to p < 0.05.
Fig. 3
Fig. 3
Effect of SIRT1 Knock Down In Human Immortalized Myotubes on GLO1 Acetylation Lysine-acetylated proteins (AcK) were immunoprecipitated from Human Immortalized Myotubes transfected with SIRT1 siRNA for 48 h and subsequently immunoblotted (IB) for GLO1 (A,C), and P53 (B,D). Signal quantification of acetylated GLO1 (C), and P53 (D) were made relative to the signal of acetylated proteins that were immunoprecipitated to account for any technical variance in the IP procedure. Data are presented as mean ± SEM with individual data points superimposed. Data were compared via independent student's T Test with significance set to p < 0.05.
Fig. 4
Fig. 4
Effect of SIRT2 Knock Down On GLO1 in Human Immortalized Myotubes Human Immortalized Myotubes transfected with SIRT2 siRNA for 48 h resulting in depletion of both isoforms of SIRT2 protein at 43 kDa (A) and 39 kDa (B), and SIRT2 transcripts (C). The effect of SIRT2 KD on GLO1 protein abundance was determined via Western blot (D and E) and ELISA (F). GLO1 specific activity (H) was determined by making GLO1 activity (G) relative to GLO1 abundance in each sample which was determined via ELISA. A representative Western blot for GLO1, SIRT2 and total protein are displayed in panel H. Data are presented as mean ± SEM with individual data points superimposed. Data were compared via independent student's T Test with significance set to p < 0.05.
Fig. 5
Fig. 5
Effect of SIRT2 Knock Down In Human Immortalized Myotubes on GLO1 Acetylation Lysine-acetylated proteins (AcK) were immunoprecipitated from Human Immortalized Myotubes transfected with SIRT2 siRNA for 48 h and subsequently immunoblotted (IB) for GLO1 (A,B), and P53 (A,C). Signal quantification of acetylated GLO1 (B), and P53 (C) were made relative to the signal of acetylated proteins that were immunoprecipitated to account for any technical variance in the IP procedure. Data are presented as mean ± SEM with individual data points superimposed. Data were compared via independent student's T Test with significance set to p < 0.05.
Fig. 6
Fig. 6
Proteomic Assessment of NAMPT Knockdown and NR or NMN Co-Treatment in Human Immortalized Myotubes. Given that NAMPT protein is upstream of both SIRT1 and SIRT2 activity by virtue of their reliance on NAD, we next knocked down NAMPT in human myotubes as confirmed by western blots and quantification by TMT mass spec. A - C). GLO1 was also found to be ∼30 % lower in myotubes treated with NAMPT siRNA which was not rescued by either NR or NMN co-treatment. Globally, PCA plots in E) and hierarchical clustering in F and G) demonstrate a largely ineffectiveness of both NR and NMN to rescue the proteomic changes of NAMPT siRNA treatment. Volcano plots comparing NAMPT siRNA (H), NAMPT siRNA + NR (I), and NAMPT siRNA + NMN (J) to scRNA treated cells also demonstrates similar protein changes in the attempted rescue experiments as the siRNA alone. This is further exemplified in dot plots (K–M) depicting enrichment for similar GO and KEGG pathway terms across all 3 experiments.
Fig. 7
Fig. 7
Effect of NAMPT Knock Down and NR Rescue On GLO1 Protein Expression and Activity in Human Immortalized Myotubes Human Immortalized Myotubes transfected with NAMPT siRNA for 48 h, or siRNA for 48 h with 0.5 mM nicotinamide riboside (NR) treatment for the final 24 h (NAMPT siRNA + 0.5 mM NR). NAMPT siRNA depleted myotubes of NAMPT protein (A), and transcripts (B) which were not rescued by NR. The effects of NAMPT KD and NR rescue on GLO1 protein abundance was determined via Western blot (C) and ELISA (D). GLO1 specific activity (F) was determined by making GLO1 activity (E) relative to GLO1 abundance in each sample which was determined via ELISA. A representative Western blot for GLO1, NAMPT and total protein used for normalizing signal quantification of target proteins are displayed in panel G. Data are presented as mean ± SEM with individual data points superimposed. Data were compared via One-way ANOVA using Bonferroni Post Hoc analysis with significance set to p < 0.05.
Fig. 8
Fig. 8
Effect of NAMPT Knock Down and NR Rescue On GLO1 Transcripts in Human Immortalized Myotubes Human Immortalized Myotubes transfected with NAMPT siRNA for 48 h, or siRNA for 48 h with 0.5 mM nicotinamide riboside (NR) treatment for the final 24 h (NAMPT siRNA + 0.5 mM NR). NRF2 (A), KEAP1 (B), SIRT2 (C,D), and SIRT 1 (F) proteins were unaltered by NAMPT knockdown and NR. Representative western blots for protein targets are provided in panels E and G. GLO1 transcripts were attenuated by NAMPT siRNA and rescued by NR (H). Copies of GLO1's transcription factor NRF2 and its negative regulator KEAP1 were not affected by NAMPT siRNA but NRF2 copies were enhanced by co-treatment with NR (I–J). Data are presented as mean ± SEM with individual data points superimposed. Data were compared via One-way ANOVA using Bonferroni Post Hoc analysis with significance set to p < 0.05.
Fig. 9
Fig. 9
Effect of NAMPT Knock Down and NR Rescue In Human Immortalized Myotubes on GLO1 Acetylation Lysine-acetylated proteins (AcK) were immunoprecipitated from Human Immortalized Myotubes transfected with NAMPT siRNA for 48 h, or siRNA for 48 h with 0.5 mM nicotinamide riboside (NR) treatment for the final 24 h (NAMPT siRNA + 0.5 mM NR) and subsequently immunoblotted (IB) for GLO1 (A,C), and P53 (B,D). Signal quantification of acetylated GLO1 (B), and P53 (C) were made relative to the signal of acetylated proteins that were immunoprecipitated to account for any technical variance in the IP procedure. Data are presented as mean ± SEM with individual data points superimposed. Data were compared one-way ANOVA using Bonferroni Post Hoc analysis with significance set to p < 0.05.
Fig. 10
Fig. 10
Role of SIRT1, SIRT2 and NAMPT on GLO1 in Skeletal Muscle from Individuals with Obesity Human skeletal muscle biopsy (vastus lateralis) samples were analyzed for A) SIRT1, B,C) SIRT2 isoforms, and D) NAMPT protein abundance. Representative western blots for target proteins and total protein used for normalizing signal quantification of target proteins are displayed in panels E and F. GLO1 protein abundance was positively correlated with SIRT1 protein (G) and NAMPT protein (H) but not SIRT2 protein isoforms (I, J). NAMPT (K), SIRT1 (L), and SIRT2 (M) transcripts were assessed via ddPCR. Data are presented as mean ± SEM with individual data points superimposed. Data were compared via independent student's T Test with significance set to p < 0.05.
Fig. 11
Fig. 11
Proteomic Consequences of GLO1 Knock Down in Human Immortalized Myotubes. To explore the proteomic consequences of decreased GLO1 abundance in human immortalized myotubes, we knocked down GLO1 by treating myotubes with GLO1 siRNA which resulted in an approximately 50 % reduction in GLO1 protein as confirmed by Western blotting (B–C) and quantification via TMT mass spec (C). PCA demonstrates the unique clustering of samples in the scRNA and siRNA-treated samples and significantly altered proteins are visually demonstrated in the volcano plot in panel E. F) Hierarchical clustering of a heat map of significantly changed proteins with siRNA identified several unique families of similarly altered proteins within the siRNA-treated group. This is confirmed and visually represented in the dot plot in G) demonstrating that many pathways involving muscle contraction and organization are attenuated in human myotubes with attenuated GLO1 protein, exemplifying the importance of GLO1 in the muscle cell.

References

    1. WHO. 2020. https://www.who.int/news-room/fact-sheets/detail/obesity-and-overweight
    1. DeFronzo R.A., Ferrannini E., Sato Y., Felig P., Wahren J. Synergistic interaction between exercise and insulin on peripheral glucose uptake. J. Clin. Invest. 1981;68:1468–1474. - PMC - PubMed
    1. Miranda E.R., Haus J.M. Glyoxalase I is a novel target for the prevention of metabolic derangement. Pharmacol. Therapeut. 2023;250 - PubMed
    1. Zhao Y., Wang P., Sang S. Dietary genistein inhibits methylglyoxal-induced advanced glycation end product formation in mice fed a high-fat diet. J. Nutr. 2019;149:776–787. - PubMed
    1. Maessen D.E., et al. Delayed intervention with pyridoxamine improves metabolic function and prevents adipose tissue inflammation and insulin resistance in high-fat diet–induced obese mice. Diabetes. 2016;65:956–966. - PubMed

MeSH terms