. 2024 Aug 22;187(17):4690-4712.e30.
doi: 10.1016/j.cell.2024.07.033. Epub 2024 Aug 13.

Schwann cell-secreted PGE2 promotes sensory neuron excitability during development

Affiliations

Schwann cell-secreted PGE2 promotes sensory neuron excitability during development

Husniye Kantarci et al. Cell. .

Abstract

Electrical excitability-the ability to fire and propagate action potentials-is a signature feature of neurons. How neurons become excitable during development and whether excitability is an intrinsic property of neurons remain unclear. Here, we demonstrate that Schwann cells, the most abundant glia in the peripheral nervous system, promote somatosensory neuron excitability during development. We find that Schwann cells secrete prostaglandin E2, which is necessary and sufficient to induce developing somatosensory neurons to express normal levels of genes required for neuronal function, including voltage-gated sodium channels, and to fire action potential trains. Inactivating this signaling pathway in Schwann cells impairs somatosensory neuron maturation, causing multimodal sensory defects that persist into adulthood. Collectively, our studies uncover a neurodevelopmental role for prostaglandin E2 distinct from its established role in inflammation, revealing a cell non-autonomous mechanism by which glia regulate neuronal excitability to enable the development of normal sensory functions.

Keywords: PGE2; Schwann cells; excitability; glial cells; neural development; neuron-glia interactions; prostaglandin; sensory behavior; sensory neuron; voltage-gated sodium channels.


Conflict of interest statement

Declaration of interests J.D.B. is a cofounder and holds equity shares in SiteOne Therapeutics, Inc., a start-up company developing subtype-selective modulators of Na(V)s.

Figures
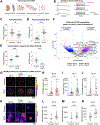
Figure 1.
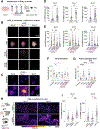
Figure 1.. Schwann cells promote neuronal excitability and NaV expression
(A) Cartoon depicting the DRG neuron immunopanning method (see STAR Methods and Data S1, pages 1 and 2). (B) Representative recordings of untreated and SCCM-treated DRG neurons. Traces show activity over 500 ms with 150 pA of current injection (see also Data S1, page 4 for raster plots summarizing the activity of all analyzed cells). (C-D) DRG neurons treated with SCCM required significantly lower levels of current injections for action potential propagation (C) and fired significantly more action potentials at suprathreshold current injections (D). (E) Transcription inhibitor actinomycin-D (Act-D) blocked the excitability-inducing effect of SCCM. n = 20 total cells from 3 distinct biological replicates. For C-E: gray circles, response of an individual DRG neuron; colored circles, the average response of cells in each biological replicate. Mean ± SEM of all cells is shown; p values compare cells in unpaired t-test. (F) Bulk RNA-seq of cultured DRG neurons treated overnight with SCCM, compared to control cultures. Volcano plot shows differentially expressed genes linked to neurotransmission, including voltage-gated sodium channels NaV1.6, (Scn8a), NaV1.7 (Scn9a), NaV1.8 (Scn10a), and NaV1.9 (Scn11a). Cutoffs (dashed lines) indicate −log10(p value) = 0.05; log2(fold change) = 0.5 (upregulated by SCCM) or −0.5 (downregulated by SCCM). N = 3 controls, 4 SCCM treated samples. See also Data S1, page 2; and Table S1. (G) SCCM treatment enhanced NaV transcription in DRG neurons. Images show RNAscope for indicated genes in single representative DRG neurons that were either untreated (top) or treated with SCCM overnight (bottom). (H to J) Quantification of mRNA spots using FishQuant. Gray circles, mRNA number of an individual DRG neuron for the indicated genes; colored circles, the average # of mRNAs per cell in each biological replicate. n = 6 distinct biological replicates per treatment group. Mean ± SEM is shown for biological replicates. p values compare biological replicates in an unpaired t-test. (K) SCCM treatment increased NaV protein levels in DRG neurons. Images show immunohistochemistry for indicated genes in single representative DRG neurons that were either untreated (top) or treated with SCCM overnight (bottom). (L to N) Quantification of fluorescence levels using Cellpose. Gray circles, fluorescent intensity of an individual DRG neuron for the indicated genes. n = 80 to 328 cells from 1–4 distinct biological replicates per treatment group. Mean ± SEM is shown for cells. p values compare cells in a one-way ANOVA and Tukey test (see STAR Methods Statistical analysis; see also Figure S1B). *p<0.05, **p<0.01, ***p<0.001, ****p<0.0001.
Figure 2.
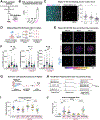
Figure 2.. Identification of PGE2 as the Schwann cell-derived signal promoting neuronal NaV expression and excitability
(A) Cartoon depicting size fractionation and mass spectrometry steps that identified PGE2 as the excitability-inducing molecule in SCCM. (B) PGE2 treatment (1 μM, 16–28 hr) increased NaV expression in DRG neurons, similar to SCCM. n = 6 biological replicates per treatment group. Bottom images: Incubation with PGE2 receptor (EP1-EP4) antagonists or PGE2-neutralizing antibody blocked the SCCM-induced transcriptional increase in NaVs (see also representative images for DMSO-treated DRG neurons in Data S1, page 3E). n = 4–6 distinct biological replicates per treatment group. (C) PGE2 treatment increased NaV protein levels in DRG neurons. Images show immunohistochemistry for indicated genes in single representative DRG neurons that were either untreated (top) or treated with PGE2 overnight (bottom) (see also quantification and NaV1.7 surface staining in Figures S1B–S1F). (D) Quantification of RNAscope results shown in (B), using FishQuant. Control cells were untreated. Mean ± SEM is shown for biological replicates. p values compare biological replicates in an unpaired t-test. (E) Quantification of RNAscope results with SCCM plus/minus EP receptor inhibitors or PGE2-neutralizing antibody as shown in (B), using FishQuant. Control cells were treated with DMSO vehicle. Mean ± SEM is shown for biological replicates. p values compare biological replicates in mixed-effect analysis. (F and G) DRG neurons treated with PGE2 (1 μM, 16–28 hr) but not its constitutional isomer PGD2 fired significantly more action potentials at suprathreshold current injections and exhibited a decrease in the firing threshold, similar to SCCM. Incubation with neutralizing PGE2 antibody or PGE2 receptor (EP1–EP4) antagonists blocked the excitability-inducing effect of SCCM. Mean ± SEM is shown for cells, p values compare cells in a one-way ANOVA and Tukey test. n = 20–29 total cells from 3–7 biological replicates. Untreated and SCCM conditions are replotted from Figs. 1C and 1D, as these experiments were done concurrently. See also Data S1, page 4. (H-I) Injection of dmPGE2 into the P0 sciatic nerve increased NaV1.7 and NaV1.8 transcript levels in lumbar DRG neurons compared to controls. Results were quantified using FishQuant (I). Gray circles, NaV mRNA count in a single DRG neuron; colored circles, the average of cells in each biological replicate. Mean ± SEM is shown for biological replicates. p values compare biological replicates in cells in a one-way ANOVA and Tukey test. n = 3 mice per treatment group (at least 45 DRG neurons per mouse). *p<0.05, **p<0.01, ***p<0.001, ****p<0.0001.
Figure 3.
Figure 3.. Ptges3 is essential for Schwann cells to produce PGE2 and promote neuronal excitability
(A) Diagram summarizing the PGE2 synthesis pathway. (B) RNA-seq of Schwann cells purified from mature rat sciatic nerves showed expression of Ptges3. n = 2 biological replicates, each replicate representing >10 pooled sciatic nerves. (C) RNAscope confirming Ptges3 expression in Schwann cells in the mouse sciatic nerve across development. Micrographs show adult sciatic nerve stained for Myelin Basic Protein (MBP, cyan in merge) to show myelinated nerve fibers, DAPI (nuclei, grey in merge), and RNAscope for Ptges3 (magenta in merge and single channel displayed to right). Right, quantification of Ptges3 mRNA number (using FishQuant) from E16 until P28. n = 3–5 mice per time point. *p<0.05 (see also Figure S4). (D) Diagram summarizing the generation of Ptges3 knockout rat Schwann cell colonies. (E) SCCM from Ptges3-KO colonies failed to enhance DRG neuron NaV transcript levels. See also quantification of neuronal nuclei size in Data S1, page 8E. (F) Results were quantified using FishQuant. Gray circles, mRNA number of an individual DRG neuron for the indicated genes; colored circles, the average # of mRNAs per cell in each biological replicate. Mean ± SEM is shown for biological replicates, compared in a one-way ANOVA and Tukey test. n = 4–6 distinct biological replicates per group. (G to J) Mouse Schwann cells were acutely isolated from Ptges3 conditional knockout mice (Ptges3-cKO: Ptges3fl/fl;DhhCRE) or littermates (Ptges3-flox: Ptges3fl/fl and Ptges3-cHet: Ptges3fl/+;DhhCRE/+). All SCCM was filtered through a 5 kDa filter before adding to DRG neurons. Representative traces (H) indicate activity over 500 ms with 150 pA of current injection. Adding PGE2 to cKO SCCM rescued the loss of excitability-inducing effect in cKO SCCM (see also Data S1, pages 9–10). Mean ± SEM is shown for cells, compared in a one-way ANOVA and Tukey test. n = 20–25 total cells from 3–4 distinct biological replicates per group. *p<0.05, **p<0.01, ***p<0.001, ****p<0.0001.
Figure 4.
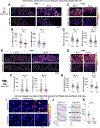
Figure 4.. Schwann cell-secreted PGE2 promotes NaV expression and DRG neuron excitability in vivo
(A to H) RNAscope and immunostaining of Nav expression in vivo in Ptges3-Flox or Ptges3-cKO mice. Left panels: RNAscope of NaV1.7 and NaV1.8 transcripts in lumbar DRG neurons at P0 (A) and P28 (E). Number of NaV1.7 and NaV1.8 mRNAs per cell quantified using FishQuant from P0 (B) and P28 (F). n = 4–9 mice per group. Right panels: immunohistochemistry for NaV1.7 and NaV1.8 in lumbar DRG neurons at P0 (C) and P28 (G). Cellular fluorescence was quantified using Cellpose. Gray circles, mRNA count or fluorescence intensity in individual DRG neurons; pink circles, the average of cells per mouse. n = 2–5 mice per group. Mean ± SEM is shown for biological replicates (mice). p values compare biological replicates in Mann-Whitney test (B, D and F) or an unpaired t-test (H). See also Data S1, pages 11–14. (I to K) Calcium imaging of acutely purified DRG neurons from Ptges3-Flox or Ptges3-cKO mice. Images show fluorescence intensity of calcium indicator (Fluo-4,AM) in DRG neurons acutely isolated (within 2 hours of purification) from Ptges3-Flox (top) or Ptges3-cKO (bottom) mice at baseline, during the addition of VTD and 20 seconds (s) after VTD addition (I). Representative neuron traces (J) and the maximum difference between the florescence after stimulation and during baseline (max delta F/F) (panel K) are shown. n = 3 distinct biological replicates (mice) per group, 8–26 cells per mouse. Mean ± SEM is shown for biological replicates (mice). p values compare biological replicates in an unpaired t-test. *p<0.05, **p<0.01, ***p<0.001, ****p<0.0001.
Figure 5.
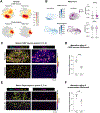
Figure 5.. scRNA-seq analysis of DRG neurons in Ptges3-Flox versus Ptges3-cKO mice
(A) Top: schematic showing scRNA-seq workflow. Bottom: comparison of first and second scRNA-seq experiments. (B and C) UMAP visualization of DRG scRNA-seq data in Ptges3-Flox (B) and Ptges3-cKO (C) mice at P4 in second scRNA-seq experiment (see also Data S1, page 16 for first scRNA-seq experiment). (D) Volcano plot shows differentially expressed genes linked to neurotransmission, including voltage-gated sodium channels NaV1.7 (Scn9a), NaV1.8 (Scn10a), and NaV1.9 (Scn11a) in all neurons from Ptges3-cKO mice. Cutoffs (dashed lines) indicate −log10(p value) = 0.05; log2(fold change) = 0.1 (upregulated in Ptges3-cKO) or −0.1 (downregulated in Ptges3 cKO). See also Table S2. (E) Overlap between genes upregulated in cultured DRG neurons treated with SCCM (E) or PGE2 (F) (p-value<0.05 and log2(FC)> 0.5) and genes downregulated in Ptges3-cKO neurons (p-value<0.01 and log2(FC)<−0.1), computed using GeneOverlap. Fisher’s exact test was used to calculate the overlapping p-value for each comparison. (F) Violin plots indicate expression of cfos, NaV 1.7, and NaV1.8 in identified DRG subtypes from the second scRNA-seq dataset. p values compare cells in an unpaired t-test. *p<0.05, **p<0.01, ***p<0.001, ****p<0.0001. (G) Overlap between genes upregulated by PGE2 in culture and downregulated in Ptges3-cKO mice, for each DRG neuron subtype, using GeneOverlap (p-value<0.05 and log2(FC)> 0.5) and downregulated gene lists from DRG neuron subtypes in Ptges3-cKO neurons (p-value<0.01 and log2(FC)<−0.2). Fisher’s exact test was used to calculate the overlapping p-value for each comparison.
Figure 6.
Figure 6.. Schwann cell-secreted PGE2 most strongly promotes the development and function of pain-sensing and proprioceptive DRG neuron subtypes
(A) Cell identity composition heatmaps of CGRP and proprioceptor DRG neuron subtype populations. Dark red indicates high relative cell density. (B) Diffusion pseudotime (DPT) analysis to compare the temporal order of cells during differentiation between Ptges3-cKO and Ptges3-Flox neurons. Developmental progression of each cell was determined by its computed DPT with respect to a randomly selected root cell in the Ptges3-cKO dataset. Violin plots compare computed DPTs of CGRP neurons and proprioceptors between Ptges3-Flox and Ptges3-cKO animals in an unpaired t-test. ***p<0.001, ****p<0.0001. (C to F) RNAscope shows expression of Neun, Pvalb, or Calca, and NaV1.8 transcripts in lumbar DRG neurons at P4 to label proprioceptor or CGRP neurons, respectively. Pvalb+ or Calca+ neuron numbers are normalized to Neun+ cells to calculate the percentage of proprioceptor or CGRP DRG neurons respectively. n = 3–5 mice, p values compare biological replicates in an unpaired t-test.
Figure 7.
Figure 7.. Schwann cell-secreted PGE2 is required for normal nerve excitability and sensory function
(A) C fiber compound action potentials in 6–8-month-old Ptges3-Flox and Ptges3-cKO sciatic nerve in response to indicated stimulus applications. (B) Threshold stimulus voltage of C fibers is decreased in Ptges3-cKO sciatic nerve, consistent with reduced excitability. y axis is plotted in log2 scale. (C and D) Peak amplitude and the latency of the largest CAP did not reveal significant changes between Ptges3-cKO and Ptges3-Flox animals. n=10 sciatic nerves from 5–7 male mice for each group. p values compare sciatic nerves in Mann-Whitney test. (E and F) Hot plate and Hargreaves tests indicate that paw withdrawal latencies in response to noxious heat was significantly lengthened in Ptges3-cKO mice. n = 14, 20 mice (hot plate); 32, 17 mice (Hargreaves). Control littermates in (F) were either Ptges3fl/fl or Ptges3fl/+ mice. (G) Pain response following 1% PFA injection into the hind paw indicated the typical biphasic response. The first phase (acute pain) was unaffected, but the second phase (inflammatory pain) was reduced by ~40% in Ptges3-cKO mice. n = 9–11 mice (see also Data S1, page 20H and 20I). (H) Rotarod assay (32 RPM, constant speed) indicates decreased fall latency in Ptges3-cKO mice. n = 18, 17 mice. (I) Precise foot placement is severely impacted in Ptges3-cKO mice recorded in the horizontal ladder test with unevenly placed rungs. n = 16 mice for each group. p values compare biological replicates (triangles-females, circles-males) in an unpaired t-test. *p<0.05, **p<0.01, ***p<0.001, ****p<0.0001. (J) Model. During sensory neuron development, DRG neurons coalescence into ganglia at around E11 and remain inactive until E16. Schwann cell precursors arrive in the ganglia at around E12 and begin to differentiate into myelinating and nonmyelinating (Remak) Schwann cells. Our model proposes that Schwann cell precursors and mature Schwann cells secrete PGE2 to initiate excitability and electrical activity in DRG neurons, allowing them to mature.

References

    1. Devinsky O, Vezzani A, Najjar S, De Lanerolle NC, and Rogawski MA (2013). Glia and epilepsy: excitability and inflammation. Trends Neurosci 36, 174–184. 10.1016/j.tins.2012.11.008. - DOI - PubMed
    1. Busche MA, and Konnerth A (2015). Neuronal hyperactivity--A key defect in Alzheimer’s disease? Bioessays 37, 624–632. 10.1002/bies.201500004. - DOI - PubMed
    1. Staley K (2015). Molecular mechanisms of epilepsy. Nat Neurosci 18, 367–372. 10.1038/nn.3947. - DOI - PMC - PubMed
    1. Mertens J, Wang QW, Kim Y, Yu DX, Pham S, Yang B, Zheng Y, Diffenderfer KE, Zhang J, Soltani S, et al. (2015). Differential responses to lithium in hyperexcitable neurons from patients with bipolar disorder. Nature 527, 95–99. 10.1038/nature15526. - DOI - PMC - PubMed
    1. Geevasinga N, Menon P, Ozdinler PH, Kiernan MC, and Vucic S (2016). Pathophysiological and diagnostic implications of cortical dysfunction in ALS. Nat Rev Neurol 12, 651–661. 10.1038/nrneurol.2016.140. - DOI - PubMed