. 2024 Dec;24(12):2174-2186.
doi: 10.1016/j.ajt.2024.08.005. Epub 2024 Aug 12.

Deficiency in the mitophagy mediator Parkin accelerates murine skin allograft rejection

Affiliations

Deficiency in the mitophagy mediator Parkin accelerates murine skin allograft rejection

Kathleen M Wragg et al. Am J Transplant. 2024 Dec.

Abstract

Alterations in mitochondrial function and associated quality control programs, including mitochondrial-specific autophagy, termed mitophagy, are gaining increasing recognition in the context of disease. However, the role of mitophagy in organ transplant rejection remains poorly understood. Using mice deficient in Parkin, a ubiquitin ligase that tags damaged or dysfunctional mitochondria for autophagic clearance, we assessed the impact of Parkin-dependent mitophagy on skin-graft rejection. We observed accelerated graft loss in Parkin-deficient mice across multiple skin graft models. Immune cell distributions posttransplant were largely unperturbed compared to wild-type; however, the CD8+ T cells of Parkin-deficient mice expressed more T-bet, IFNγ, and Ki67, indicating greater priming toward effector function. This was accompanied by increased circulating levels of IL-12p70 in Parkin-deficient mice. Using a mixed leukocyte reaction, we demonstrated that naïve Parkin-deficient CD4+ and CD8+ T cells exhibit enhanced activation marker expression and proliferative responses to alloantigen, which were attenuated with administration of a pharmacological mitophagy inducer (p62-mediated mitophagy inducer), known to increase mitophagy in the absence of a functional PINK1-Parkin pathway. These findings indicate a role for Parkin-dependent mitophagy in curtailing skin-graft rejection.

Keywords: Parkin; T cells; mitochondria; mitophagy; transplant.


Conflict of interest statement

Declaration of competing interest The authors of this manuscript have no conflicts of interest to disclose as described by the American Journal of Transplantation.

Figures

Figure 1:
Figure 1:
Skin allografts are rejected more rapidly in PKO than WT recipients. (A) Schematic of experimental design. PKO (n=12) or WT (n=11) recipient mice received tail skin allografts from BALB/cJ donor mice. Recipient mice were administered CSB with CTLA-4Ig (250ug) and anti-CD40L (250ug) I.P. at days 2, 4, 6 and 8 post-transplantation. (B) Skin grafts were monitored daily for signs of rejection and scored based on the total area of the graft necrotic. (C) The day post-transplantation which grafts achieved a necrotic score of 1 or greater and (D) the necrotic score over time was assessed in graft recipients. (E) Grafts were considered rejected when at least 80% of the total graft area appeared necrotic (necrotic score=5). (F) Representative images of graft appearance in WT and PKO recipient mice post-transplantation. Images are not to scale. Significance of graft survival was assessed using the log-rank test, time to necrosis by Mann-Whitney U-test and necrotic score over-time using a 2-way ANOVA with repeated measures, with p-value reported for the comparison between strains over time (row × column factor). P<0.05 was considered statistically significant. Error bars represent standard error of the mean (SEM). Schematic in panel A created with BioRender.com
Figure 2:
Figure 2:
Immune cellular distribution is similar between PKO and WT mice post-transplantation. WT (n=9) and PKO (n=8) mice received BALB/cJ tail skin grafts with CTLA-4Ig and anti-CD40L CSB. At day 13 post-transplantation, cell counts and frequency were assessed by flow cytometry in the spleen (A), blood (B) and skin-draining LN (C). Statistics assessed by Mann-Whitney U test and corrected for multiple comparisons with the Holm-Sidak method. P<0.05 was considered statistically significant. Error bars represent SEM.
Figure 3:
Figure 3:
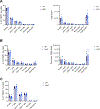
Analysis of peripheral cytokines in WT and PKO naïve and allogeneic skin graft recipients. Plasma was obtained from naïve WT (n=6) or PKO (n=6), and WT (n=14) or PKO (n=13) mice which received BALB/cJ tail skin grafts with CTLA-4Ig and anti-CD40L CSB at day 13 post-transplantation. Inflammatory cytokines were quantified by flow-cytometry based multiplex immunoassay. Statistics assessed by Mann-Whitney U test. P<0.05 was considered statistically significant. Error bars represent SEM.
Figure 4:
Figure 4:
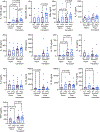
PKO CD8+ T cells have altered effector phenotype following allograft transplantation. On day 13 post-transplantation, single cell suspensions were prepared from the spleens of PKO or WT mice which received BALB/cJ skin allografts and CSB with CTLA-4Ig and anti-CD40L. (A) CD4+ T cells were intracellularly stained the expression of T-bet, RORγT and FoxP3/CD25. (B) CD8+ T cells were characterized for the expression of T-bet by intracellular staining. The frequency of IFNγ, TNFα, IL-2 and IL-17A producing cells amongst the bulk CD4+ (C) and CD8+ (D) populations were analyzed in response to PMA/Io stimulation for 6 hours. Additional analysis of the cytokine producing frequencies amongst CD44hi CD4+ (E) and CD44hi CD8+ (F) populations, as well as the dual IFNγ+TNFα+producing CD8+populations (G). CD4+ and CD8+ T cells were also assessed for Ki67 expression ex vivo. Representative staining for Ki67 expression on bulk CD4+ and CD8+ T cell populations (I). (J) Summary of Ki67 expression data assessed by Mean Fluorescence Intensity (MFI) and frequency amongst indicated T cell populations in WT (n=14) and PKO (n=13) mice. (K) Ki67 MFI and frequency assessment amongst CD44hiCD4+ and CD44hiCD8+ populations. Significance was assessed by Mann-Whitney U test, with p<0.05 considered significant. Error bars represent SEM.
Figure 5:
Figure 5:
Alloantigen stimulates greater CD4 and CD8 T cell activation and proliferative responses in Parkin KO mice. Splenocytes from naïve Parkin KO and WT mice were stimulated with irradiated BALB/cJ or C57BL/6 (B6) BMDC for 72 hours. (A) CD4 T cell proliferation was assessed via CTV dye dilution. (B) Representative CTV histograms for BALB/cJ BMDC stimulated CD4 T cells. BMDC stimulated histograms are overlayed in red. (C) Quantification of AIM expression on CD4 T cells. (D) Representative flow cytometry plots of AIM expression on CD4 T cells stimulated with BALB/cJ BMDC. B6 stimulated flow cytometry plots are overlayed in grey. (E) CD8 T cell proliferation was assessed via CTV dye dilution. (F) Representative histograms of CD8 T cell proliferation in response to BALB/cJ BMDC stimulation, overlayed with B6 BMDC stimulated control histograms (red). (G) Quantification of AIM expression on BALB/cJ and B6 BMDC stimulated CD8 T cells and (H) representative flow cytometry plots of BALB/cJ stimulated CD8 T cells with B6 stimulated flow cytometry plots overlayed in grey. Quantification of activation marker expression in alloantigen stimulated CD4 (I) and CD8 T cells (J). Error bars represent SEM, n=6 per group. Significance was assessed by Mann-Whitney U test. P<0.05 considered significant.
Figure 6:
Figure 6:
Mitophagy induction attenuates T cell proliferation and activation in vitro. PKO and WT splenocytes were treated with 10μM PMI or vehicle control and stimulated with BALB/cJ BMDC for 72 hours. (A) Proliferation was assessed via CTV dye dilution as depicted in representative histograms (B) for PKO vehicle and PMI treated samples. (C) AIM expression was quantified for CD4+ T cells. (D) Representative flow cytometry plots for AIM expression in PKO vehicle and PMI treated CD4+ T cells. (E) Quantification of proliferation via CTV dye dilution on WT and PKO CD8+ T cells. (F) Representative histograms for PKO CD8+ T cell proliferation in vehicle and PMI treated samples. (G) AIM expression was assessed with PMI treatment in PKO and WT CD8+ T cells. (H) Representative flow cytometry plots for PMI and vehicle treated PKO CD8+ T cells. Data shown is representative of two-independent experiments; error bars signify SEM. Statistics assessed by Mann-Whitney U test. P<0.05 considered significant.

Similar articles

References

    1. Short S, Lewik G, Issa F. An Immune Atlas of T Cells in Transplant Rejection: Pathways and Therapeutic Opportunities. Transplantation. Nov 1 2023;107(11):2341–2352. doi:10.1097/TP.0000000000004572 - DOI - PMC - PubMed
    1. Rosenberg AS, Mizuochi T, Sharrow SO, Singer A. Phenotype, specificity, and function of T cell subsets and T cell interactions involved in skin allograft rejection. J Exp Med. May 1 1987;165(5):1296–315. doi:10.1084/jem.165.5.1296 - DOI - PMC - PubMed
    1. Rosenberg AS, Singer A. Evidence that the effector mechanism of skin allograft rejection is antigen-specific. Proc Natl Acad Sci U S A. Oct 1988;85(20):7739–42. doi:10.1073/pnas.85.20.7739 - DOI - PMC - PubMed
    1. Hall BM, Dorsch S, Roser B. The cellular basis of allograft rejection in vivo. I. The cellular requirements for first-set rejection of heart grafts. J Exp Med. Oct 1 1978;148(4):878–89. doi:10.1084/jem.148.4.878 - DOI - PMC - PubMed
    1. Hall BM, Gurley KE, Dorsch SE. The possible role of cytotoxic T cells in the mediation of first-set allograft rejection. Transplantation. Sep 1985;40(3):336–9. - PubMed

MeSH terms

LinkOut - more resources