. 2024 Dec;17(6):1199-1211.
doi: 10.1016/j.mucimm.2024.08.003. Epub 2024 Aug 13.

Microbiota-derived butyrate inhibits cDC development via HDAC inhibition, diminishing their ability to prime T cells

Affiliations

Microbiota-derived butyrate inhibits cDC development via HDAC inhibition, diminishing their ability to prime T cells

Anna Andrusaite et al. Mucosal Immunol. 2024 Dec.

Abstract

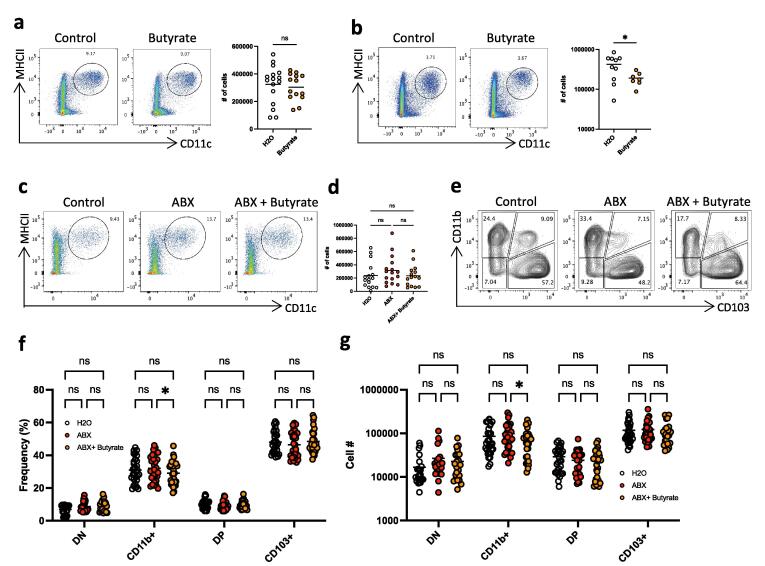
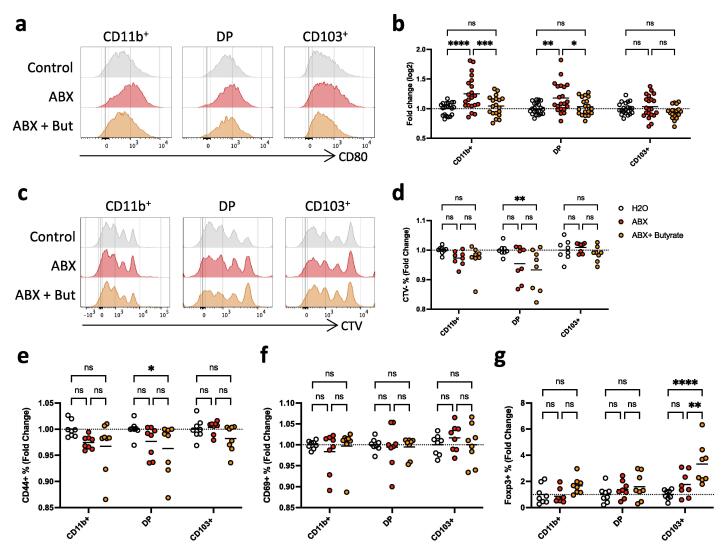
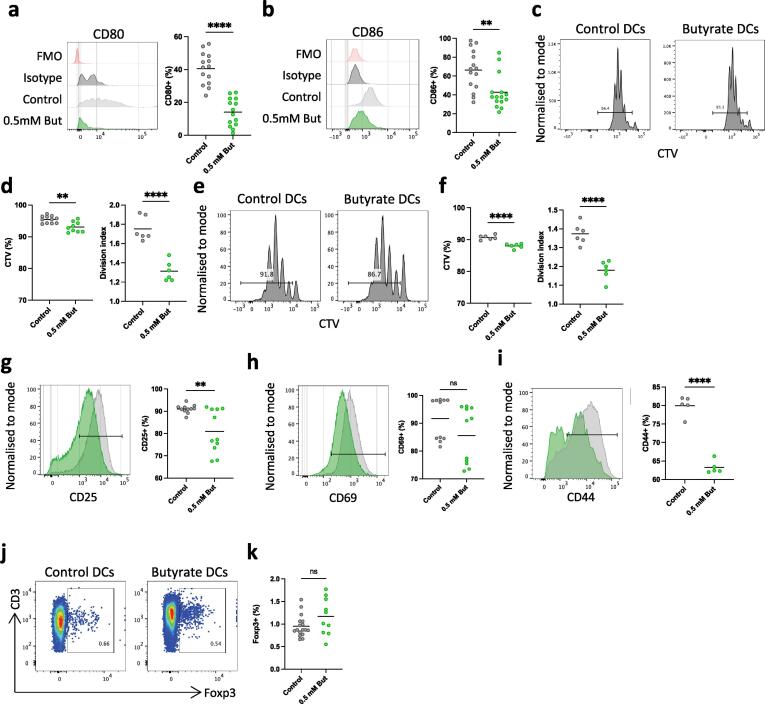
Conventional dendritic cells (cDC) are central to maintaining the balance between protective immune responses and tolerance to harmless antigens, especially in the intestine. Short chain fatty acids (SCFAs) such as butyrate play critical roles in regulating intestinal immunity, but the underlying mechanisms remain unclear. Here we demonstrate that microbiota-derived butyrate alters intestinal cDC populations in vivo resulting in decreased numbers of the cDC2 lineage. By establishing a novel in vitro culture model, we show that butyrate has a direct and selective ability to repress the development of cDC2 from cDC precursors, an effect that is independent of G-protein coupled receptors (GPCRs) and is due to inhibition of histone deacetylase 3. Finally, cDC derived from pre-cDC in the presence of butyrate in vitro express lower levels of costimulatory molecules and have a decreased ability to prime naïve T cells. Together, our data show that butyrate affects the developmental trajectory of cDC, selectively repressing the cDC2 lineage and reducing their ability to stimulate T cells. These properties may help explain the ability of butyrate to maintain homeostasis in the intestine.


Conflict of interest statement

Declaration of competing interest The authors declare that they have no known competing financial interests or personal relationships that could have appeared to influence the work reported in this paper.

Figures

None
Graphical abstract
Fig. 1
Fig. 1
Relationship between intestinal dendritic cell populations and abundance of SCFAs in vivo. A) Representative FACS plots (left panels) and numbers (right panel) of colonic and B) small intestinal LP cDC in control mice or in mice supplemented with 200 mM butyrate via the drinking water. cDC were identified as live, single, CD45+, CD3-, B220-, CD64-, MHCII+and CD11c + . Data shown are pooled from 2 to 4 independent experiments (n = 3–4 each) C) Representative FACS plots and D) numbers of colonic LP cDC in control mice, in mice treated with antibiotic cocktail (ABX) and in mice treated with antibiotics and supplemented with 200 mM butyrate (ABX+Butyrate). The data shown are pooled from 4 independent experiments (n = 3–5 each) E) Representative FACS plots of colonic LP cDC subsets based on their CD11b and CD103 expression in control mice, in mice treated with antibiotic cocktail (ABX) and in mice treated with antibiotics and supplemented with 200 mM butyrate (ABX+Butyrate). F) Frequencies amongst total cDC and G) absolute numbers of colonic LP cDC subsets in control mice, in mice treated with antibiotic cocktail (ABX) and in mice treated with antibiotics and supplemented with 200 mM butyrate (ABX+Butyrate). Cells pre-gated on live, single, CD45+, B220-, CD3-, CD64-, CD11c+, MHC+ cells. DN=CD11b-CD103- double negative, single CD11b+ = CD11b+CD103-, DP=CD11b+CD103+ double positive and single CD11b-CD103+ (CD103+). The data shown are from 7 independent experiments (n = 3–5 each). *p < 0.05, as assessed by Student’s t-test (A, B), one-way ANOVA (D) or two-way ANOVA with Šídák’s post-test correction for multiple comparisons (F, G). ns = not significant.
Fig. 2
Fig. 2
Effects of butyrate on antigen presenting activity of colonic cDC in vivo. A) Histograms showing CD80 expression level on cDC susbets in control mice, in mice treated with antibiotic cocktail (ABX) and in mice treated with antibiotics and supplemented with 200 mM butyrate (ABX+Butyrate). B) CD80 expression quantified as fold change of MFI (Mean Fluorescent Intensity) calculated based on control group. cDC were identified as live, single, CD45+, CD3-, B220-, CD64-, MHCII+and CD11c + . Single CD11b+ = CD11b+CD103-, DP=CD11b+CD103+ double positive and single CD11b-CD103+ (CD103+). C) Histograms showing levels of cell trace violet (CTV) expression by naïve OTII CD4+ T cells cultured at a 10:1 ratio for 3 days with OVA-pulsed cDC isolated from colonic LP of control mice, or of mice treated with antibiotic cocktail (ABX) or of mice treated with antibiotics and supplemented with 200 mM butyrate (ABX+Butyrate) D) Fold change of proportions of CTV- of OT-II CD4+ T cells after 3 days of co-culture with OVA-pulsed colonic cDC populations calculated base don control group. E-G) Fold change of proportions of naïve OTII CD4+ T cells expressing CD44 (E), CD69 (F) and Foxp3 (G) after 3 days of co-culture with OVA-pulsed colonic cDC populations calculated base don control group. Cells pre-gated on live, single, CD45+, B220-, CD3-, CD64-, CD11c+, MHC+ cells(A-B). All T cells pre-gated on live, single, CD3+, CD4+ cells (C-G). Data shown are pooled from 3 independent experiments with n = 3–5 (A, B) or are pooled from 2 independent experiments with n = 4–5 (C-G). *p < 0.05, **p < 0.01, ***p < 0.001,****p < 0.0001 as assessed by two-way ANOVA with Šídák’s post-test correction for multiple comparisons. ns = not significant.
Fig. 3
Fig. 3
Effects of butyrate on cDC development in vitro. A) Histograms and B) contour plots (B) illustrating IRF8 and IRF4 expression by cells generated from BM derived pre-cDC cultured for 4 days in complete medium containing 400 ng/mL Flt3L and 20 ng/mL GM-CSF (control) or with 400 ng/mL Flt3L and 20 ng/mL GM-CSF supplemented with 0.5 mM butyrate, together with isotype and FMO controls. C) Proportions and D) numbers of IRF4 and IRF8 expressing subsets in control and butyrate treated cultures. Heatmap dot plots (upper panels) and proportional expression (lower panels) of E) CD11b, F) SIRPa, G) CD103 and H) CLEC9A within IRF4 and IRF8 defined subsets in control and butyrate treated cultures. All samples pre-gated on live, single, CD45+, CD11c+, MHC+ cells. Data shown are pooled from 5 independent experiments with n = 4–6 each (C, D), or from 3 to 4 independent experiments with n = 3–5 each (E-G). Each data point represents one technical replicate with bars representing the means. *p < 0.05, **p < 0.01, ****p < 0.0001 as assessed by two-way ANOVA with Šídák’s post-test correction for multiple comparisons. ns = not significant.
Fig. 4
Fig. 4
Effects of butyrate on the proliferation of in vitro generated cDC. A) Histogram illustrating Ki67 expression by cells generated from BM derived pre-cDC cultured for 4 days in complete medium containing 400 ng/mL Flt3L and 20 ng/mL GM-CSF (control) or with 400 ng/mL Flt3L and 20 ng/mL GM-CSF supplemented with 0.5 mM butyrate, together with isotype control. B) Proportions and C) numbers of Ki67+ cells in the presence or absence of butyrate. D) Heatmap dot plot showing Ki67 expression within IRF4 and IRF8 defined subsets. E) Proportions and F) numbers of Ki67+ cells amongst IRF4 and IRF8 defined subsets. G) Histogram illustrating phosphorylated ribosomal protein S6 (pS6) staining and H), mean fluorescence intensity (MFI) of pS6 staining in the presence or absence of butyrate. I) Histogram illustrating pS6 staining in cDC1-like (CD103hi) and cDC2-like (CD11b+/h) cells and J) mean fluorescence intensity (MFI) of pS6 staining in the presence or absence of butyrate. All samples pre-gated on live, single, CD45+, CD11c+, MHC+ cells. Data shown are pooled from 4 independent experiments with n = 4–5 each (A-F) or from 2 independent experiments with n = 3–4 each (G-J)). Each data point represents one technical replicate with bars representing the means. ***p < 0.001, ****p < 0.0001 as assessed by Student’s t-test (B, C, H) or two-way ANOVA with Šídák’s post-test correction for multiple comparisons(E, F,J). ns = not significant.
Fig. 5
Fig. 5
Role of GPCR in development of cDC in vivo and in vitro. A) Representative FACS plots of colonic LP cDC subsets based on CD11b and CD103 expression in GPR43-/- mice and WT littermates. B) Frequency amongst total cDC and C) numbers of colonic LP cDC subsets. DN=CD11b-CD103- double negative, single CD11b+ = CD11b+CD103-, DP=CD11b+CD103+ double positive and single CD11b-CD103+ (CD103+). D) Contour plots and E), proportions of IRF4 and IRF8 expressing subsets of in vitro generated cDC from GPR43-/- or WT littermates in control and butyrate treated cultures. F) Contour plots, G) proportions and H) absolute numbers of IRF4 and IRF8 expressing subsets of cDC generated in Flt3L and GM-CSF alone (control) or with the addition of 0.5 mM butyrate in the presence or absence of the pan-GPCR inhibitor YM254890 (1 nM,10 nM). Ex-vivo cells pre-gated on live, single, CD45+, B220-, CD3-, CD64-, CD11c+, MHC+ cells.(A-C). All in vitro samples pre-gated on live, single, CD45+, CD11c+, MHC+ cells (D-H). Data shown are pooled from 2 independent experiments with n = 2–4 each (A-C), from one experiment with n = 3 (D) or are pooled from 2 independent experiments with n = 4–6 (E-H). Each data point represents one mouse (A-C) or an individual technical replicate (D-H) with bars representing the means. *p < 0.05, **p < 0.01, ***p < 0.001, ****p < 0.0001 as assessed by two-way ANOVA with Šídák’s post-test correction for multiple comparisons. ns = not significant.
Fig. 6
Fig. 6
Role of HDAC inhibition in effects of butyrate on cDC development in vitro. A) Histogram illustrating expression of H3K27ac by cDC generated in Flt3L and GM-CSF alone (control) or with the addition of 0.5 mM butyrate, together with isotype control. B) Dot plot overlay of H3K27ac-/lo and H3K27ac+/hi cells within subsets defined by IRF4 and IRF8 C) Proportions and D) mean fluorescence intensity (MFI) of H3K27ac+ cells within subsets defined by IRF4 and IRF8. E) Histogram illustrating expression of H3K27me3 by cDC generated in Flt3L and GM-CSF alone (control) or with the addition of 0.5 mM butyrate, together with isotype control. F) Dot plot overlay of H3K27me3-/lo and H3K27me3+/hi cells within subsets defined by IRF4 and IRF8 G) Proportions and H) mean fluorescence intensity (MFI) of H3K27me3+ cells within subsets defined by IRF4 and IRF8. I) Contour plots, J) proportions and K) absolute numbers of IRF4 and IRF8 expressing subsets of cDC generated in Flt3L and GM-CSF alone (control) or with the addition of 0.5 mM butyrate, or with 1 µM of the HDAC3 agonist RGF966. L) Proportions of in vitro generated cDC expressing CD11b, SIRPa, CD103 or CLEC9A in control cultures or after addition of butyrate or RGF966. M) Proportions of in vitro generated cDC expressing Ki67 in control cultures or after addition of butyrate or RGF966. N) Overlay dot plots showing Ki67 expression by IRF4 and IRF8 defined subsets of cDC generated in control cultures or after addition of butyrate or RGF966. O) Proportions and P) numbers of Ki67+ cells in IRF4 and IRF8 defined subsets. All in vitro samples pre-gated on live, single, CD45+, CD11c+, MHC+ cells. Data shown are pooled from 2 independent experiments with n = 3–4 each. Each data point represents one technical replicate with bars representing the means. *p < 0.05, **p < 0.01, ***p < 0.001, ****p < 0.0001 as assessed by Student’s t-test (M) or a two-way ANOVA with Šídák’s post-test correction for multiple comparisons (C, D, G, H, J, K L, O, P). ns = not significant.
Fig. 7
Fig. 7
Effects of butyrate on antigen presenting activity of in vitro generated cDCs. A) Histogram showing CD80 expression by cells generated from BM derived pre-cDC cultured for 4 days in complete medium containing 400 ng/mL Flt3L and 20 ng/mL GM-CSF (control) or with 400 ng/mL Flt3L and 20 ng/mL GM-CSF supplemented with 0.5 mM butyrate, together with isotype and FMO controls (left panel) and proportions of cells expressing CD80 (right panel). A) Histogram showing CD86 expression by cells generated from BM derived pre-cDC cultured for 4 days in complete medium containing 400 ng/mL Flt3L and 20 ng/mL GM-CSF (control) or with 400 ng/mL Flt3L and 20 ng/mL GM-CSF supplemented with 0.5 mM butyrate, together with isotype and FMO controls (left panel) and proportions of cells expressing CD80 (right panel). C) Histograms showing levels of cell trace violet (CTV) expression by naïve OTI CD8+ T cells cultured at a 10:1 ratio for 3 days with OVA-pulsed cDC generated in control cultures in vitro or in the presence of butyrate. D) Proportions of CTV- (left panel) and division index (right panel) of OT-I CD8+ T cells after 3 days of co-culture with OVA-pulsed control or butyrate treated cDC. E) Histograms showing levels of cell trace violet (CTV) expression by naïve OTII CD4+ T cells cultured at a 10:1 ratio for 3 days with OVA-pulsed cDC generated in control cultures in vitro or in the presence of butyrate. F) Proportions of CTV- (left panel) and division index (right panel) of OT-II CD4+ T cells after 3 days of co-culture with OVA-pulsed control or butyrate treated cDC. G-I) Representative histograms (left panels) and proportions (right panels) naïve OTII CD4+ T cells expressing CD25 (E), CD69 (F) and CD44 (G) after 3 days of co-culture with OVA-pulsed control or butyrate treated cDC. J) Representative dot plots showing Foxp3 expression and K), proportions of OTII CD4+ T cells expressing FoxP3. All in vitro samples pre-gated on live, single, CD45+, CD11c+, MHC+ cells (A,B). All T cells pre-gated on All in vitro samples pre-gated on live, single, CD3+, CD4+ cells. Data shown are pooled from 4 independent experiments with n = 3–5 (A, B), or are representative of 2 independent experiment with n = 6 (C, D), or are pooled from 2 independent experiments with n = 5–12 (E-I). Each data point represents one technical replicate with bars representing the means. Data *p < 0.05, **p < 0.01, ****p < 0.0001 as assessed by Student’s t-test (A,B D, I, J) or two-way ANOVA with Šídák’s post-test correction for multiple comparisons (F,G). ns = not significant.

References

    1. Ginhoux F., et al. The origin and development of nonlymphoid tissue CD103+ DCs. J Exp Med. 2009;206:3115–3130. - PMC - PubMed
    1. Kamath A.T., Henri S., Battye F., Tough D.F., Shortman K. Developmental kinetics and lifespan of dendritic cells in mouse lymphoid organs. Blood. 2002;100:1734–1741. - PubMed
    1. Scott N.A., et al. Antibiotics induce sustained dysregulation of intestinal T cell immunity by perturbing macrophage homeostasis. Sci. Transl. Med. 2018;10:eaao4755. - PMC - PubMed
    1. Ji J., et al. Microbial metabolite butyrate facilitates M2 macrophage polarization and function. Sci Rep. 2016;6:24838. - PMC - PubMed
    1. Schulthess J., et al. The Short Chain Fatty Acid Butyrate Imprints an Antimicrobial Program in Macrophages. Immunity. 2019;50:432–445.e7. - PMC - PubMed

LinkOut - more resources