. 2024 Sep 20;34(8):1235-1252.
doi: 10.1101/gr.278980.124.

A spatiotemporally resolved atlas of mRNA decay in the C. elegans embryo reveals differential regulation of mRNA stability across stages and cell types

Affiliations

A spatiotemporally resolved atlas of mRNA decay in the C. elegans embryo reveals differential regulation of mRNA stability across stages and cell types

Felicia Peng et al. Genome Res. .

Abstract

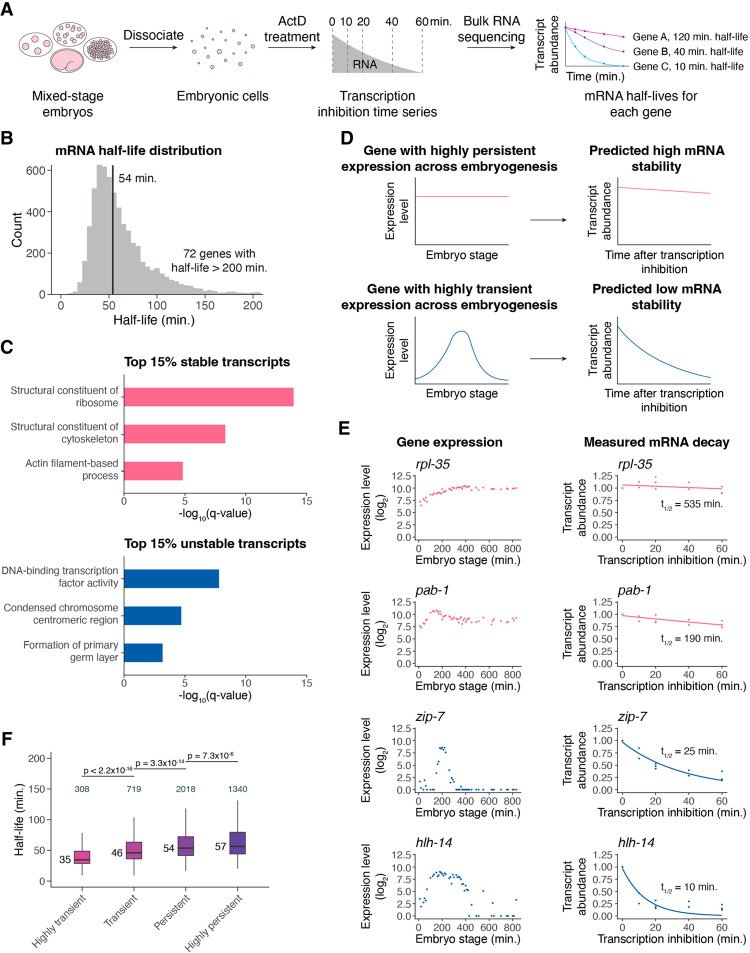
During embryonic development, cells undergo dynamic changes in gene expression that are required for appropriate cell fate specification. Although both transcription and mRNA degradation contribute to gene expression dynamics, patterns of mRNA decay are less well understood. Here, we directly measure spatiotemporally resolved mRNA decay rates transcriptome-wide throughout C. elegans embryogenesis by transcription inhibition followed by bulk and single-cell RNA sequencing. This allows us to calculate mRNA half-lives within specific cell types and developmental stages, and identify differentially regulated mRNA decay throughout embryonic development. We identify transcript features that are correlated with mRNA stability and find that mRNA decay rates are associated with distinct peaks in gene expression over time. Moreover, we provide evidence that, on average, mRNA is more stable in the germline than in the soma and in later embryonic stages than in earlier stages. This work suggests that differential mRNA decay across cell states and time helps to shape developmental gene expression, and it provides a valuable resource for studies of mRNA turnover regulatory mechanisms.


Figures

Figure 1.
Figure 1.
Transcription inhibition by actinomycin D (actD) allows mRNA decay measurements in C. elegans embryonic cells. (A) A schematic representation of the approach to measure mRNA half-lives in the C. elegans embryo using transcription inhibition and bulk RNA sequencing. (B) Distribution of mRNA half-lives across three biological replicates that met a moderate filtering strategy. The median half-life was 54 min (black line). Seventy-two genes with half-lives >200 min are not shown. (C) Select Gene Ontology (GO) categories enriched among the top 15% stable and unstable transcripts. Background set of genes used was all genes that met our moderate mRNA half-life filtering metric. (D) A schematic representation of a gene with highly persistent expression and a gene with highly transient expression and the predicted overall stability of their transcripts. (E, left) Expression over time of highly persistent (rpl-35, pab-1) and highly transient (zip-7, hlh-14) genes from a whole-embryo RNA sequencing time series (Hashimshony et al. 2015). (Right) The measured mRNA decay of the corresponding genes from our bulk RNA sequencing data, with each point representing normalized transcript abundance from one of three biological replicates. (F) Box plots showing the mRNA half-life distributions of genes characterized as highly transient, transient, persistent, or highly persistent transcriptome-wide. Numbers to the left of the box plots are median half-lives within each group. Numbers above the box plots are the number of genes within each group. P-values comparing median half-lives were calculated using the Wilcoxon rank-sum test. Outliers are not shown: From left to right, one, five, 50, and 57 genes within each group had mRNA half-lives >150 min.
Figure 2.
Figure 2.
Transcript stability correlates with specific sequence features. The relationship between transcript stability and different sequence features was examined using the top 15% stable and unstable transcripts identified in our bulk RNA sequencing data. The box plots compare different features between all, stable, and unstable transcripts. Numbers to the left of the box plots are median values within each group. Numbers above the box plots are the number of genes within each group. P-values comparing median values were calculated using the Wilcoxon rank-sum test. Outliers are not shown. (A) Distribution of codon optimality scores, as measured using tRNA adaptation index (tAI) values for each gene. Higher tAI values correspond to greater codon optimality. (B) Distribution of the number of introns averaged across all splice isoforms of a gene. (C) Distribution of 3′ UTR length averaged across all 3′ UTR isoforms of a gene. (D) Distribution of the percentage of GC content in the coding sequence of genes. For genes with multiple coding sequence isoforms, the longest isoform was used. (E) Distribution of the percentage of GC content in the 3′ UTR of genes. For genes with multiple 3′ UTR isoforms, the longest isoform was used. (F) Distribution of coding sequence length averaged across all splice isoforms of a gene. (G) Linear regression was used to identify the percentage of variation in mRNA half-lives explained by individual sequence features. (H) Multiple linear regression was used to identify the percentage of variation in mRNA half-lives explained by combinations of different sequence features. (I) MEME (Bailey et al. 2015) identified three motifs enriched in the 3′ UTRs of the top 15% stable transcripts compared with the 3′ UTRs of the top 15% unstable transcripts. For genes with multiple 3′ UTR isoforms, the longest isoform was used. The best match of each de novo motif to known motifs in mammals (Ray et al. 2013) is noted.
Figure 3.
Figure 3.
High transcript accumulation is associated with increased mRNA stability. (A) A schematic representation of genes that accumulate high, medium, or low transcript levels and the expected range of transcription and mRNA decay rates that could contribute to such accumulation. (B) Examples of genes that peak in expression ∼200 min after the four-cell stage with high, medium, and low transcript accumulation, from left to right. Expression data taken from a whole-embryo RNA sequencing time series (Hashimshony et al. 2015). (C) Examples of genes that peak in expression ∼350 min after the four-cell stage with high, medium, and low transcript accumulation, from left to right. Expression data taken from a whole-embryo RNA sequencing time series (Hashimshony et al. 2015). (D) Box plots showing the mRNA half-life distributions of genes that peak in expression ∼200 min after the four-cell stage to low, medium, and high transcript levels. Numbers to the left of the box plots are median half-lives within each group. Numbers above the box plots are the number of genes within each group. P-values comparing median half-lives were calculated using the Wilcoxon rank-sum test. Outliers are not shown: From left to right, one, zero, and seven genes within each group had mRNA half-lives >125 min. (E) Box plots showing the mRNA half-life distributions of genes that peak in expression ∼350 min after the four-cell stage with low, medium, and high transcript levels. Numbers to the left of the box plots are median half-lives within each group. Numbers above the box plots are the number of genes within each group. P-values comparing median half-lives were calculated using the Wilcoxon rank-sum test. Outliers are not shown: From left to right, zero, zero, and two genes within each group had mRNA half-lives >175 min. (F) MEME (Bailey et al. 2015) identified three motifs enriched in the 3′ UTRs of genes with high transcript accumulation compared with the 3′ UTRs of genes with low transcript accumulation ∼200 min after the four-cell stage. For genes with multiple 3′ UTR isoforms, the longest isoform was used. The best match of each de novo motif to known motifs in mammals (Ray et al. 2013) is noted. (G) MEME (Bailey et al. 2015) identified three motifs enriched in the 3′ UTRs of genes with high transcript accumulation compared with the 3′ UTRs of genes with low transcript accumulation ∼350 min after the four-cell stage. For genes with multiple 3′ UTR isoforms, the longest isoform was used. The best match of each de novo motif to known motifs in mammals (Ray et al. 2013) is noted. (H) The gene expression patterns for three putative RNA-binding protein genes in C. elegans from a whole-embryo RNA sequencing time series (Hashimshony et al. 2015). The genes are homologs of mammalian RNA-binding protein genes whose corresponding proteins are known to bind motifs similar to those discovered in F and G.
Figure 4.
Figure 4.
Single-cell RNA sequencing allows measurement of mRNA half-lives at high resolution throughout C. elegans embryogenesis. (A) A schematic representation of the approach to measure mRNA half-lives in the C. elegans embryo using transcription inhibition and single-cell RNA sequencing. (B) UMAP projection of the integrated data set of three biological replicates. Cells are colored by the age of the embryo from which a cell was produced, estimated from correlations to a whole-embryo RNA sequencing time series (Hashimshony et al. 2015). Trajectories corresponding to major cell types are labeled. (C) Scatter plot comparing the mRNA half-lives calculated in pseudobulk from the single-cell data and the half-lives calculated from the bulk-cell data on a log-log scale. Spearman's correlation coefficient = 0.76. Dashed line is the x = y line. (D) Box plots showing the stage-specific mRNA half-life distributions of genes within early-, middle-, and late-stage cells (50–200, 200–350, and 350+ min after the four-cell embryo stage, respectively). (E) Box plots showing the cell type–specific mRNA half-life distributions of genes within muscle, germline, epidermis, neuron, and pharynx. Numbers to the left of the box plots are median half-lives within each group. Numbers above the box plots are the number of genes within each group. P-values comparing median half-lives were calculated using the Wilcoxon rank-sum test. Outliers are not shown: From left to right for D, 203, 345, and 323 genes within each group had mRNA half-lives >100 min; from left to right for E, 141, 36, 150, 70, and 125 genes within each group had mRNA half-lives >150 min.
Figure 5.
Figure 5.
Differential mRNA decay occurs throughout different developmental stages of C. elegans embryogenesis. (A) Scatter plots comparing mRNA half-lives specific to early-, middle-, and late-stage cells in all pairwise comparisons. Each point represents a gene. Blue points correspond to the top 5% of genes with faster mRNA decay in the later stage compared with in the earlier stage. Pink points correspond to the top 5% of genes with slower mRNA decay in the later stage compared with in the earlier stage. Dashed line is the x = y line. (B) Select GO categories enriched among the top 5% of genes with faster mRNA decay in the later stage of embryogenesis compared with the earlier stage of embryogenesis. The background set of genes used in each comparison was shared genes we were able to calculate stage-specific mRNA half-lives for between the relevant stages. (CF, left) Median scaled expression of gene subset using data from a whole-embryo RNA sequencing time series (Hashimshony et al. 2015). Blue shading spans the early stage; purple shading spans the middle stage; and pink shading spans the late stage. (Right) Plot displaying the change in mRNA half-lives from earlier to later stage for gene subset.
Figure 6.
Figure 6.
mRNA degradation may contribute to transcription factor dynamics at both the RNA and protein levels. (A) Box plots showing the mRNA half-life distributions of transcription factor genes and all other genes in early-, middle-, and late-stage cells. Numbers to the left of the box plots are median half-lives within each group. Numbers above the box plots are the number of genes within each group. P-values comparing median half-lives were calculated using the Wilcoxon rank-sum test. Outliers are not shown: From left to right, 198, five, 336, nine, 314, and nine genes within each group had mRNA half-lives >100 min. (B) Grid displaying the percentage of transcription factors with transient or persistent mRNA expression and transient or persistent protein expression. The probability that RNA and protein dynamics are independent of one another was calculated using a Fisher's exact test. (C) Box plots showing the single-cell RNA sequencing pseudobulk mRNA half-life distributions of transcription factors with transient mRNA and protein expression, transient mRNA and persistent protein expression, persistent mRNA and transient protein expression, and persistent mRNA and protein expression. Numbers to the left of the box plots are median half-lives within each group. Numbers above the box plots are the number of genes within each group. P-values comparing median half-lives were calculated using the Wilcoxon rank-sum test. (D,E) Sublineages with coloring representing reporter GFP expression from a single-cell transcription factor protein expression atlas of the C. elegans embryo (Ma et al. 2021). Protein and mRNA dynamics are characterized below, along with pseudobulk measured mRNA half-life.
Figure 7.
Figure 7.
mRNA stability is correlated with cell type–specific functions. (A) Box plots showing the mRNA half-life distributions of cell type–specific and broadly expressed genes within muscle, germline, epidermis, neuron, and pharynx cells. Numbers to the left of the box plots are median half-lives within each group. Numbers above box plots are the number of genes within each group. The P-value comparing median half-lives was calculated using the Wilcoxon rank-sum test. Outliers are not shown: From left to right, 16, 125, 8, 28, one, 149, one, 69, five, and 120 genes within each group had mRNA half-lives >150 min. (B,i) Box plots showing the muscle-specific mRNA half-life distributions of mesoderm/muscle fate-specifying transcription factor genes, muscle structure genes, and all other genes. Numbers to the left of the box plots are median half-lives within each group. Numbers above box plots are the number of genes within each group. The P-value comparing median half-lives was calculated using the Wilcoxon rank-sum test. Outliers are not shown: From left to right, zero, four, and 137 genes within each group had mRNA half-lives >150 min. (ii,iii) Scatter plots of the normalized transcript abundance of the mesoderm/muscle fate-specifying transcription factor genes ceh-34, tbx-2, ceh-20, eya-1, and hlh-1 and the muscle structure genes deb-1, unc-78, unc-112, sgn-1, and tmd-2 throughout a 40 min transcription inhibition time course in muscle cells. Each point represents normalized transcript abundance from one of three biological replicates. (C,i) Box plots showing the neuron-specific mRNA half-life distributions of neural fate-specifying transcription factor genes, synapse-/dendrite-/axon-associated genes, and all other genes. Numbers to the left of the box plots are median half-lives within each group. Numbers above box plots are the number of genes within each group. The P-value comparing median half-lives was calculated using the Wilcoxon rank-sum test. Outliers are not shown: From left to right, zero, zero, and 70 genes within each group had mRNA half-lives >150 min. (ii,iii) Scatter plots of the normalized transcript abundance of the neural fate-specifying transcription factor genes ceh-5, egl-46, unc-86, ceh-43, and hlh-2 and the synapse-/dendrite-/axon-associated genes lnp-1, unc-37, mig-2, ced-10, and unc-53 throughout a 40 min transcription inhibition time course in neuronal cells. Each point represents normalized transcript abundance from one of three biological replicates. (D) Cell type–specific expression in the middle and late stages for genes with differential mRNA decay between muscle and neuron (i), epidermis and neuron (ii), and muscle and epidermis (iii). Cell type–specific expression in TPM was obtained from a C. elegans embryo single-cell atlas (Packer et al. 2019).
Figure 8.
Figure 8.
Differential mRNA decay occurs across germline and somatic cells in the C. elegans embryo. (A) Box plots showing the cell type–specific mRNA half-life distributions of genes across the germline and soma. (B) Scatter plot comparing soma- and germline-specific mRNA half-lives to one another. Each point represents a gene. Pink points correspond to the top 10% of genes with longer mRNA decay in the germline compared with in the soma. Blue points correspond to the top 10% of genes with faster mRNA decay in the germline compared with in the soma. Dashed line is the x = y line. (C) A cartoon of box plots representing the expected mRNA half-life distribution of genes with less, constant, or greater expression over time if mRNA decay primarily contributes to gene expression. (D) A cartoon of box plots representing the expected mRNA half-life distribution of genes with less, constant, or greater expression over time if transcription primarily contributes to gene expression. (E) Box plots showing the germline-specific mRNA half-life distributions for genes that decrease or increase in expression over time in the germline from a fold-change of one to two or greater than two. (F) Box plots showing the soma-specific mRNA half-life distributions for genes that decrease or increase in expression over time in the soma from a fold-change of one to two or greater than two. (G) Box plots showing the germline-specific mRNA half-life distributions of mRNA 3′ UTR-binding genes, other mRNA-binding genes, and genes not annotated as RNA binding. (H) Box plots showing the soma-specific mRNA half-life distributions of mRNA 3′ UTR-binding genes, other mRNA-binding genes, and genes not annotated as RNA binding. (I) Plot displaying the soma- and germline-specific mRNA half-lives for mRNA-binding genes whose decay is more rapid in the germline than in the soma. Numbers to the left of the box plots are median half-lives within each group. Numbers above the box plots are the number of genes with half-lives >150 min (A,G,H) or 325 min (E,F) within each group. The P-value comparing median half-lives was calculated using the Wilcoxon rank-sum test.

Update of

Similar articles

Cited by

References

    1. Abbadi D, Yang M, Chenette DM, Andrews JJ, Schneider RJ. 2019. Muscle development and regeneration controlled by AUF1-mediated stage-specific degradation of fate-determining checkpoint mRNAs. Proc Natl Acad Sci 116: 11285–11290. 10.1073/pnas.1901165116 - DOI - PMC - PubMed
    1. Alonso CR. 2012. A complex ‘mRNA degradation code’ controls gene expression during animal development. Trends Genet 28: 78–88. 10.1016/j.tig.2011.10.005 - DOI - PubMed
    1. Angeles-Albores D, Lee RYN, Chan J, Sternberg PW. 2018. Two new functions in the WormBase enrichment suite. MicroPublication Biol 2018: 10.17912/W25Q2N. 10.17912/W25Q2N - DOI - PMC - PubMed
    1. Bae H, Coller J. 2022. Codon optimality-mediated mRNA degradation: linking translational elongation to mRNA stability. Mol Cell 82: 1467–1476. 10.1016/j.molcel.2022.03.032 - DOI - PMC - PubMed
    1. Bailey TL, Johnson J, Grant CE, Noble WS. 2015. The MEME suite. Nucleic Acids Res 43: W39–W49. 10.1093/nar/gkv416 - DOI - PMC - PubMed

MeSH terms

Substances

LinkOut - more resources