. 2024 Jul 3;22(2):qzae030.
doi: 10.1093/gpbjnl/qzae030.

Multi-omic Analyses Shed Light on The Genetic Control of High-altitude Adaptation in Sheep

Affiliations

Multi-omic Analyses Shed Light on The Genetic Control of High-altitude Adaptation in Sheep

Chao Li et al. Genomics Proteomics Bioinformatics. .

Abstract

Sheep were domesticated in the Fertile Crescent and then spread globally, where they have been encountering various environmental conditions. The Tibetan sheep has adapted to high altitudes on the Qinghai-Tibet Plateau over the past 3000 years. To explore genomic variants associated with high-altitude adaptation in Tibetan sheep, we analyzed Illumina short-reads of 994 whole genomes representing ∼ 60 sheep breeds/populations at varied altitudes, PacBio High fidelity (HiFi) reads of 13 breeds, and 96 transcriptomes from 12 sheep organs. Association testing between the inhabited altitudes and 34,298,967 variants was conducted to investigate the genetic architecture of altitude adaptation. Highly accurate HiFi reads were used to complement the current ovine reference assembly at the most significantly associated β-globin locus and to validate the presence of two haplotypes A and B among 13 sheep breeds. The haplotype A carried two homologous gene clusters: (1) HBE1, HBE2, HBB-like, and HBBC, and (2) HBE1-like, HBE2-like, HBB-like, and HBB; while the haplotype B lacked the first cluster. The high-altitude sheep showed highly frequent or nearly fixed haplotype A, while the low-altitude sheep dominated by haplotype B. We further demonstrated that sheep with haplotype A had an increased hemoglobin-O2 affinity compared with those carrying haplotype B. Another highly associated genomic region contained the EGLN1 gene which showed varied expression between high-altitude and low-altitude sheep. Our results provide evidence that the rapid adaptive evolution of advantageous alleles play an important role in facilitating the environmental adaptation of Tibetan sheep.

Keywords: Environmental adaptation; High altitude; Hypoxia; Selection signature; Sheep.


Conflict of interest statement

The authors have declared no competing interests.

Figures

Figure 1
Figure 1
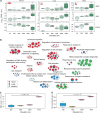
Geographical distribution and genetic diversity of 924 domestic and 70 wild sheep used in this study A. Geographical distribution of all sheep used in this study. The size of the solid circle represents the number of domestic sheep, while the shape indicates the distribution of wild individuals in a geographical region. Red lines indicate the locations of newly sequenced samples. B. and C. PCA of all samples (B) and domestic sheep only (C). PCA, principal component analysis; PC, principal component.
Figure 2
Figure 2
Association analysis between 34,298,967 variants and habitat altitudes in 450 sheep A. Manhattan plot representing the association of SNPs and INDELs (< 50 bp) with habitat altitudes in sheep (n = 450). The horizontal red dotted line indicates the Bonferroni-corrected significance threshold (−log10P value = 8.84). B. and C. Manhattan plots of genome-wide XP-EHH (B) and XP-CLR (C) estimates. The XP-EHH and XP-CLR estimates were calculated in 50-kb windows sliding in 10-kb steps along the genomes. The threshold values corresponding to the top 1% of the XP-EHH values (XP-EHH < −1.74 or XP-EHH > 1.99) and the XP-CLR values (−log10 XP-CLR > 1.943) are shown as the horizontal red dotted lines. D. and E. Comparison of selected genomic regions on Chr15 (D) and Chr25 (E) identified in selection scans of 924 domestic sheep. Chr, chromosome; SNP, single nucleotide polymorphism; INDEL, insertion and deletion; HBE1, hemoglobin subunit ε 1; HBB, hemoglobin subunit β-A; HBBC, hemoglobin subunit β-C; EGLN1, Egl-9 family hypoxia-inducible factor 1.
Figure 3
Figure 3
Global gene expression in 12 organs between the high-altitude and low-altitude sheep A. Clustering of samples was based on whole-genome expression values calculated as the TPM. The correlation between samples was measured by Spearman’s rank correlation coefficient. B. A schematic view of the DEGs in 12 organs. C. The enriched GO biological processes in cardiovascular and musculoskeletal systems. D. Global expression of three protein-coding genes with differential expression in at least one organ. TPM, transcripts per million; DEG, differentially expressed gene; GO, Gene Ontology; FDR, false discovery rate.
Figure 4
Figure 4
mRNA expression and biological functions of DEGs in the muscle, lung, and heart of sheep at different altitudes A. Transcription patterns of HBBC, HBB, and EGLN1 in the muscle, lung, and heart of sheep at six different altitudes. B. The association between mRNA expression of candidate genes and altitudes (from 0 to 5000 m a.s.l.) was tested with the R lm() function. Gene sets within the top 100 genes and a P value less than 0.05 in three organs were selected for GO enrichment analysis. Gray circles represent the clusters of gene sets enriched for genes differentially expressed in heart (red), lung (blue), and muscle (green). Balloon size corresponds to the percentage of genes under GO terms from the corresponding gene list. C. and D. Comparison of RBC count (C) and Hb concentration (D) in sheep residing at varying altitudes. P values were determined using the Student’s t-test. RBC, red blood cell; Hb, hemoglobin; mRNA, messenger RNA; a.s.l., above sea level.
Figure 5
Figure 5
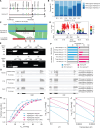
Association of SVs at the β-globin locus with different altitudes A. A schematic diagram of the sheep β-globin locus. The specific SVs are between haplotypes A and B, where haplotype B possesses an approximately 40-kb deletion. B. The frequency distribution of haplotypes A and B in sheep at different altitudes. C. Genomic alignment of the β-globin locus in argali, high-altitude (Tibetan), and low-altitude (Texel) sheep. Red triangles indicate primer positions. D. The zoom-in GWAS signals on Chr15. LD between the SV (the diamond-shaped blue point) and other variants (SNPs and INDELs < 50 bp) is quantified by the squared Pearson coefficient (r2). E. PCR-based genotyping verified the haplotypes A and B in the high-altitude (High) and low-altitude (Low) sheep. F. Frequency of the haplotypes A and B in the high-altitude and low-altitude sheep. G. IGV visualization of the mRNA expression between the haplotypes A and B in three organs (muscle, lung, and heart) of Tibetan and Hu sheep. H. The O2 equilibrium curves of haplotypes A and B Hbs in the absence (stripped) or presence of 0.1 M KCl and 0.2 mM DPG at 37°C and pH 7.4. I. Bohr effect of haplotypes A and B Hbs at 37°C, as indicated by a plot of log10P50vs. pH in the absence (stripped) or presence of 0.1 M KCl and 0.2 mM DPG. Bohr factor (Φ) is equal to the slope of the corresponding linear plot. J. Temperature effects (reflected by the overall change of enthalpy for oxygenation ΔH′) on the O2 affinity of haplotypes A and B Hbs at pH 7.4, as indicated by a plot of log10P50vs. 1/temperature (K) in the absence (stripped) or presence of 0.1 M KCl and 0.2 mM DPG. SV, structural variant; GWAS, genome-wide association study; LD, linkage disequilibrium; PCR, polymerase chain reaction; IGV, Integrative Genomics Viewer; DPG, 2,3-diphosphoglycerate.
Figure 6
Figure 6
Association of the EGLN1 G/A SNP (Chr25:3,503,284 bp) with different altitudes A. The zoom-in GWAS signals on Chr25. LD between the G/A SNP and other variants is quantified by the squared Pearson coefficient (r2). B. Allele frequency of the G/A SNP between the high-altitude and low-altitude sheep. C. Allele frequency of the putatively adaptive G allele in worldwide sheep populations. D. The expression level of mRNA in the G/A SNP region and its corresponding genotypes. E. The exonic expression of EGLN1 in the muscle between the high-altitude and low-altitude sheep. F. The epigenetic signals in the region encompassing the putatively adaptive G allele. G. Splice junction patterns between exons 2 and 4. The two transcripts of EGLN1 at the corresponding positions are shown at the bottom. The numbers in red indicate the reads shared between the two transcripts; each number corresponds to a sample, and the numbers are separated by commas. UTR, untranslated region.

References

    1. Chen FH, Dong GH, Zhang DJ, Liu XY, Jia X, An CB, et al.Agriculture facilitated permanent human occupation of the Tibetan Plateau after 3600 BP. Science 2015;347:248–50. - PubMed
    1. Meyer MC, Aldenderfer MS, Wang Z, Hoffmann DL, Dahl JA, Degering D, et al.Permanent human occupation of the central Tibetan Plateau in the early Holocene. Science 2017;355:64–7. - PubMed
    1. Jeong C, Ozga AT, Witonsky DB, Malmstrom H, Edlund H, Hofman CA, et al.Long-term genetic stability and a high-altitude East Asian origin for the peoples of the high valleys of the Himalayan arc. Proc Natl Acad Sci U S A 2016;113:7485–90. - PMC - PubMed
    1. Hu XJ, Yang J, Xie XL, Lv FH, Cao YH, Li WR, et al.The genome landscape of Tibetan sheep reveals adaptive introgression from argali and the history of early human settlements on the Qinghai-Tibetan Plateau. Mol Biol Evol 2019;36:283–303. - PMC - PubMed
    1. Ren L, Yang Y, Qiu M, Brunson K, Chen G, Dong G.. Direct dating of the earliest domesticated cattle and caprines in northwestern China reveals the history of pastoralism in the Gansu-Qinghai region. J Archaeol Sci 2022;144:105627.

LinkOut - more resources