. 2024 Aug 15;16(1):54.
doi: 10.1038/s41368-024-00315-x.

Caspase-11 mediated inflammasome activation in macrophages by systemic infection of A. actinomycetemcomitans exacerbates arthritis

Affiliations

Caspase-11 mediated inflammasome activation in macrophages by systemic infection of A. actinomycetemcomitans exacerbates arthritis

Tokuju Okano et al. Int J Oral Sci. .

Abstract

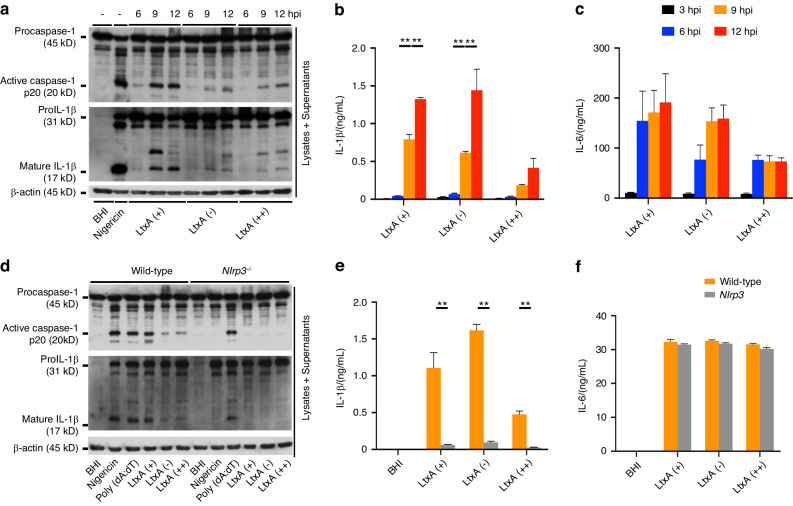
Clinical studies have shown that Aggregatibacter actinomycetemcomitans (A. actinomycetemcomitans) is associated with aggressive periodontitis and can potentially trigger or exacerbate rheumatoid arthritis (RA). However, the mechanism is poorly understood. Here, we show that systemic infection with A. actinomycetemcomitans triggers the progression of arthritis in mice anti-collagen antibody-induced arthritis (CAIA) model following IL-1β secretion and cell infiltration in paws in a manner that is dependent on caspase-11-mediated inflammasome activation in macrophages. The administration of polymyxin B (PMB), chloroquine, and anti-CD11b antibody suppressed inflammasome activation in macrophages and arthritis in mice, suggesting that the recognition of lipopolysaccharide (LPS) in the cytosol after bacterial degradation by lysosomes and invasion via CD11b are needed to trigger arthritis following inflammasome activation in macrophages. These data reveal that the inhibition of caspase-11-mediated inflammasome activation potentiates aggravation of RA induced by infection with A. actinomycetemcomitans. This work highlights how RA can be progressed by inflammasome activation as a result of periodontitis-associated bacterial infection and discusses the mechanism of inflammasome activation in response to infection with A. actinomycetemcomitans.


Conflict of interest statement

The authors declare no competing interests.

Figures

Fig. 1
Fig. 1
A. actinomycetemcomitans exacerbates arthritis in a CAIA model in a macrophage-dependent manner. ah BALB/c mice were intraperitoneally injected with 1.5 mg of anti-collagen antibody on day 0 and with A. actinomycetemcomitans ATCC29522 (Aa), P. gingivalis ATCC33277 (Pg) or PBS on day 3. The arthritis scores were then monitored for 10 days. All paws were collected on day 10 for HE staining or cytokine analysis (n = 5 mice per group). a Schematic of CAIA model infected with A. actinomycetemcomitans or P. gingivalis. b Representative photographs of hind paws. c Arthritis score. d Representative HE staining of hind paws. Scale bar, 100 μm. e Cell number in 1 mm2 synovium. f Stained cell area in 1 mm2 synovium. g, h ELISA analysis for IL-1β and IL-6 release in paws ip BALB/c mice were intraperitoneally injected with 1.5 mg of anti-collagen antibody on day 0, followed by the injection of liposomes containing clodronate or PBS on day 2 and A. actinomycetemcomitans (Aa) on day 3. The arthritis scores were monitored for 10 days. The paws of all the mice were collected on day 10 for HE staining or cytokine analysis (clodronate liposome, n = 8; control liposome, n = 4). g Schematic of CAIA model infected with A. actinomycetemcomitans and administered 10 μL/g of liposomes containing clodronate or PBS. Scale bar, 100 μm. h Representative photographs of hind paws. i Arthritis score. j Representative HE staining of hind paws. k, l ELISA analysis showing the release of IL-1β and IL-6 in paws. c, k ∗∗P < 0.01 indicates a statistically significant difference using a one-way ANOVA with the Tukey test (ns, not significant). eh, mp P < 0.05 and ∗∗P < 0.01 indicate a statistically significant difference using a t-test (ns, not significant)
Fig. 2
Fig. 2
NLRP3 inflammasome is activated by infection with A. actinomycetemcomitans. BMDMs from wild-type or NLRP3-deficient (Nlrp3−/−) mice were infected with A. actinomycetemcomitans LtxA (+) (ATCC29522), LtxA (-) (ATCC43717), or LtxA (++) (JP2). Then, 5 μmol/L of nigericin or 2 μg of Poly (dA:dT) were administered together with 200 ng of LPS-EB-primed BMDMs as a control to activate NLRP3 or AIM2 inflammasomes. Brain heart infusion (BHI) media was added as a negative control for inflammasome activation. Cell lysates and culture supernatants were harvested at (ac) the indicated times (hpi, h post-infection) or (df) 9 hpi. a, d Immunoblot analysis for procaspase-1, pro-IL-1β, and β-actin in cells and active caspase-1 and mature IL-1β in supernatants. b, c, e, f ELISA analysis for IL-1β and IL-6 release in supernatants. a, d Blots are representative of three independent experiments. b, c, e, f Data are shown as the mean ± SD of triplicates and are representative of three independent experiments. ∗∗P < 0.01 indicate a statistically significant difference using a t-test
Fig. 3
Fig. 3
Caspase-11-mediated NLRP3 inflammasome is activated by infection with A. actinomycetemcomitans. BMDMs from wild-type, NLRP3-deficient (Nlrp3−/−), ASC-deficient (Pycard−/−) or caspase-11-deficient (Caspase-11−/−) mice were infected with A. actinomycetemcomitans LtxA (+) (ATCC29522), LtxA (-) (ATCC43717), or LtxA (++) (JP2). Nigericin (5 μmol/L) or Poly (dA:dT) (2 μg) were administered to LPS-EB-primed BMDMs as a control to activate NLRP3 or AIM2 inflammasomes, or 5 μg of LPS-EB was transfected into BMDMs as a control to activate caspase-11-mediated non-canonical NLRP3 inflammasomes. BHI media was added as a negative control for inflammasome activation. Cell lysates and culture supernatants were harvested at 9 hpi. a and f LDH release assay in culture supernatants. b, g Immunoblot analysis for full-length GSDMD (GSDMD-FL, 55 kDa) N terminal of GSDMD (GSDMD-N, 30 kDa), or β-actin in cells. c Immunoblot analysis for procaspase-1, pro-IL-1β, and β-actin in cells and active caspase-1 and mature IL-1β in supernatants. d, e ELISA analysis for IL-1β and IL-6 release in supernatants. b, c, g Blots are representative of three independent experiments. a, d, e, f Data are shown as the mean ± SD of triplicates and are representative of three independent experiments. ∗∗P < 0.01 indicate a statistically significant difference using a t-test
Fig. 4
Fig. 4
LPS from A. actinomycetemcomitans triggers inflammasome activation. a, b A. actinomycetemcomitans ATCC29522 (Viable) was infected or bacterial culture supernatants (Sup.), heat-killed (95 °C) bacterial culture (Heat killed), or supernatants from heat-killed bacterial culture (Heat killed sup.) were added to BMDMs for 9 h. Nigericin (5 μmol/L) was administered to the BMDMs as a control to activate NLRP3 inflammasomes. BHI media was added as a negative control for inflammasome activation. Cell lysates and culture supernatants were harvested at 9 hpi. c, d PMB (0, 1, or 5 μg/mL)-administered BMDMs were infected with A. actinomycetemcomitans ATCC29522 (Aa) for 9 h. Cell lysates and culture supernatants were harvested at 9 hpi. Nigericin (5 μmol/L) was administered to BMDMs as a control to activate NLRP3 inflammasomes. BHI media was added as a negative control for inflammasome activation. eg BMDMs were subjected to 10 μg of LPS from E. coli MC1061 (LPS Ec), P. gingivalis ATCC33277 (LPS Pg), P. intermedia ATCC25611 (LPS Pi) or LPS from A. actinomycetemcomitans ATCC29522 (LPS Aa) with or without transfection for 10 h. Nigericin (5 μmol/L) was administered to BMDMs as a control to activate NLRP3 inflammasomes. Tris-HCl was added as a negative control for inflammasome activation. Cell lysates and culture supernatants were harvested at 9 h post-addition. a, c, e Immunoblot analysis for procaspase-1, pro-IL-1β and β-actin in cells and active caspase-1 and mature IL-1β in supernatants. b, d, g ELISA analysis for IL-1β release in supernatants. f LDH release assay in culture supernatants. a, c, e Blots are representative of three independent experiments. b, d, f, g Data are shown as the mean ± SD of triplicates and are representative of three independent experiments. ∗∗P < 0.01 indicate a statistically significant difference using a t-test
Fig. 5
Fig. 5
Chloroquine attenuates inflammasome activation induced by infection with A. actinomycetemcomitans. ad Chloroquine (25, 50, or 100 μg/mL)-administered or 3-MA (10, 25, or 50 μg/mL)-administered BMDMs were infected with A. actinomycetemcomitans ATCC29522 (Aa) for 9 h. Cell lysates and culture supernatants were harvested at 9 hpi. Nigericin (5 μmol/L) was administered to BMDMs as a control to activate NLRP3 inflammasomes. a, c Immunoblot analysis for procaspase-1, pro-IL-1β and β-actin in cells and active caspase-1 and mature IL-1β in supernatants. b, d ELISA analysis for IL-1β release in supernatants. e, f BMDMs from LysM-Cre transgenic line or myeloid cell-specific Atg5-deficient (Atg5fl/flLysMCre) mice were infected with A. actinomycetemcomitans ATCC29522 (Aa). Nigericin (5 μmol/L) was administered to 200 ng of LPS-EB-primed BMDMs as a control to activate NLRP3 inflammasomes. BHI media was added as a negative control for inflammasome activation. Cell lysates and culture supernatants were harvested at 9 hpi. e Immunoblot analysis for procaspase-1, pro-IL-1β and β-actin in cells and active caspase-1 and mature IL-1β in supernatants. f ELISA analysis for IL-1β release in supernatants. g BMDMs were infected with A. actinomycetemcomitans ATCC29522 (Aa) for 4 h. Representative immunostaining analysis for lysosomal disruption (arrowheads indicate merge region). Scale bar, 20 μm. Nuclear was stained by DAPI, LAMP1 was stained using Alexa fluor 488, while galectin-3 was stained using Cy5. a, c, e Blots are representative of three independent experiments. b, d, f Data are shown as the mean ± SD of triplicates and are representative of three independent experiments. ∗∗P < 0.01 indicate a statistically significant difference using a t-test (ns not significant)
Fig. 6
Fig. 6
CD11b-mediated invasion to macrophages is an essential step in inflammasome activation in response to infection with A. actinomycetemcomitans. ac Anti-CD11b antibody (2.5, 5, or 10 μg/mL)-administered, anti-CD18 antibody (10 μg/mL)-administered, or isotype control IgG (10 μg/mL)-administered BMDMs were infected with A. actinomycetemcomitans ATCC29522 (Aa) for 9 h. Cell lysates and culture supernatants were harvested at 9 hpi. a Immunoblot analysis for procaspase-1, pro-IL-1β and β-actin in cells and active caspase-1 and mature IL-1β in supernatants. b, c ELISA analysis for IL-1β and IL-6 release in supernatants. d Anti-CD11b antibody (10 μg/mL)-administered or isotype control IgG (10 μg/mL)-administered BMDMs were added or transfected with 10 μg of LPS-EB, 5 μmol/L of nigericin, heat-killed A. actinomycetemcomitans ATCC29522 (Heat killed Aa), or 10 μg of LPS from A. actinomycetemcomitans ATCC 29522 (LPS Aa). ELISA analysis for IL-1β release in supernatants. e, f Anti-CD11b antibody (10 μg/mL)-administered or isotype control IgG (10 μg/mL)-administered BMDMs were infected with A. actinomycetemcomitans ATCC29522 (Aa) for 4 h. e Representative immunostaining analysis for lysosomal formation (arrowheads indicate phagosome). Scale bar, 10 μm. LAMP1 was stained using Alexa fluor 488, while A. actinomycetemcomitans ATCC29522 was stained using Cy5. f Bacterial number in cytosol of BMDMs. g Anti-CD11b antibody (10 μg/mL)-administered or isotype control IgG (10 μg/mL)-administered BMDMs were infected with A. actinomycetemcomitans ATCC29522 (Aa) for the indicated time. Colony forming units (CFUs) in supernatants. a Blots are representative of three independent experiments. bd, f, g Data are shown as the mean ± SD of triplicates and are representative of three independent experiments. ∗∗P < 0.01 indicate a statistically significant difference using a t-test. (e) Images are representative of three independent experiments
Fig. 7
Fig. 7
Inflammasome inhibition with chloroquine and anti-CD11b antibody attenuates arthritis in CAIA model. BALB/c mice were intraperitoneally injected with 1.5 mg of anti-collagen antibody on day 0, followed by the injection of chloroquine, anti-CD11b antibody, PBS or control IgG on days 3, 4, 5 and A. actinomycetemcomitans (Aa) on day 3. The arthritis scores were then monitored for 10 days. All paws were collected on day 10 for HE staining or cytokine analysis (PBS, n = 8; chloroquine, n = 6; control IgG, n = 5; anti-CD11b antibody, n = 5). a Schematic of CAIA model infected with A. actinomycetemcomitans (Aa) and administered 10 μL/g of liposomes containing clodronate or PBS. b Arthritis score. c, d Representative photographs of hind paws. e, f Representative HE staining of hind paws. Scale bar, 100 μm. g, i Cell number in 1 mm2 synovium. h, j Stained cell area in 1 mm2 synovium. kn ELISA analysis for IL-1β and IL-6 release in paws. gn Data are shown as the mean ± SD of triplicates and are representative of three independent experiments. P < 0.05, ∗∗P < 0.01 and ∗∗∗P < 0.001 indicate a statistically significant difference using a t-test (ns not significant)
Fig. 8
Fig. 8
Caspase-11 drives arthritis via IL-1β secretion in CAIA model infected with A. actinomycetemcomitans. C57BL/6 wild-type or caspase-11-deficient mice were intraperitoneally injected with 5 mg of anti-collagen antibody on day 0 and with A. actinomycetemcomitans (Aa) or PBS on days 3 and 10. The arthritis scores were then monitored for 14 days. All paws were collected on day 14 for HE staining, μCT, or cytokine analysis (wild-type + PBS and Caspase-11−/− + PBS, n = 6 mice per group, wild-type + Aa and Caspase-11−/− + Aa, n = 9 mice per group). a Schematic of CAIA model infected with A. actinomycetemcomitans (Aa) using C57BL/6 wild-type or caspase-11-deficient mice. b Arthritis score. c Representative photographs of fore and hind paws. d Representative HE staining of fore and hind paws. Scale bar, 100 μm. e Cell number in 1 mm2 synovium. f Stained cell area in 1 mm2 synovium. g Representative two-dimensional μCT images of longitudinal sections of distal femur. Scale bar, 500 μm. h Bone volume per total tissue volume (BV/TV). i, j ELISA analysis for IL-1β and IL-6 release in paws. b ∗∗P < 0.01 indicates a statistically significant difference using a one-way ANOVA with the Tukey test. ej Data are shown as the mean ± SD of triplicates and are representative of three independent experiments. P < 0.05 and ∗∗P < 0.01 indicate a statistically significant difference using a t-test (ns not significant)

References

    1. Socransky, S. S., Haffajee, A. D., Cugini, M. A., Smith, C. & Kent, R. L. Microbial complexes in subgingival plaque. J. Clin. Periodontol.25, 134–144 (1998). - PubMed
    1. Hajishengallis, G. Periodontitis: From microbial immune subversion to systemic inflammation. Nat. Rev. Immunol.15, 30–44 (2015). - PMC - PubMed
    1. Lavu, V. et al. Polymorphic regions in the interleukin-1 gene and susceptibility to chronic periodontitis: A genetic association study. Genet. Test. Mol. Biomark.19, 175–181 (2015). - PMC - PubMed
    1. Zhu, J. et al. Interleukin-6-174G/C Polymorphism Contributes to Periodontitis Susceptibility: An Updated Meta-Analysis of 21 Case-Control Studies. Dis. Markers2016, 9612421 (2016). - PMC - PubMed
    1. Ding, C., Ji, X., Chen, X., Xu, Y. & Zhong, L. TNF-α gene promoter polymorphisms contribute to periodontitis susceptibility: Evidence from 46 studies. J. Clin. Periodontol.41, 748–759 (2014). - PubMed

Publication types

LinkOut - more resources