Observational Study
. 2024 Aug 14;15(1):6657.
doi: 10.1038/s41467-024-50989-4.

Dynamic PET reveals compartmentalized brain and lung tissue antibiotic exposures of tuberculosis drugs

Affiliations
Observational Study

Dynamic PET reveals compartmentalized brain and lung tissue antibiotic exposures of tuberculosis drugs

Xueyi Chen et al. Nat Commun. .

Abstract

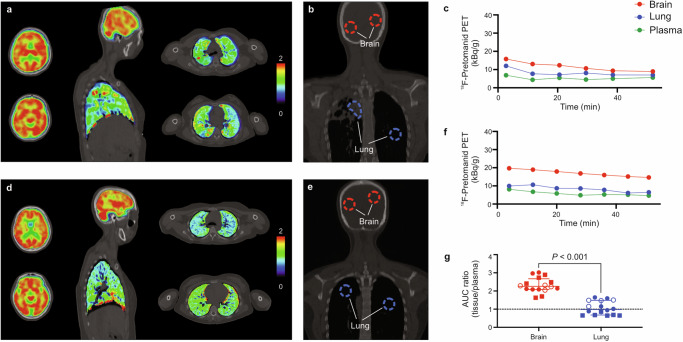
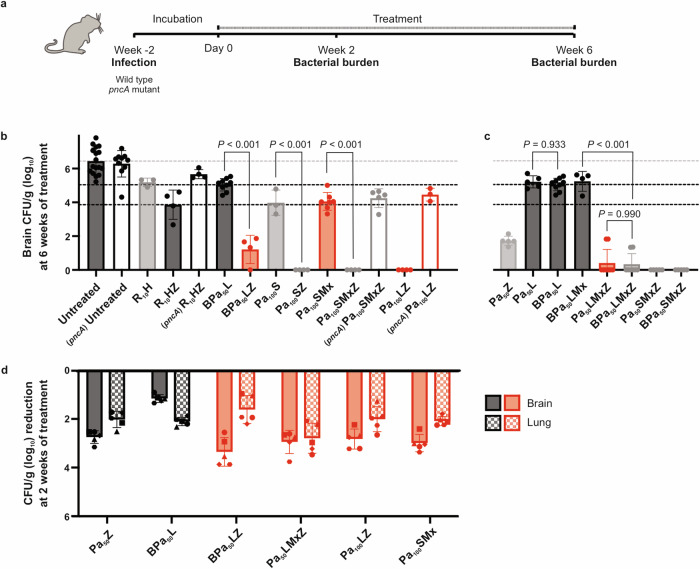
Tuberculosis (TB) remains a leading cause of death, but antibiotic treatments for tuberculous meningitis, the deadliest form of TB, are based on those developed for pulmonary TB and not optimized for brain penetration. Here, we perform first-in-human dynamic 18F-pretomanid positron emission tomography (PET) in eight human subjects to visualize 18F-pretomanid biodistribution as concentration-time exposures in multiple compartments (NCT05609552), demonstrating preferential brain versus lung tissue partitioning. Preferential, antibiotic-specific partitioning into brain or lung tissues of several antibiotics, active against multidrug resistant (MDR) Mycobacterium tuberculosis strains, are confirmed in experimentally-infected mice and rabbits, using dynamic PET with chemically identical antibiotic radioanalogs, and postmortem mass spectrometry measurements. PET-facilitated pharmacokinetic modeling predicts human dosing necessary to attain therapeutic brain exposures. These data are used to design optimized, pretomanid-based regimens which are evaluated at human equipotent dosing in a mouse model of TB meningitis, demonstrating excellent bactericidal activity without an increase in intracerebral inflammation or brain injury. Importantly, several antibiotic regimens demonstrate discordant activities in brain and lung tissues in the same animal, correlating with tissue antibiotic exposures. These data provide a mechanistic basis for the compartmentalized activities of antibiotic regimens, with important implications for developing treatments for meningitis and other infections in compartments with unique antibiotic penetration.


Conflict of interest statement

Vijay D. Ivaturi is a co-founder and Vijay D. Ivaturi and Bhavatharini Arun are employees of Pumas-AI, which commercializes Pumas and Lyv software. All other authors declare that they have no competing interests.

Figures

Fig. 1
Fig. 1. First-in-human dynamic 18F-pretomanid PET/CT studies in human subjects.
Eight subjects were prospectively enrolled and imaged in accordance with the U.S. Food and Drug Administration guidelines (NCT05609552). a 18F-Pretomanid PET area under the curve (AUC) heatmap overlay on computed tomography (CT) of a representative subject with pulmonary TB (subject 7). b Coronal CT section from the same subject showing the volumes of interest (VOI) used to quantify the 18F-pretomanid PET signal and obtain time-activity curves from different tissues (panel c). d 18F-Pretomanid AUC heatmap overlay on CT of a representative healthy subject (subject 2). e Coronal CT section from the same subject showing the volumes of interest (VOI) used to quantify the 18F-pretomanid PET signal and obtain time-activity curves from different tissues (panel f). g 18F-Pretomanid (tissue-to-plasma) AUC0-60min ratios from all subjects demonstrate significantly higher brain versus lung tissue exposures (P < 0.001). Circles and squares represent female and male subjects respectively. Empty shapes represent TB patients. n = 2 VOI per tissue per subject (n = 16 brain, n = 16 lung). Data are represented as median ± interquartile range. Statistical comparisons were made using a two-tailed Mann-Whitney U test. Source data are provided as a Source Data file.
Fig. 2
Fig. 2. Compartmentalized antibiotic exposures in mouse studies.
Radioanalog of four antibiotics active against multidrug-resistant (MDR) Mycobacterium tuberculosis strains were utilized in mouse studies. Each radio analog is chemically identical to the respective parent antibiotic (panels a, d, g, j), and the radioisotope is retained within the major metabolite. Coronal, sagittal and transverse CT with PET AUC heatmap overlays (representing AUCtissue/plasma ratio) from representative mice, demonstrating spatially compartmentalized antibiotic exposures in lung and brain compartments are shown for (b) 18F-pretomanid (AUC0-60min), (e) 18F-sutezolid (AUC0-60min), (h) 18F-linezolid (AUC0-60min), and (k) 76Br-bedaquiline (AUC0-48h). Tissue-to-plasma ratios obtained using dynamic PET in live animals (AUC ratio) and by mass spectrometry (MS) from postmortem (tissue-to-plasma ratio) brain (red) and lung (blue) tissues are respectively shown for (c) 18F-pretomanid PET [AUC0-60min ratio, data from four animals; n = 8 brain volumes of interest (VOIs), n = 8 lung VOIs], pretomanid MS (tissue/plasma ratio, data from six animals; n = 6 brain, n = 6 lung samples), (f) 18F-sutezolid PET (AUC0-60min ratio, data from four animals; n = 8 brain VOIs, n = 8 lung VOIs), sutezolid MS (data from six animals; n = 6 brain, n = 6 lung samples), (i) 18F-linezolid PET (AUC0-60min ratio, data from four animals; n = 8 brain VOIs, n = 8 lung VOIs), linezolid MS (data from six animals; n = 5 brain, n = 6 lung samples), and (l) 76Br-Bedaquiline PET (AUC0-48h ratio, data from three animals; n = 6 brain VOIs, n = 6 lung VOIs), bedaquiline MS (data from five animals; n = 5 brain, n = 5 lung samples). The horizontal dotted lines indicate a tissue/plasma ratio of 1. Data are represented as median ± interquartile range. Statistical comparisons were made using a two-tailed Mann-Whitney U test. Source data are provided as a Source Data file.
Fig. 3
Fig. 3. Pharmacokinetic model to predict human tissue exposures for pretomanid.
a Schematic representation of the model for pretomanid tissue penetration based on a minimal physiology-based pharmacokinetic (mPBPK) framework. b Observed (black dots) and individual model-predicted (purple line) for 18F-pretomanid exposures in different tissues [brain, CSF (measured in cerebral ventricles), lung, and plasma (measured in left heart ventricle)] for the human subjects (S1–S8). Y-axis shows antibiotic exposure, and x-axis shows time (hours). CL = plasma clearance, Kp = partition coefficient for the tissue compartment, Qt = blood flow rate to tissue, Qlung = blood flow rate to lungs, Qbrain = blood flow rate to brain, QCSF = blood flow rate to brain ventricles (CSF), Rbrain = penetration ratio for brain, RCSF = penetration ratio for CSF, Rlung = penetration ratio for lungs.
Fig. 4
Fig. 4. Monte Carlo simulations to predict humans tissue exposures.
Monte Carlo simulations were performed in virtual subjects to predict tissue area under the curve (AUC) exposures in plasma (green), brain (red), and lung (blue) at various oral doses are shown for (a) pretomanid, (b) sutezolid, (c) linezolid and, (d) bedaquiline (n = 1000 virtual subjects for each antibiotic). The horizontal dotted black line represents the target AUC for each antibiotic and represents the lung tissue exposures achieved with standard oral dosing (bolded red) in patients with pulmonary TB. A second dotted line is shown for pretomanid, representing a dose of 600 mg/day. Data are represented as median ± interquartile range. Source data are provided as a Source Data file.
Fig. 5
Fig. 5. Optimized pretomanid-based multidrug regimens at human equipotent dosing.
a Two weeks after infection with Mycobacterium tuberculosis, mice with experimentally-induced TB meningitis were randomly allocated to receive multidrug regimens via oral gavage at human equipotent dosing (R, rifampin; H, isoniazid; Z, pyrazinamide; B, bedaquiline; Pa50 or Pa100, pretomanid corresponding to a human dose of 200 mg/day or 400–600 mg/day respectively; L, linezolid; S, sutezolid; Mx, moxifloxacin). Selected pyrazinamide-containing regimens were tested in mice infected with pyrazinamide-resistant M. tuberculosis (pncA mutant). Red bars represent optimized regimens, gray bars represent other regimens and black bars represent reference regimens. All animals also received adjunctive dexamethasone. b Bacterial burden [colony-forming unit (CFU) per gram of brain tissue (log10) from whole brain] at six weeks of treatment [animal numbers, n = 17/untreated, 10/untreated (pncA), 3/R10H, 4/R10HZ, 4/R10HZ (pncA), 9/BPa50L, 4/BPa50LZ, 3/Pa100S, 4/Pa100SZ, 7/Pa100SMx, 4/Pa100SMxZ, 5/Pa100SMxZ (pncA), 4/Pa100LZ, and 3/Pa100LZ (pncA)]. The bacterial burdens for reference regimens are shown as horizontal dotted lines for comparison; the top gray is for untreated animals representing the starting bacterial burden, the middle black is for the approved MDR regimen for pulmonary TB (BPa50L) and lower black is for the first-line, standard TB treatment for drug-susceptible TB meningitis (R10HZ). Regimens tested in mice infected with the pncA mutant are indicated by empty bars. c Bacterial burden at six weeks comparing regimens with and without bedaquiline and/or pyrazinamide (animal numbers, n = 5/Pa50Z, 5/Pa50L, 9/BPa50L, 4/BPa50LMx, 9/Pa50LMxZ, 8/BPa50LMxZ, 5/Pa50SMxZ, and 5/BPa50SMxZ). d Bacteria disseminate to the lungs after the brain infection. Therefore, bactericidal activities of several antibiotic regimens in brain and lung tissues of the same animal, two weeks after treatment initiation, were assessed. Data are shown as the reduction in whole brain (solid bar) and lung (checkered bar) organ CFU two weeks after treatment initiation (animal numbers, n = 5/BPa50L, 5/Pa50Z, 5/BPa50LZ, 5/Pa50LMxZ, 5/Pa100LZ, and 5/Pa100SMx). Data are represented as mean ± standard deviation. Statistical comparisons were made using a two-tailed student t-test and one-way ANOVA with Sidak’s multiple comparison correction. Source data are provided as a Source Data file.
Fig. 6
Fig. 6. Intracerebral inflammation in live animals using 124I-DPA-713 PET/CT.
Mice underwent live imaging two weeks after treatment initiation. a Transverse 124I-DPA-713 PET/CT images of representative mice from different treatment regimens and untreated mice. b Quantification of 124I-DPA-713 PET signal in the brain represented as standard uptake value mean (SUVmean) (animal numbers, n = 8/untreated, 4/Pa100SMx, 4/BPa50L, 4/BPa50LZ, 4/Pa50LMxZ, and 4/Pa100LZ) are shown. Data are represented as median ± interquartile range. Statistical comparisons were made using a two-tailed Mann-Whitney U test. Source data are provided as a Source Data file.

Update of

References

    1. Ehrlich, P. Chemotherapeutics: scientific principles, methods, and results. Address in pathology to 17th International Congress of Medicine (London, 1913). Lancet2, 445–451 (1913).
    1. Muller, M., dela Pena, A. & Derendorf, H. Issues in pharmacokinetics and pharmacodynamics of anti-infective agents: distribution in tissue. Antimicrob. Agents Chemother.48, 1441–1453 (2004). 10.1128/AAC.48.5.1441-1453.2004 - DOI - PMC - PubMed
    1. Jain, S. K. et al. Tuberculous meningitis: a roadmap for advancing basic and translational research. Nat. Immunol.19, 521–525 (2018). 10.1038/s41590-018-0119-x - DOI - PMC - PubMed
    1. Wilkinson, R. J. et al. Tuberculous meningitis. Nat. Rev. Neurol.13, 581–598 (2017). 10.1038/nrneurol.2017.120 - DOI - PubMed
    1. Huynh, J. et al. Tuberculous meningitis: progress and remaining questions. Lancet Neurol.21, 450–464 (2022). 10.1016/S1474-4422(21)00435-X - DOI - PubMed

Publication types

MeSH terms

Substances

LinkOut - more resources