. 2024 Aug 15;9(1):216.
doi: 10.1038/s41392-024-01928-8.

Branched-chain amino acid transaminase 1 confers EGFR-TKI resistance through epigenetic glycolytic activation

Affiliations

Branched-chain amino acid transaminase 1 confers EGFR-TKI resistance through epigenetic glycolytic activation

Tao Zhang et al. Signal Transduct Target Ther. .

Abstract

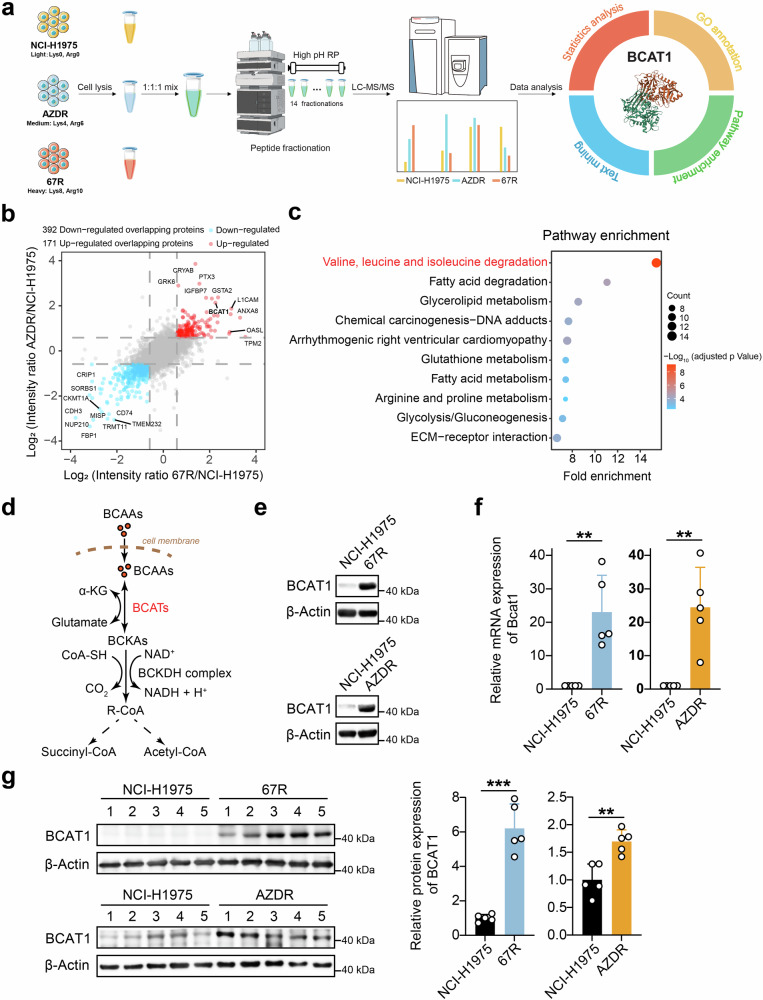
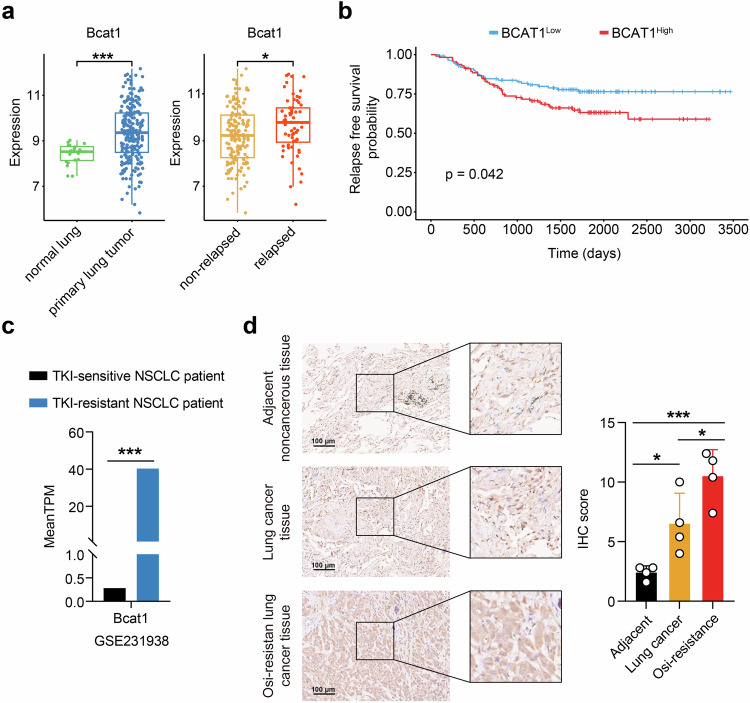
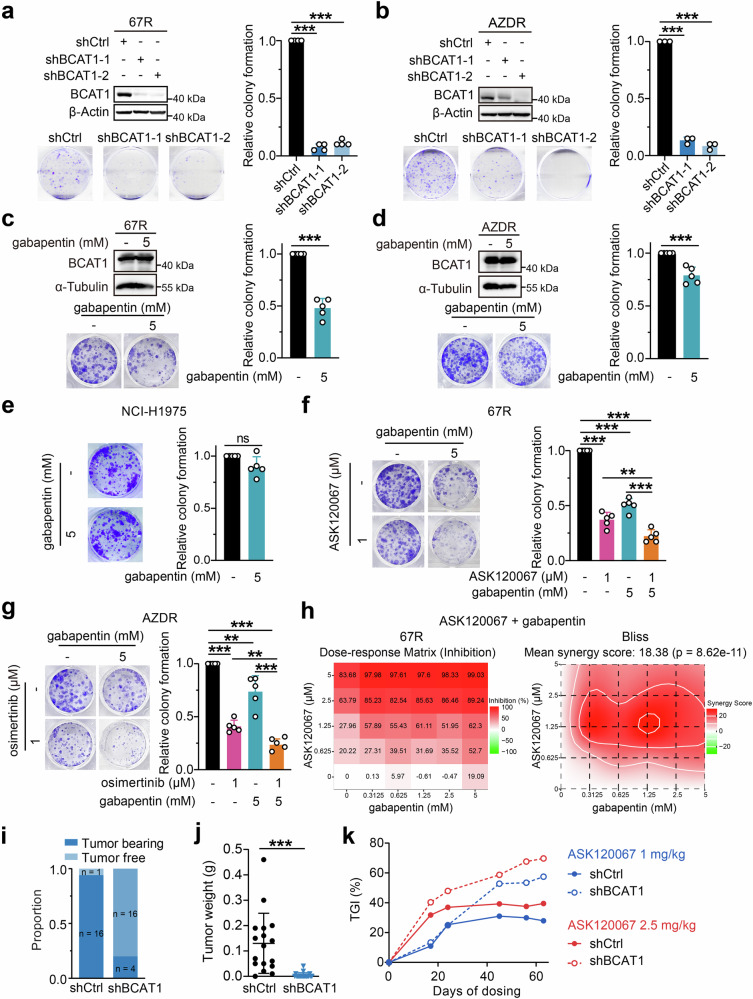
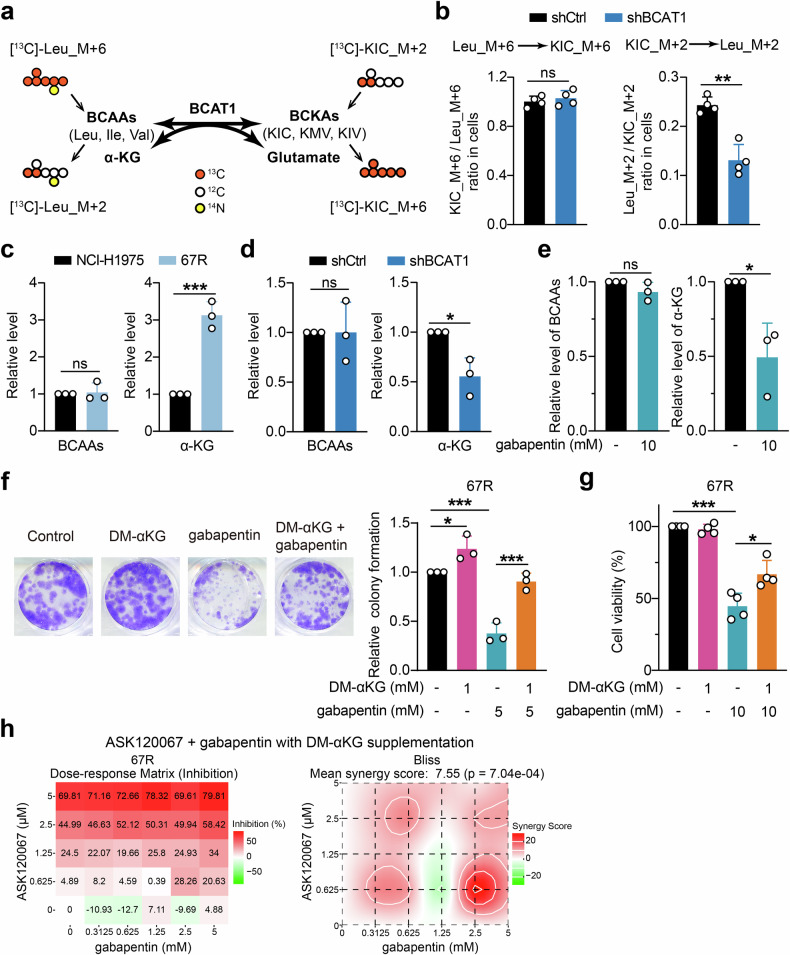
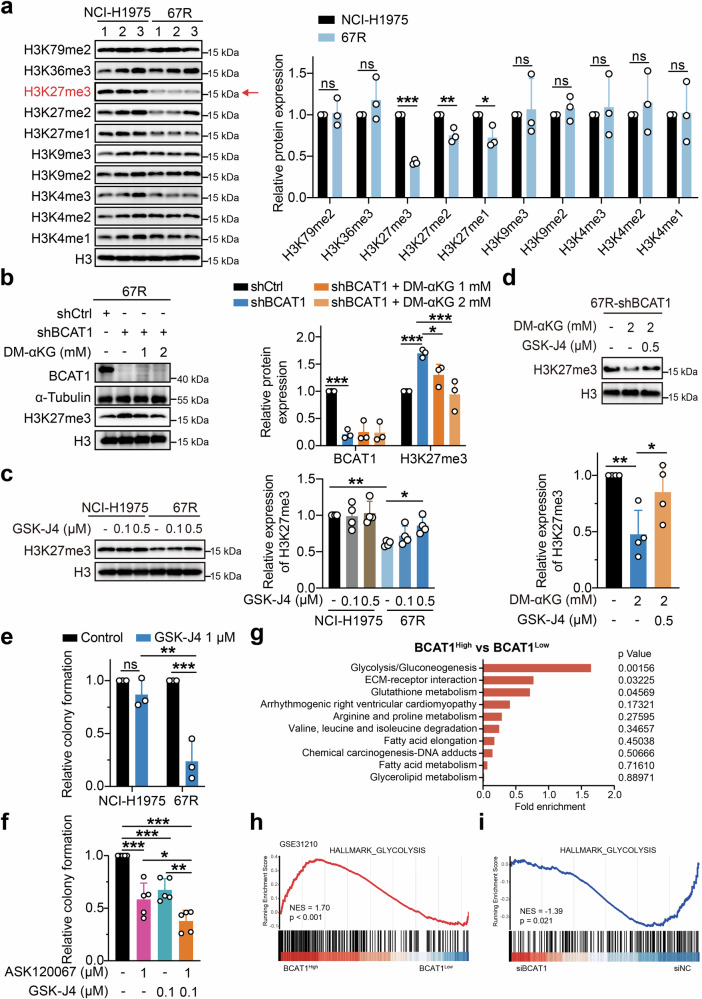
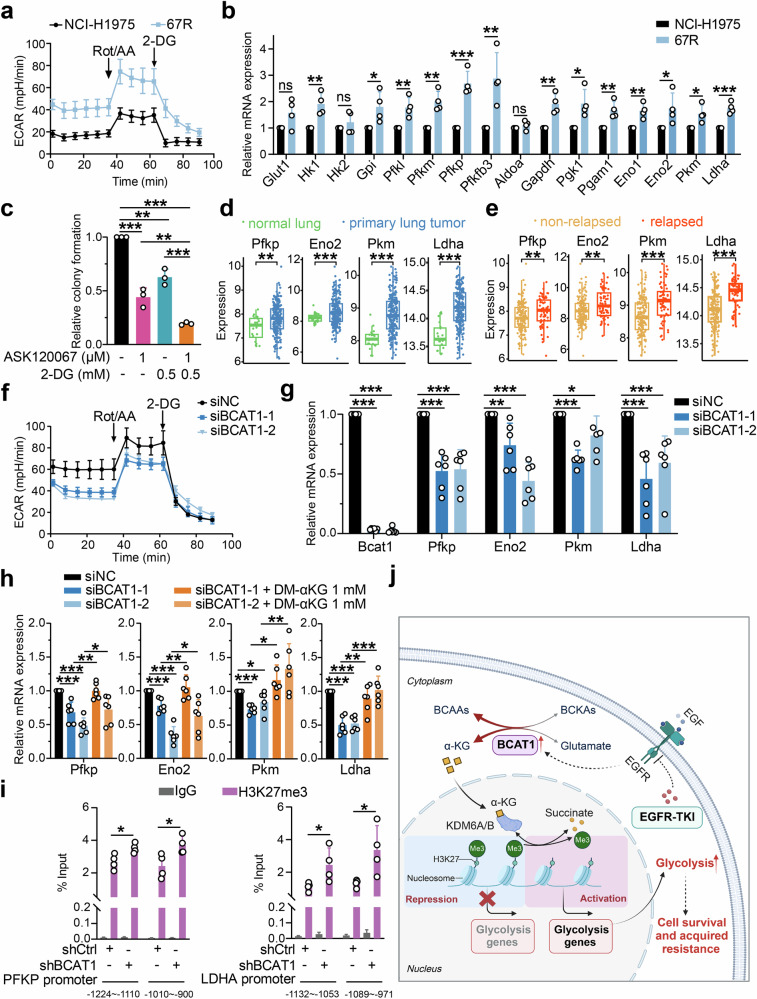
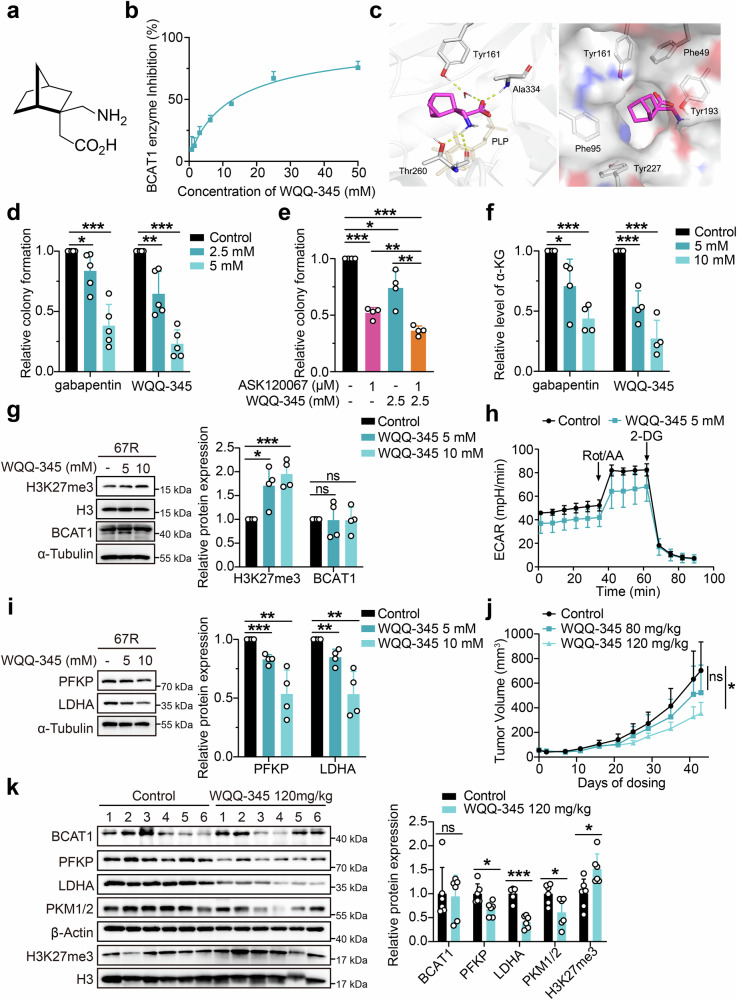
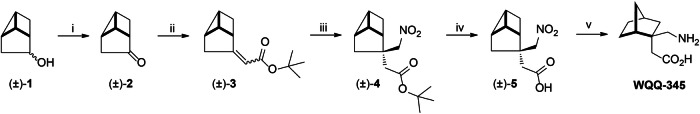
Third-generation EGFR tyrosine kinase inhibitors (TKIs), exemplified by osimertinib, have demonstrated promising clinical efficacy in the treatment of non-small cell lung cancer (NSCLC). Our previous work has identified ASK120067 as a novel third-generation EGFR TKI with remarkable antitumor effects that has undergone New Drug Application (NDA) submission in China. Despite substantial progress, acquired resistance to EGFR-TKIs remains a significant challenge, impeding the long-term effectiveness of therapeutic approaches. In this study, we conducted a comprehensive investigation utilizing high-throughput proteomics analysis on established TKI-resistant tumor models, and found a notable upregulation of branched-chain amino acid transaminase 1 (BCAT1) expression in both osimertinib- and ASK120067-resistant tumors compared with the parental TKI-sensitive NSCLC tumors. Genetic depletion or pharmacological inhibition of BCAT1 impaired the growth of resistant cells and partially re-sensitized tumor cells to EGFR TKIs. Mechanistically, upregulated BCAT1 in resistant cells reprogrammed branched-chain amino acid (BCAA) metabolism and promoted alpha ketoglutarate (α-KG)-dependent demethylation of lysine 27 on histone H3 (H3K27) and subsequent transcriptional derepression of glycolysis-related genes, thereby enhancing glycolysis and promoting tumor progression. Moreover, we identified WQQ-345 as a novel BCAT1 inhibitor exhibiting antitumor activity both in vitro and in vivo against TKI-resistant lung cancer with high BCAT1 expression. In summary, our study highlighted the crucial role of BCAT1 in mediating resistance to third-generation EGFR-TKIs through epigenetic activation of glycolysis in NSCLC, thereby supporting BCAT1 as a promising therapeutic target for the treatment of TKI-resistant NSCLC.


Conflict of interest statement

The authors declare no competing interests.

Figures

Fig. 1
Fig. 1
Discovery and validation of enhanced expression of BCAT1 in TKI-resistant lung cancer. a Workflow of the SILAC assay to identify differentially expressed proteins between third-generation EGFR TKI-resistant clones and parental cells. Ribbon representation of the experimental structure of BCAT1 (PDB ID 7NTR) is shown on the right. b Common differentially expressed proteins in both ASK120067-resistant strains (67R) and osimertinib-resistant strains (AZDR). Red dots: up-regulated overlapping proteins; blue dots: down-regulated overlapping proteins. c Pathway enrichment analysis of differentially expressed overlapping proteins in TKI-resistant cells compared to the parental cells. The top 10 enriched pathways in TKI-resistant cells versus parental NCI-H1975 cells are shown. d Diagram of BCAT-catalyzed reversible BCAAs metabolism. e, f BCAT1 protein levels and relative mRNA levels (n = 5) in the indicated tumor cells were determined by Western blot assay (e) and RT‒qPCR (f). g BCAT1 expression levels in the indicated tumor tissues were determined by Western blot assay (n = 5) and are shown as representative images (left) and a quantitative graph (right). *p < 0.05, **p < 0.01, ***p < 0.001. Data are expressed as the mean ± SD
Fig. 2
Fig. 2
Clinical implications of BCAT1 expression in lung cancer. a Comparison of BCAT1 gene expression in normal lung tissue and primary lung adenocarcinoma tumors (left) or in tumor tissues from non-relapsed- and relapsed lung cancer patients (right) in the GSE31210 dataset, which contains 226 patients with primary stage I-II lung adenocarcinomas and 20 normal lung tissues. b Relapse-free survival probability of two groups of lung cancer patients classified by BCAT1 median expression levels in the GSE31210 dataset. c Comparison of BCAT1 gene expression in tumors from TKI-sensitive- and TKI-resistant NSCLC patients in the GSE231938 dataset. d IHC staining of BCAT1 in lung cancer tissues, adjacent noncancerous tissues and osimertinib-resistant tumors (n = 4). Results are shown as representative images and quantitative graphs. *p < 0.05, ***p < 0.001. Data are expressed as the mean ± SD
Fig. 3
Fig. 3
BCAT1 sustained cell survival and conferred drug resistance to third-generation EGFR TKIs. a, b Colony formation of 67R (n = 4) (a) or AZDR (n = 3) (b) cells with or without BCAT1 knockdown was measured. c, d, e The anti-growth effects of gabapentin in 67R (c), AZDR (d) and NCI-H1975 (e) cells were assessed by colony formation assay (n = 5). f, g Effects of combination therapy on cellular growth in 67R (f) or AZDR (g) cells were evaluated. All the above colony formation results are shown as representative images and quantitative graphs (n = 5). h Effects of gabapentin in combination with EGFR TKI in 67R cells were assessed using Sulforhodamine B assay and showed as dose-response matrix (left) and synergy score matrix (right). i, j In vivo tumor growth of control 67R (shCtrl) tumors and BCAT1-knockdown 67R (shBCAT1, same as shBCAT1-1) tumors. Equal numbers of cells (107 cells/mouse) were subcutaneously injected into the right flank of BALB/c nude mice. Mice were sacrificed 58 days after grafting, and the tumor formation proportion (i), tumor weight (j) were evaluated or showed (n = 17 for shCtrl group, n = 20 for shBCAT1 group). k Tumor growth inhibition (TGI) effects of ASK120067 (oral administration, 1 mg/kg or 2.5 mg/kg, once daily) for 63 days in control 67R (shCtrl) and BCAT1-knockdown 67R (shBCAT1) tumor models were evaluated. **p < 0.01, ***p < 0.001; ns, not significant. Data are expressed as the mean ± SD
Fig. 4
Fig. 4
Increased α-KG production was involved in BCAT1-mediated cell growth and resistance. a Schematic outline of BCAT1-mediated reversible transamination and isotope tracing experiment. b Ratios of the labeled metabolites in control 67R cells (shCtrl) and BCAT1-knockdown 67R cells (shBCAT1) (n = 4). c Comparison of intracellular BCAA levels and α-KG levels in NCI-H1975 and 67R cells (n = 3). d, e Effects of BCAT1 knockdown (d) or the BCAT1 inhibitor gabapentin (e) on cellular BCAA levels and αKG levels in 67R cells (n = 3). f Colony formation of 67R cells upon dimethyl-KG (DM-αKG), gabapentin or combination treatment was evaluated and shown as representative images and a quantitative graph (n = 3). g Cell viability of 67R cells upon dimethyl-KG (DM-αKG), gabapentin or combination treatment was evaluated using SRB colorimetric assay (n = 4). h Anti-proliferation effects of gabapentin and ASK120067 with DM-αKG supplementation on 67R cells were detected using SRB colorimetric assay, and showed as dose-response matrix (left) and synergy score matrix (right). Synergy scores were calculated by SynergyFinder using Bliss model. *p < 0.05, **p < 0.01, ***p < 0.001; ns, not significant. Data are expressed as the mean ± SD
Fig. 5
Fig. 5
BCAT1 promoted α-KG-dependent H3K27 demethylation in resistant cells. a The indicated histone methylation levels in NCI-H1975 cells and 67R cells were determined using Western blotting and are shown as representative images (left) and densitometric quantitative results (right) (n = 3). b The effects of BCAT1 knockdown and cell-permeable dimethyl-αKG (DM-αKG) supplementation on H3K27me3 expression in 67R cells were detected by Western blotting and are shown as representative images (left) and a quantitative graph (right). Cells were treated with the indicated agent for 24 h (n = 3). shCtrl: 67R-shControl; shBCAT1: 67R-shBCAT1. c NCI-H1975 cells and 67R cells were treated with the indicated doses of GSK-J4 for 48 h, and the protein levels of H3K27me3 were determined by Western blot assay (n = 4). Representative images (left) and quantification results (right) are shown. d The effects of α-KG and GSK-J4 on H3K27me3 levels in BCAT1-knockdown 67R (shBCAT1) cells were determined. Cells were treated with 2 mM DM-αKG for 24 h and/or 0.5 µM GSK-J4 for 48 h (n = 4). Representative immunoblotting images (top) and quantitative graphs (bottom) are shown. e The anti-growth effects of GSK-J4 in NCI-H1975 or 67R cells were detected using a colony formation assay (n = 3). f Relative colony formation of 67R upon ASK120067, GSK-J4, or drug combination treatment (n = 5). g KEGG pathway enrichment analysis of pathways presented in Fig. 1c for BCAT1-high expression samples versus BCAT1-low expression samples from the clinical dataset GSE31210. The samples of the dataset were stratified based on high versus low expression (cutoff, median) of BCAT1 mRNA in lung adenocarcinoma tumors. h Gene set enrichment analysis (GSEA) showed that the glycolysis pathway was enriched in the BCAT1 high expression phenotype of the clinical dataset GSE31210. i BCAT1-knockdown 67R (siBCAT1) cells and control 67R (siNC) cells were subjected to transcriptomic analysis, and GSEA demonstrated downregulation of the glycolysis pathway in siBCAT1 cells. *p < 0.05, **p < 0.01, ***p < 0.001; ns, not significant. Data are expressed as the mean ± SD
Fig. 6
Fig. 6
BCAT1 mediated drug resistance by transcriptional activation of glycolysis through α-KG-dependent H3K27 demethylation. a Extracellular acidification rates (ECARs) of NCI-H1975 and 67R cells were detected by a Seahorse XF Analyzer. Rot/AA rotenone and antimycin A, 2-DG 2-Deoxy-d-glucose. b Relative mRNA levels of glycolytic enzymes in NCI-H1975 and 67R cells were evaluated by RT-qPCR assay (n = 4). c Quantification of relative colony formation of 67R cells upon ASK120067, 2-DG or combination therapy (n = 3). d, e Comparison of glycolysis genes expression in normal lung tissue and primary lung adenocarcinoma tumors (d) or in tumor tissues from non-relapsed and relapsed lung adenocarcinoma patients (e) in the GSE31210 dataset. f ECAR analysis of control 67R cells (siNC) and BCAT1-knockdown 67R cells (siBCAT1). g Relative mRNA levels of the indicated glycolysis-related genes in 67R siNC and 67R siBCAT1 cells were determined by RT-qPCR (n = 6). h The effects of BCAT1 knockdown and α-KG supplementation on the transcriptional expression of the indicated glycolysis-related genes in 67R. Cells were treated with/without DM-αKG for 24 h before mRNA extraction and RT-qPCR (n = 6). i ChIP-qPCR analysis of H3K27me3 abundance at the promoters of PFKP (p1, −1224~−1110; p2, −1010~−900) and LDHA (p1, −1132~−1053; p2, −1089~−971) in NC and shBCAT1 67R cells (n = 4). j Schematic model of BCAT1-mediated EGFR-TKI resistance through α-KG-dependent epigenetic activation of glycolysis. This figure is created with BioRender.com. *p < 0.05, **p < 0.01, ***p < 0.001; ns, not significant. Data are expressed as the mean ± SD
Fig. 7
Fig. 7
WQQ-345 was identified as a novel BCAT1 inhibitor with antitumor potency. a Chemical structure of WQQ-345. b Enzyme-inhibition effects of WQQ-345 on recombinant human BCAT1 protein. c Binding model of WQQ-345 with BCAT1. Left panel shows WQQ-345 (magenta sticks) bound at the active site of BCAT1. The cofactor PLP was depicted in orange. Right panel shows surface representation of BCAT1 (gray surface) with WQQ-345 (magenta sticks). d Colony formation assays were performed to examine the growth of 67R cells treated with gabapentin or WQQ-345 (n = 5). e Quantification of relative colony formation of 67R cells treated with vehicle control, ASK120067, WQQ-345 and drug combination (n = 4). f Quantification of α-KG levels in 67R cells treated with vehicle control, gabapentin or WQQ-345 for 3 days (n = 4). g Western blot analysis of the expression of BCAT1 and H3K27me3 in 67R cells upon WQQ-345 treatment for 3 days. Data are shown as representative images (left) and a quantitative graph (right) (n = 4). h ECAR analysis of 67R cells with or without WQQ-345 treatment for 3 days. i Western blot analysis of the expression of indicated glycolytic enzymes in 67R cells upon WQQ-345 treatment for 3 days. The results are shown as representative images (left) and a quantitative graph (right) (n = 4). j The in vivo antitumor activity of WQQ-345 was evaluated in a 67R xenograft tumor model. 67R tumor-bearing mice were given oral treatments of PBS control or WQQ-345 twice daily for 43 days, and tumor volume was monitored. k The expression of BCAT1, H3K27me3 and indicated glycolysis related enzymes in 67R xenograft tumors at the endpoint of drug treatment was assessed by Western blot assay and shown as representative images (left) and a quantitative graph (right) (n = 6). *p < 0.05, **p < 0.01, ***p < 0.001; ns, not significant. Data in (j) are expressed as the mean ± SEM, and other data are expressed as the mean ± SD
Scheme 1
Scheme 1
Synthetic route to WQQ-345. Reagents and Conditions: (i) DMSO/(COCl)2, (±)−1, dried CH2Cl2, −78 °C, then Et3N, −78 °C-rt; (ii) t-BuOK, (Et2O)2P( = O)CH2CO2But, dried THF, N2, ice-water bath to rt; (iii) DBU, CH3NO2, 80 °C-85 °C; (iv) aq NaOH, EtOH, reflux; (v) H2, Pd(OH)2, MeOH, rt

References

    1. Tian, P. et al. High-throughput sequencing reveals distinct genetic features and clinical implications of NSCLC with de novo and acquired EGFR T790M mutation. Lung Cancer124, 205–210 (2018). 10.1016/j.lungcan.2018.08.014 - DOI - PubMed
    1. Leonetti, A. et al. Resistance mechanisms to osimertinib in EGFR-mutated non-small cell lung cancer. Br. J. Cancer.121, 725–737 (2019). 10.1038/s41416-019-0573-8 - DOI - PMC - PubMed
    1. Zhang, T. et al. Discovery of a novel third-generation EGFR inhibitor and identification of a potential combination strategy to overcome resistance. Mol. Cancer.19, 90 (2020). 10.1186/s12943-020-01202-9 - DOI - PMC - PubMed
    1. Pan, Z. et al. Cholesterol promotes EGFR-TKIs resistance in NSCLC by inducing EGFR/Src/Erk/SP1 signaling-mediated ERRα re-expression. Mol. Cancer.21, 77 (2022). 10.1186/s12943-022-01547-3 - DOI - PMC - PubMed
    1. Piper-Vallillo, A. J., Sequist, L. V. & Piotrowska, Z. Emerging treatment paradigms for EGFR-mutant lung cancers progressing on osimertinib: a review. J. Clin. Oncol.38, 2926–2936 (2020).10.1200/JCO.19.03123 - DOI - PubMed

Publication types

MeSH terms