. 2024 Aug 14;15(1):6982.
doi: 10.1038/s41467-024-51443-1.

Theta-burst direct electrical stimulation remodels human brain networks

Affiliations

Theta-burst direct electrical stimulation remodels human brain networks

Yuhao Huang et al. Nat Commun. .

Abstract

Theta-burst stimulation (TBS), a patterned brain stimulation technique that mimics rhythmic bursts of 3-8 Hz endogenous brain rhythms, has emerged as a promising therapeutic approach for treating a wide range of brain disorders, though the neural mechanism of TBS action remains poorly understood. We investigated the neural effects of TBS using intracranial EEG (iEEG) in 10 pre-surgical epilepsy participants undergoing intracranial monitoring. Here we show that individual bursts of direct electrical TBS at 29 frontal and temporal sites evoked strong neural responses spanning broad cortical regions. These responses exhibited dynamic local field potential voltage changes over the course of stimulation presentations, including either increasing or decreasing responses, suggestive of short-term plasticity. Stronger stimulation augmented the mean TBS response amplitude and spread with more recording sites demonstrating short-term plasticity. TBS responses were stimulation site-specific with stronger TBS responses observed in regions with strong baseline stimulation effective (cortico-cortical evoked potentials) and functional (low frequency phase locking) connectivity. Further, we could use these measures to predict stable and varying (e.g. short-term plasticity) TBS response locations. Future work may integrate pre-treatment connectivity alongside other biophysical factors to personalize stimulation parameters, thereby optimizing induction of neuroplasticity within disease-relevant brain networks.


Conflict of interest statement

None of the authors have conflicts of interest to disclose in relationship with the current work.

Figures
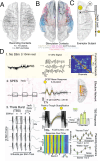
Fig. 1
Fig. 1. Experimental paradigm and analysis procedure.
A 10 participants were enrolled with a combined total of 4567 bipolar-referenced channels. B Stimulation sites were selected across cortical regions including the anterior cingulate (ACC, 5 sites), the postcentral gyrus (1 site), the dorsolateral prefrontal cortex (DLPFC, 4 sites), the orbitofrontal cortex (OFC, 2 sites), the ventrolateral prefrontal cortex (10 sites), the insular cortex (2 sites), and the lateral temporal cortex (5 sites). C Trials of single pulse electrical stimulation (SPES) and theta-burst stimulation (TBS) were delivered at specific sites during each experimental session, while continuous iEEG was obtained at all other channels. D Schematic representation of analyzes performed. Resting iEEG data (3–10 min) prior to stimulation was used to construct a functional network using low-frequency amplitude and phase coupling. From SPES, cortical-cortical evoked potential (CCEP) mean and duration were quantified through parameterization to estimate stimulation-induced effective connectivity. Lastly, theta burst stimulation (TBS) consisted of ~4 min of 10 stimulation trains, with each train consisting of five theta-frequency bursts, separated by 20 s. Stimulation amplitude was applied first at 1 mA and then at 2 mA sequentially. TBS mean response was defined as the peak-to-trough response post-burst across all bursts (N = 50 bursts). Channels with TBS mean post-burst response above noise threshold are considered significant (TBS + ). In TBS+ channels, successive post-burst responses are analyzed with reference to the train number or the burst number. Repeated-measures ANOVA was used to determine if there was a significant burst number effect (within train plasticity) or a significant train number effect (across train plasticity). Figures in D are for visualization and schematic purposes only. Error bars represent +/- SEM.
Fig. 2
Fig. 2. Theta-burst stimulation evokes consistent neural responses that are modulated over time.
A, B Single trials and mean voltage trace in a TBS+ channel of (A) a train and (B) a single burst. The yellow shaded region denotes the post-burst quantification window. C Peak-to-trough quantification of the response time window in baseline and post-burst conditions (n = 50 bursts; two-sided two-sample T-test). D, E, F Same as AC but for a TBS– channel. G Among aggregate of all channels across 10 participants, 1233/8540 (14.4%) of channels were TBS + . H Mean voltage trace of a train of bursts (collapsed across trains) in a TBS+ channel exhibiting within train plasticity. Bursts 1 to 5 are highlighted in different colors. I Mean voltage trace of different bursts within the train. Note in this channel successive bursts qualitatively are larger than the first burst. J ANOVA testing of mean response across five bursts showing within train plasticity (n = 10 trains per burst; two-sided repeated measures ANOVA). K Single-trial voltage traces and (L) mean voltage trace of the post-burst response across trains (collapsed across all bursts in a train). M Mean response across ten burst trains showing across train plasticity (n = 5 bursts per train; two-sided repeated measures ANOVA). N Among the 1233 TBS+ channels, 239 (19.4%) exhibited across train plasticity, 65 (5.2%) within train response plasticity, and 31 (2.5%) both types of plasticity. Error bars represent +/− SEM. For all panels, *denotes P < 0.05. **denotes P < 0.01, ***denotes P < 0.001.
Fig. 3
Fig. 3. Post-burst responses exhibit diverse patterns including response facilitation and habituation.
A K-means clusters of within-train post-burst responses (n = 65 channels with significant within-train responses). Cluster 1 showed an increasing post-burst response, cluster 2 a decrease in post-burst response, cluster 3 an initial increase and subsequent decrease. B Amongst channels with significant within-train plasticity, 60% were in cluster 1, 26% in cluster 2 and 18% in cluster 3. C K-means clustering criterion did not converge at an optimal cluster number for across-train plasticity dynamics. Up-trending and down-trending post-burst responses were identified by comparing the first two trains and the last two trains (n = 239 channels with significant across-train responses). D 21% of channels with plasticity had a positive trend, 13% had a negative trend, and 66% had a trend that did not differ in initial and final post-burst responses. Error bars reflect the standard error of the mean.
Fig. 4
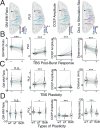
Fig. 4. Theta-burst stimulation responses are dependent on stimulation dose.
A Location of the stimulating and recording channels for BE. B Mean voltage trace of the post-burst response for 1 mA and 2 mA stimulation (n = 50 bursts per current). C Post-burst response was significantly different between 1 mA and 2 mA stimulation (n = 10 trains per burst; two-sided two-sample T-test). D Mean response across five bursts with significant across burst plasticity noted only for the 2 mA condition (n = 5 bursts per train; two-sided repeated measures ANOVA). E Mean response across ten stimulation trains. For each train, the five bursts are collapsed. Significant across-train plasticity is noted for the 2 mA condition (two-sided repeated measures ANOVA). Error bars represent +/− SEM. For all panels, *denotes P < 0.05. **denotes P < 0.01, ***denotes P < 0.001.
Fig. 5
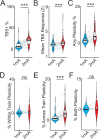
Fig. 5. Dose-dependent effects of theta-burst stimulation on a group level.
A Proportion of TBS+ channels was significantly higher in the 2 mA but not the 1 mA condition. Each line represents a stimulation session, while each color represents a different participant (n = 29 matched sessions, two-sided signed rank test, applies to AF). The higher mean post-burst response across channels B and higher proportion of TBS+ channels C with 2 mA stimulation, D Proportion of channels showing within train plasticity was not different between 1 mA and 2 mA stimulation conditions but E proportion of channels showing across train plasticity was significantly higher. F Proportion of channels showing both types of plasticity were not different between 1 mA and 2 mA stimulation conditions. For all boxplots, the center is the median, the box is the interquartile interval (25 and 75 percentile), and the whiskers extend from the box to either the 2.5 percentile or the 97.5 percentile. For all panels, *denotes P < 0.05. **denotes P < 0.01, ***denotes P < 0.001.
Fig. 6
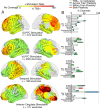
Fig. 6. Spatial specificity of theta-burst stimulation response and plasticity by stimulation site.
A Surface heatmap and bar chart B showing the percentage of TBS+ local channels for a particular stimulation site within an anatomical region (gray), within train response plasticity (blue), across train plasticity (green) and both types of plasticity (red). The top three sites for each stimulation location are noted with an asterisk (*). Note reciprocal responses in the DLPFC and ACC when stimulated. ACC stimulation elicits widespread TBS responses. DLPFC: dorsolateral prefrontal cortex; VLPFC: ventrolateral prefrontal cortex; VMPFC: ventromedial prefrontal cortex; OFC: orbitofrontal cortex; ACC: anterior cingulate cortex; PCC: posterior cingulate cortex.
Fig. 7
Fig. 7. Baseline structural, resting, and effective connectivity characteristics underlying TBS-evoked responses and plasticity.
A Exemplar brains from a participant depicting variations in four baseline characteristics: (1) gray matter to white matter proximity ratio for a given channel in log-scale, (2) phase locking value (PLV) to the stimulation site for a given channel, (3) CCEP amplitude for a given channel and (4) Euclidean distance to the stimulation site for a given channel. B Differences in baseline characteristics in channels with and without significant TBS response (n = 63 total stimulation sessions in both groups; two-sided signed rank test). C Differences in baseline characteristics in channels with and without response plasticity (n = 60 stimulation sessions with any plasticity responses; two-sided signed rank test). D Differences in baseline characteristics in channels with different types of response plasticity (n = 18 stimulation sessions with any within-train response; n = 48 stimulation sessions with any across-train response; n = 18 stimulation sessions with both types of responses; two-sided signed rank test). Significant differences were observed for PLV, CCEP amplitude and distance to stimulation site, but not for gray matter to white matter proximity ratio. Each line represents a stimulation session, while each color represents a different participant. For all boxplots, the center is the median, the box is the interquartile interval (25 and 75 percentile), and the whiskers extend from the box to either the 2.5 percentile or the 97.5 percentile. For all panels, *denotes P < 0.05. **denotes P < 0.01, ***denotes P < 0.001.
Fig. 8
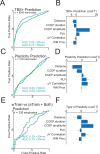
Fig. 8. Structural, resting and effective connectivity at rest predict sites of TBS-evoked responses and plasticity.
A Receiver Operating Characteristic (ROC) curves derived from baseline characteristics used to predict presence of a significant TBS post-burst response at a given channel. The curves are further stratified by channels either closer than or further from 30 mm of the stimulation site. B The mean T-statistic for baseline features used in models to construct the ROC curves. Note CCEP amplitude is the most significant predictor for TBS+ channels (n = 20 model runs, 10-fold cross-validation per each distance cutoff). C ROC curves for prediction of plasticity using only TBS+ channels. D The mean T-statistic for baseline features used in models to construct the ROC curves. Note distance to the stimulation site is the most significant predictor for channels with plasticity (n = 20 model runs, 10-fold cross-validation per each distance cutoff). E ROC curves for prediction of types of plasticity using only channels that demonstrated plasticity. F The mean T-statistic for baseline features used in models to construct the ROC curves. Note CCEP amplitude is the most significant predictor for type of plasticity (n = 20 model runs, 10-fold cross-validation per each distance cutoff). Error bars represent +/− SEM.

References

    1. McClintock, S. M. et al. Consensus Recommendations for the Clinical Application of Repetitive Transcranial Magnetic Stimulation (rTMS) in the Treatment of Depression. The Journal of Clinical Psychiatry vol. 79 (2018). - PMC - PubMed
    1. Carpenter, L. L. et al. Transcranial magnetic stimulation (TMS) for major depression: a multisite, naturalistic, observational study of acute treatment outcomes in clinical practice. Depress Anxiety29, 587–596 (2012). 10.1002/da.21969 - DOI - PubMed
    1. Janicak, P. G. et al. Transcranial magnetic stimulation (TMS) for major depression: a multisite, naturalistic, observational study of quality of life outcome measures in clinical practice. CNS Spectr.18, 322–332 (2013). 10.1017/S1092852913000357 - DOI - PubMed
    1. Hoyer, E. H. & Celnik, P. A. Understanding and enhancing motor recovery after stroke using transcranial magnetic stimulation. Restor. Neurol. Neurosci.29, 395–409 (2011). - PMC - PubMed
    1. George, M. S. et al. Daily repetitive transcranial magnetic stimulation (rTMS) improves mood in depression. Neuroreport6, 1853–1856 (1995). 10.1097/00001756-199510020-00008 - DOI - PubMed

LinkOut - more resources