. 2024 Aug 14;9(1):148.
doi: 10.1038/s41541-024-00931-y.

Crimean Congo hemorrhagic fever virus nucleoprotein and GP38 subunit vaccine combination prevents morbidity in mice

Affiliations

Crimean Congo hemorrhagic fever virus nucleoprotein and GP38 subunit vaccine combination prevents morbidity in mice

Elif Karaaslan et al. NPJ Vaccines. .

Abstract

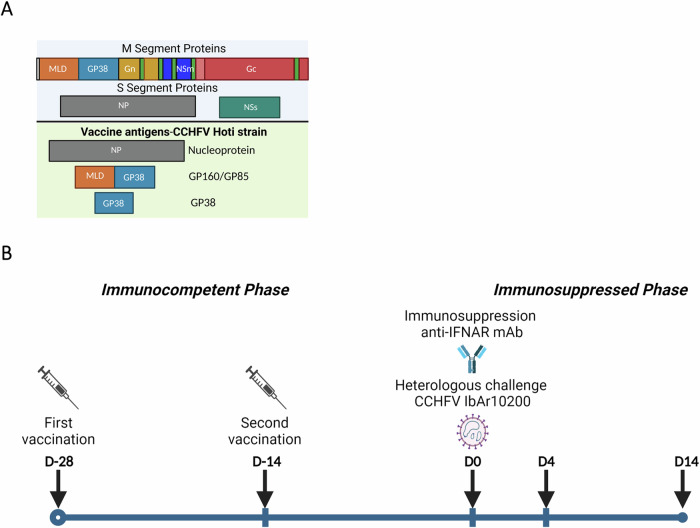
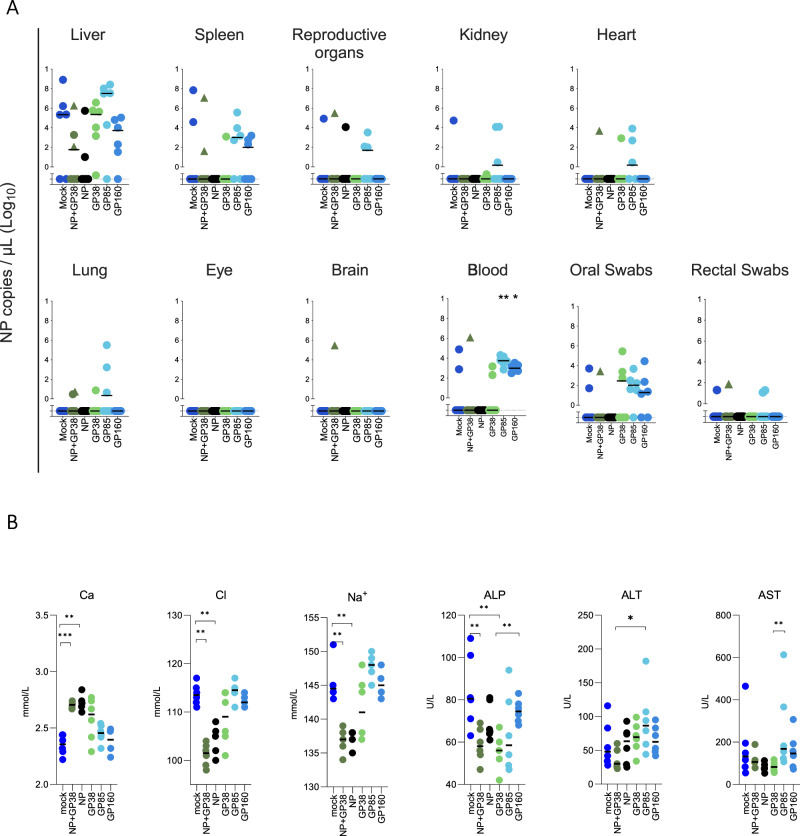
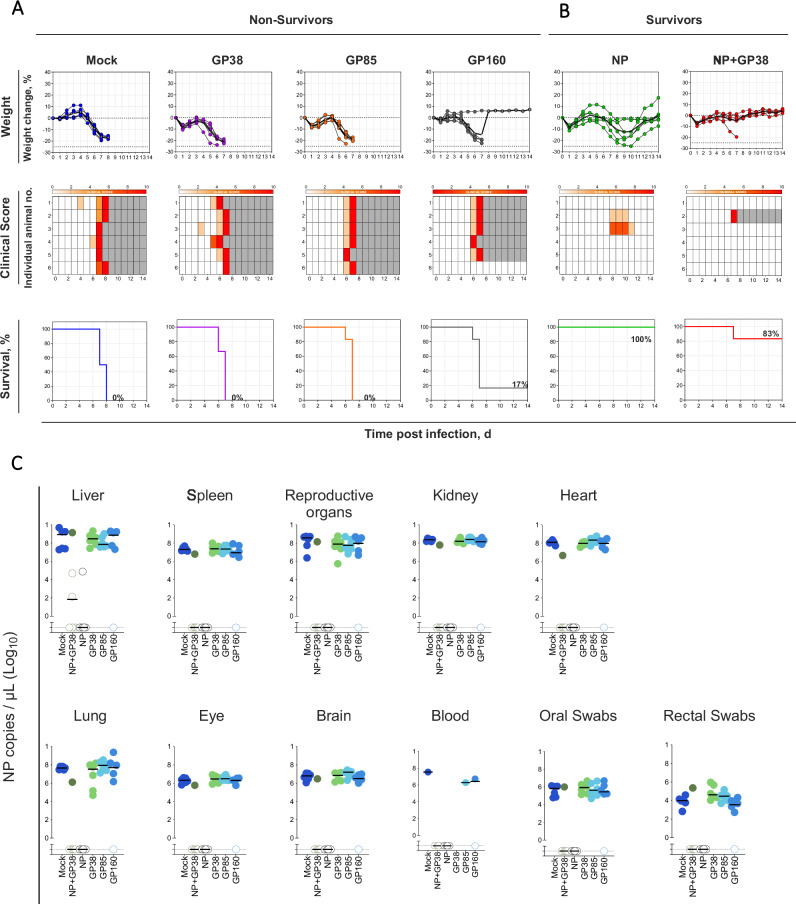
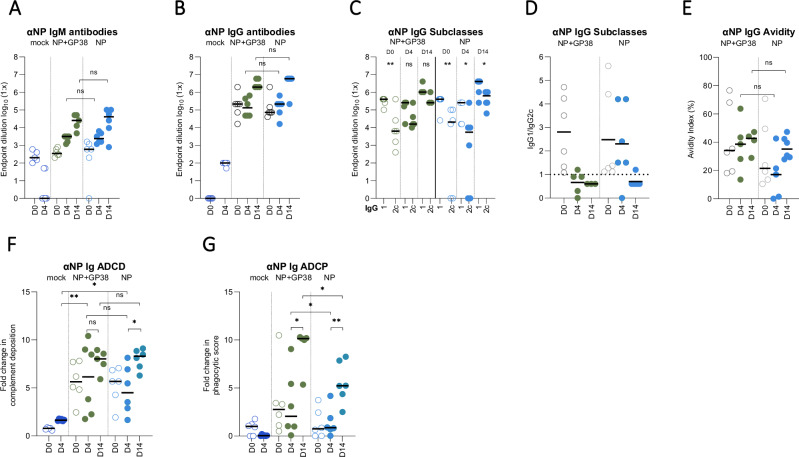
Immunizing mice with Crimean-Congo hemorrhagic fever virus (CCHFV) nucleoprotein (NP), glycoprotein precursor (GPC), or with the GP38 domain of GPC, can be protective when the proteins are delivered with viral vectors or as a DNA or RNA vaccine. Subunit vaccines are a safe and cost-effective alternative to some vaccine platforms, but Gc and Gn glycoprotein subunit vaccines for CCHFV fail to protect despite eliciting high levels of neutralizing antibodies. Here, we investigated humoral and cellular immune responses and the protective efficacy of recombinant NP, GP38, and GP38 forms (GP85 and GP160) associated with the highly glycosylated mucin-like (MLD) domain, as well as the NP + GP38 combination. Vaccination with GP160, GP85, or GP38 did not confer protection, and vaccination with the MLD-associated GP38 forms blunted the humoral immune responses to GP38, worsened clinical chemistry, and increased viral RNA in the blood compared to the GP38 vaccination. In contrast, NP vaccination conferred 100% protection from lethal outcome and was associated with mild clinical disease, while the NP + GP38 combination conferred even more robust protection by reducing morbidity compared to mice receiving NP alone. Thus, recombinant CCHFV NP alone is a promising vaccine candidate conferring 100% survival against heterologous challenge. Moreover, incorporation of GP38 should be considered as it further enhances subunit vaccine efficacy by reducing morbidity in surviving animals.


Conflict of interest statement

The authors declare no competing interests.

Figures

Fig. 1
Fig. 1. Vaccine antigens and study timeline.
A Schematic representation of CCHFV proteins encoded from S and M segments. Transmembrane domains indicated in green; signal peptide indicated in white. The second half of the figure shows the CCHFV proteins used in this study as vaccine antigens. Protein sequences were derived from CCHFV Hoti strain (accession numbers: S segment DQ133507.1; M segment EU037902.1). B Timeline showing vaccination, immunosuppression, and challenge schedule. Groups of 6 mice were vaccinated subcutaneously with NP + GP38, NP, GP38, GP85, or GP160. For pre-challenge studies, groups of mice were euthanized 14 days after their vaccination (on D14). Another group received two vaccinations with a two-week interval and was euthanized 14 days after the second vaccination (on D0). For post-challenge studies, animals received two vaccinations two weeks apart. Fourteen days after their second vaccination, animals were immunosuppressed with anti-interferon alpha/beta receptor subunit 1 monoclonal antibody (anti-IFNAR-1 mAb) MAR1-5A3 intraperitoneally before being subcutaneously challenged with 1000 TCID50 of recombinant CCHFV IbAr10200 on D0. One group of mice was euthanized on D4 to evaluate immune responses, disease progression, and virus spread. Another group was monitored for 14 days to evaluate protective efficacy of the vaccines; survivors were euthanized on D14. Graphical illustrations were prepared with BioRender (www.biorender.com).
Fig. 2
Fig. 2. Humoral immune responses after the first and second vaccinations.
NP- and GP38-specific IgM (A, F) and IgG (B, G) responses after the first and second vaccinations were determined as endpoint titers in plasma samples. Anti-NP C and anti-GP38 H IgG1 and IgG2c titers were determined as endpoint titers in plasma samples. The IgG1 to IgG2c ratios were determined by dividing the endpoint titers of IgG1 to IgG2 of individual animals and presented in D for anti-NP antibodies and in I for anti-GP38 antibodies. The dotted horizontal line represents IgG1 to IgG2c ratio = 1. The avidity indices of anti-NP E and anti-GP38 J antibodies from vaccinated animals after the first and second vaccinations were determined. For the avidity of IgG antibodies, areas under the curves (AUC) of 7-point dilutions of urea-treated and untreated samples were determined and the avidity index calculated as follows: (AUC of the urea-treated sample/AUC of untreated sample) × 100. Each dot represents the mean value of the replicates from each animal and the horizontal line represents the median value for the group. All samples were tested in duplicate. Two-tailed nonparametric t tests and ordinary one-way ANOVA (*p < 0.05; **p < 0.001; ***p < 0.0003) were used for statistical analyses when applicable. Statistical analyses compared IgM and IgG titers from each vaccine group with those of the mock-vaccinated animals at corresponding timepoints. For IgG subclasses, statistical analyses compared IgG1 and IgG2 titers of individual vaccine groups after the first and second vaccination. For IgG avidity determination, statistical analyses were performed with IgG titers after first and second vaccinations.
Fig. 3
Fig. 3. Fc-mediated functions of anti-NP and anti-GP38 antibodies following vaccination.
Fc-mediated functions of anti-NP and anti-GP38 antibodies were investigated after first and second vaccinations. ADCD function of anti-NP A and anti-GP38 C antibodies are represented as the fold change in complement deposition over mock-vaccinated group. ADCP function of anti-NP B and anti-GP38 D antibodies represented as fold change in phagocytic score over mock-vaccinated animals. Each dot represents the mean value of the replicates from each animal and the horizontal line represents the median. Two-tailed nonparametric t tests and ordinary one-way ANOVA (*p < 0.05; **p < 0.001; ***p < 0.0003) were used for statistical analyses when applicable. Statistical analyses compare vaccine groups and mock-vaccinated animals at corresponding timepoints.
Fig. 4
Fig. 4. Cellular immune responses after vaccination.
Cellular immune responses were investigated using peptide libraries of CCHFV 10200 NP and Hoti MLD-GP38. IFN-gamma recall responses detected from splenocytes of mice to A NP and B MLD-GP38 peptide libraries. In each graph, the left panel shows responses following the first vaccination, and the right panel shows responses following the second vaccination; data are represented as number of spot-forming cells (SFCs) in 106 peptide-stimulated splenocytes. All samples were tested in duplicate, and results were normalized to PMA control of each sample. Horizontal line represents the median value for the group. Two-tailed nonparametric t tests and ordinary one-way ANOVA (**p < 0.001; ***p < 0.0003) were used for statistical analyses when applicable. Statistical analyses compare vaccine groups and mock-vaccinated animals at corresponding timepoints.
Fig. 5
Fig. 5. Viral RNA levels and clinical chemistry of vaccinated animals 4 days after challenge with lethal dose of CCHFV.
After second vaccination, animals were immunosuppressed and challenged subcutaneously with a lethal dose of CCHFV IbAr10200. Four days after challenge, 6 animals from each vaccine group were euthanized and viral RNA levels and clinical chemistry parameters were analyzed. A Viral RNA levels in liver, spleen, reproductive organs, kidney, heart, lung, eye, brain, blood, and oral and rectal swabs were determined. Closed triangles represent the two animals in this group that showed liver and spleen pathology similar to mock- vaccinated animals. B Levels of calcium (Ca), chloride (Cl), sodium (Na+), alkaline phosphatase (ALP), alanine transaminase (ALT), and aspartate aminotransferase (AST) were determined from whole blood within 1 h of collection and represented as mg/dL (CA), mmol/L (Cl, Na+) or U/L (ALP, ALT, AST). Horizontal line represents the median value for the group. Multiple comparisons were performed using a two-way ANOVA. p values were adjusted for multiple comparisons using the two-stage linear set-up procedure of Benjamini, Krieger, and Yekutieli (*p < 0.05; **p < 0.001; ***p < 0.0003).
Fig. 6
Fig. 6. Vaccination with NP and NP + GP38 protects mice from challenge with a lethal dose of CCHFV.
Two weeks after the second vaccination, animals were challenged with a lethal dose of CCHFV IbAr10200 and monitored for 14 days and weight changes (%), clinical scores, and survival (%) for A non-survivors (groups with <20% survival) and B survivors (groups with >20% survival) are given. Weight change is represented as percent decrease from baseline (taken on the day of challenge) for individual animals. Clinical scores (from 0–10) are depicted as increasing intensity of red. Gray boxes indicate end of monitoring. C Samples of various tissues collected when animals reached endpoint criteria from non-survivors (fatal; 6–8 dpc) and at study completion (14 dpc) from survivors. Blood samples could not be collected from the animals found dead. Viral shedding was determined by quantifying viral RNA from oral and rectal swabs collected when euthanasia criteria were met (non-survivors) and at study completion (survivors). Horizontal line represents the median value for the group. Multiple comparisons were performed using a two-way ANOVA. p values were adjusted for multiple comparisons using the two-stage linear set-up procedure of Benjamini, Krieger, and Yekutieli (*p < 0.05; **p < 0.001; ***p < 0.0003).
Fig. 7
Fig. 7. Anti-NP humoral immune responses to CCHFV challenge.
NP-specific IgM A and IgG B responses 4 and 14 days post challenge (dpc) were determined as endpoint titers in plasma samples. C IgG1 and IgG2c titers were determined as endpoint titers in plasma samples. D IgG1 to IgG2c ratios were determined by dividing the endpoint titers of IgG1 by endpoint titers of IgG2 from individual animals. The dotted horizontal line represents IgG1:IgG2c ratio = 1. E Avidity indices of anti-NP antibodies of vaccinated animals were determined 4 and 14 dpc. For the avidity of IgG antibodies, AUC of 7-point dilutions of urea-treated and untreated samples were determined, and the avidity index was calculated as follows: (AUC of the urea-treated sample/AUC of untreated sample) × 100. Each dot on the graphs represents the mean value of the replicates from each animal and the horizontal line represents the median value for the group. ADCD function of anti-NP F antibodies represented as the fold change in complement deposition, and ADCP function G represented as fold change in phagocytic score over mock-vaccinated animals of corresponding timepoint 0 and 4 dpc. Results at 14 dpc were represented as fold change over 4 dpc mock-vaccinated animals. All samples were tested in duplicate. Two-tailed nonparametric t test and ordinary one-way ANOVA (*p < 0.05; **p < 0.001; ***p < 0.0003) were used for statistical analyses when applicable. Statistical analyses for IgM and IgG titers were conducted between plasma samples collected 4 and 14 dpc from NP + GP38-vaccinated and NP-vaccinated animal samples to compare endpoint titers. For IgG subclasses, statistical analyses were performed using IgG1 and IgG2 titers of individual vaccine groups in plasma samples collected on 0, 4, and 14 dpc. For IgG avidity, statistical analyses were performed between plasma samples of NP + GP38-vaccinated and NP-vaccinated animals collected 4 and 14 dpc.
Fig. 8
Fig. 8. Anti-GP38 humoral immune responses to CCHFV challenge.
GP38-specific IgM A and IgG B responses 4 and 14 dpc were determined as endpoint titers in plasma samples. C IgG1 and IgG2c titers were determined as endpoint titers in plasma samples. D IgG1 to IgG2c ratios were determined by dividing the endpoint titers of IgG1 by IgG2 titers in samples from individual animals. Dotted horizontal line represents IgG1:IgG2c = 1. E The avidity indices of anti-GP38 antibodies of vaccinated animals 4 and 14 dpc were determined. For the avidity of IgG antibodies, AUC of 7-point dilutions of urea-treated and untreated samples were determined, and the avidity index calculated as follows: (AUC of the urea-treated sample/AUC of untreated sample) × 100. Each dot on the graphs represents the mean value of the replicates from each animal and the horizontal line represents the median value for the group. ADCD function of F anti-GP38 antibodies represented as the fold change in complement deposition, and ADCP function G represented as fold change in phagocytic score over mock-vaccinated animals of corresponding timepoint 0 and 4 dpc. Results at 14 dpc were represented as fold change over 4 dpc mock-vaccinated animals. All samples were tested in duplicate. Two-tailed nonparametric t test and ordinary one-way ANOVA (*p < 0.05; **p < 0.001; ***p < 0.0003) were used for statistical analyses when applicable. Statistical analyses for IgM and IgG titers were conducted between plasma samples collected 0, 4 and 14 dpc from NP + GP38-vaccinated animal samples to compare endpoint titers. For IgG subclasses, statistical analyses were performed with IgG1 and IgG2 titers of individual vaccine groups in plasma samples collected 4 and 14 dpc. For IgG avidity, statistical analyses were performed between plasma samples collected 4 and 14 dpc from NP + GP38-vaccinated animals.
Fig. 9
Fig. 9. Liver and spleen pathology, CCHFV antigen detection, and pro-inflammatory cytokine levels in vaccine-protected animals.
Tissue specimens were stained with hematoxylin and eosin (H&E), and antigen detection was visualized by IHC using rabbit polyclonal serum directed against CCHFV nucleoprotein. Representative images of histopathological findings in liver and spleen, and CCHF antigen detection by IHC are shown. A Mock-vaccinated animals when euthanasia criteria were met had extensive hepatocyte necrosis and CCHF antigen detection by IHC (red) in hepatocytes, intravascular leukocytes, and endothelial cells. Spleens had lymphoid reactivity and necrosis/apoptosis, with macrophage infiltration and extensive IHC staining (red). B Survivors in NP and NP + GP38 vaccine groups collected 14 dpc had scattered foci of inflammation with minimal or no hepatocyte necrosis and no or rare IHC staining (red). Spleens showed lymphoid reactivity without IHC staining. C IL1-B, D IL-6, and E TNF-alpha levels from plasma samples of surviving animals were determined by using ProcartaPlex Mouse Th1/Th2 Chemokine panel. Results are represented in pg/mL. Horizontal line represents the median value for the group. Statistical analyses were performed using non-parametric one-tailed Mann–Whitney U tests to compare cytokine levels (*p = 0.0571; **p = 0.0286).
Fig. 10
Fig. 10. Qualitative representation of outcomes of vaccination with recombinant CCHFV proteins.
Schematic summary of the immune responses and protective efficacy of each vaccine. IgM and IgG responses, ADCD, and ADCP functions of antibodies and T-cell response were used as indicators of immune response. Clinical chemistry profiles, improved clinical outcome, reduced histopathology of liver and spleen, and survival were used as indicators of protective efficacy. To describe the strength of humoral immune responses and protection from lethal disease, the following scale was used: absent (−), mild (+), moderate (++), and strong (+++). Graphical illustrations were prepared with BioRender (www.biorender.com).

Similar articles

Cited by

References

    1. Bente, D. A. et al. Crimean-Congo hemorrhagic fever: history, epidemiology, pathogenesis, clinical syndrome and genetic diversity. Antivir. Res.100, 159–189 (2013). 10.1016/j.antiviral.2013.07.006 - DOI - PubMed
    1. Gargili, A. et al. The role of ticks in the maintenance and transmission of Crimean-Congo hemorrhagic fever virus: a review of published field and laboratory studies. Antivir. Res.144, 93–119 (2017). 10.1016/j.antiviral.2017.05.010 - DOI - PMC - PubMed
    1. Elaldi, N. & Kaya, S. Crimean-Congo hemorrhagic fever. Jmid4, (2014).
    1. Ergonul, O. Crimean-Congo hemorrhagic fever virus: new outbreaks, new discoveries. Curr. Opin. Virol.2, 215–220 (2012). 10.1016/j.coviro.2012.03.001 - DOI - PubMed
    1. World Health Organization. Crimean-Congo haemorrhagic fever. https://www.who.int/news-room/fact-sheets/detail/crimean-congo-haemorrha... (2022).