. 2024 Sep;633(8028):165-173.
doi: 10.1038/s41586-024-07791-5. Epub 2024 Aug 14.

Human organoids with an autologous tissue-resident immune compartment

Affiliations

Human organoids with an autologous tissue-resident immune compartment

Timothy Recaldin et al. Nature. 2024 Sep.

Abstract

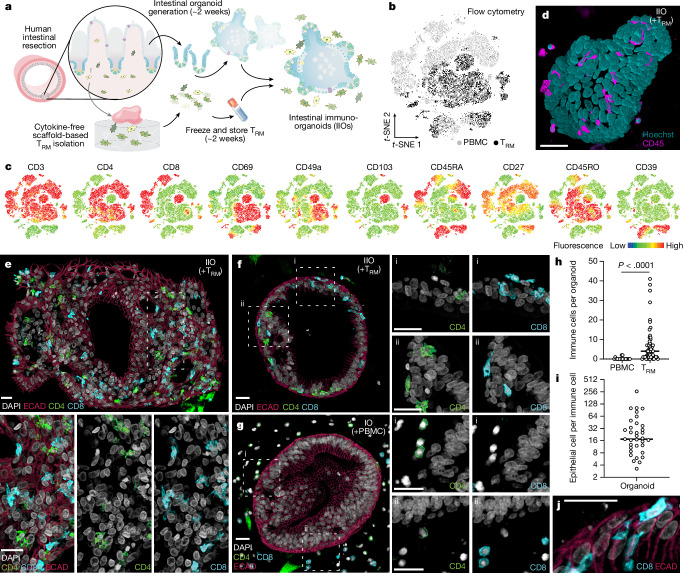
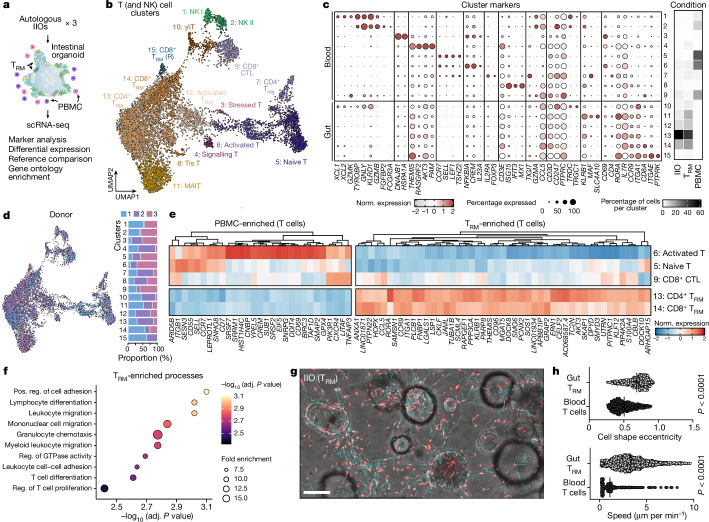
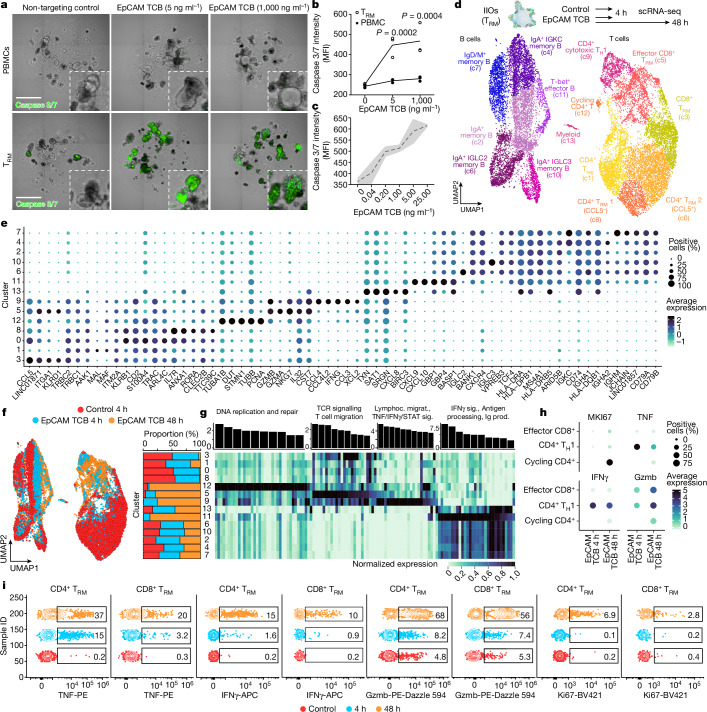
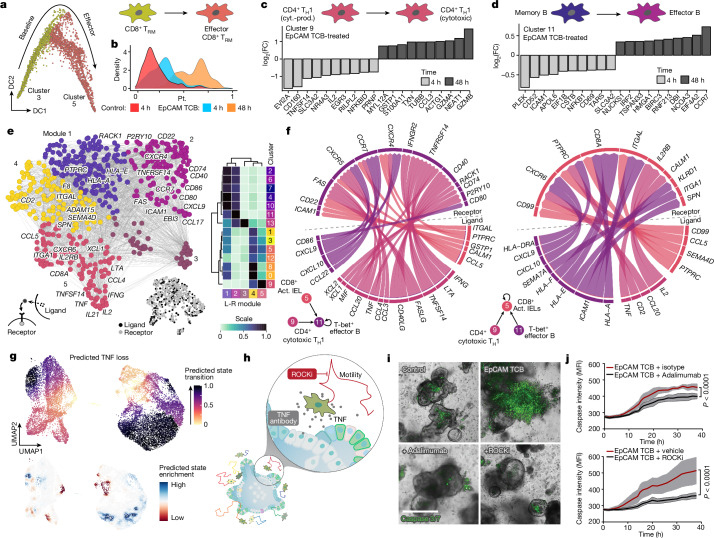
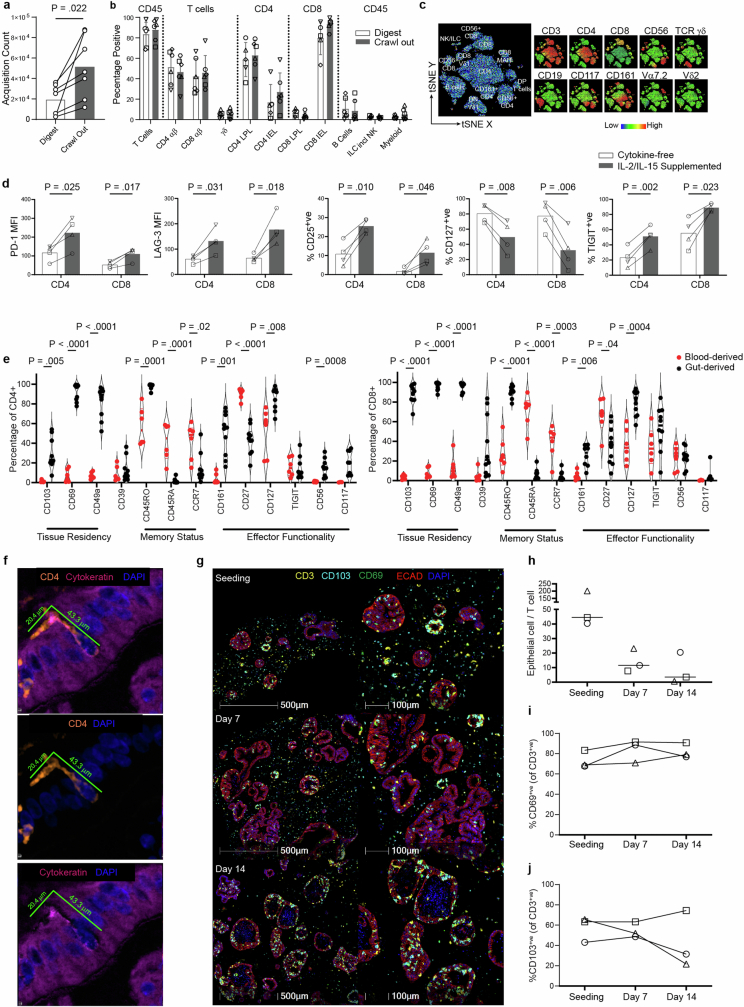
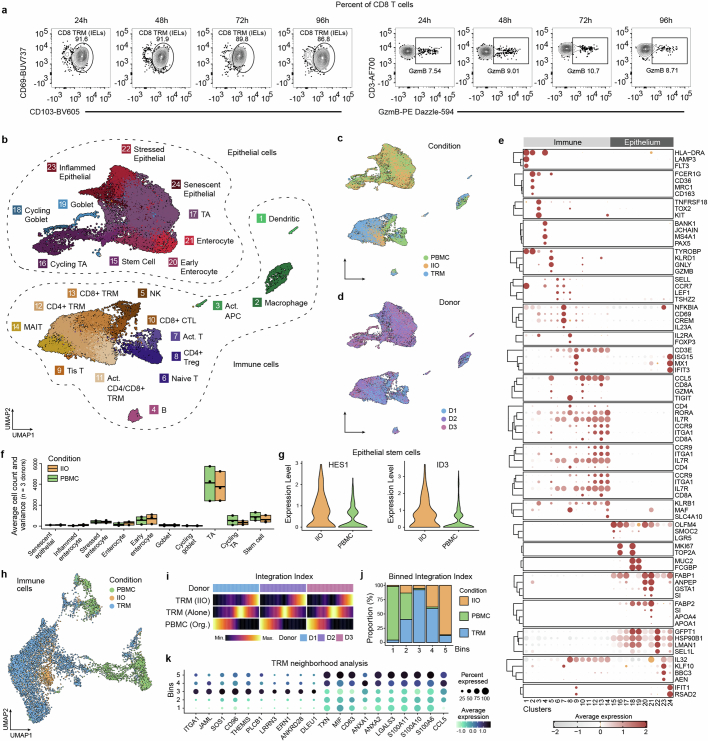
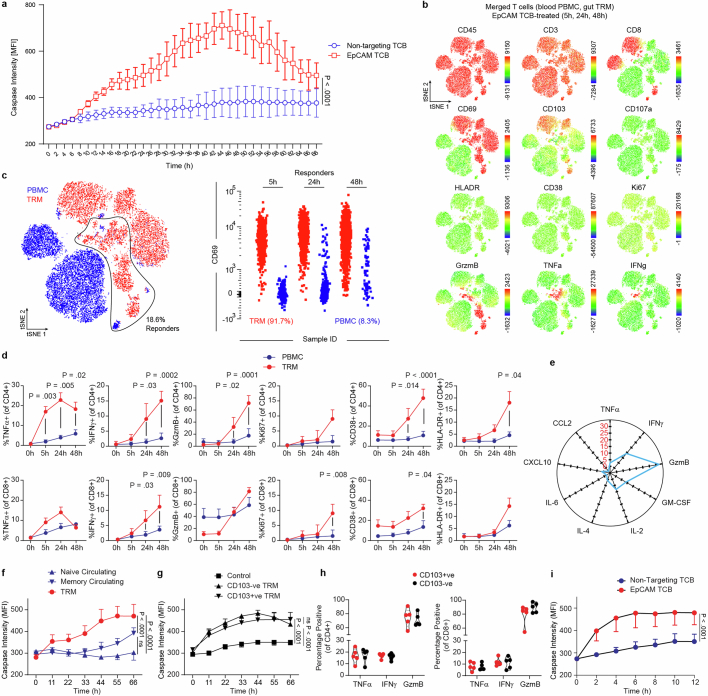
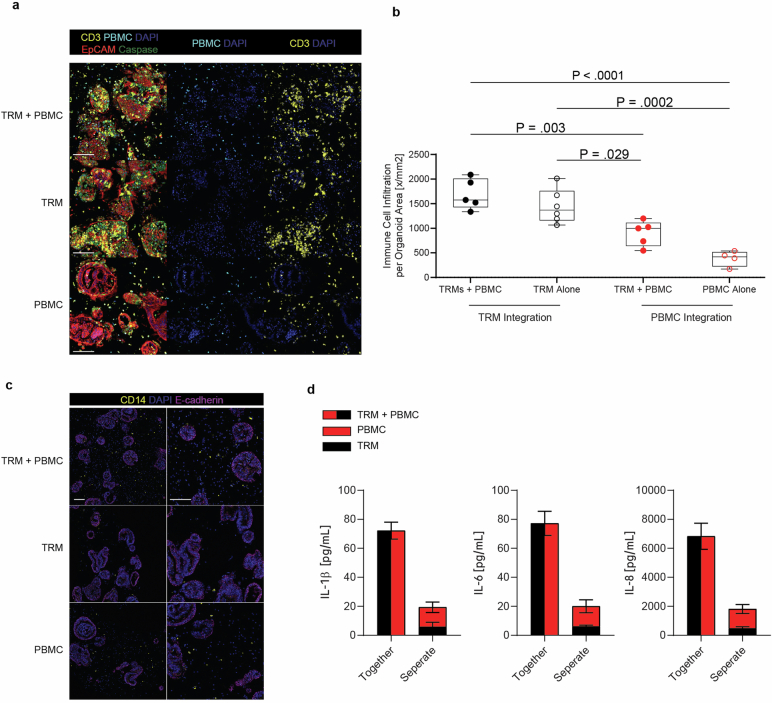
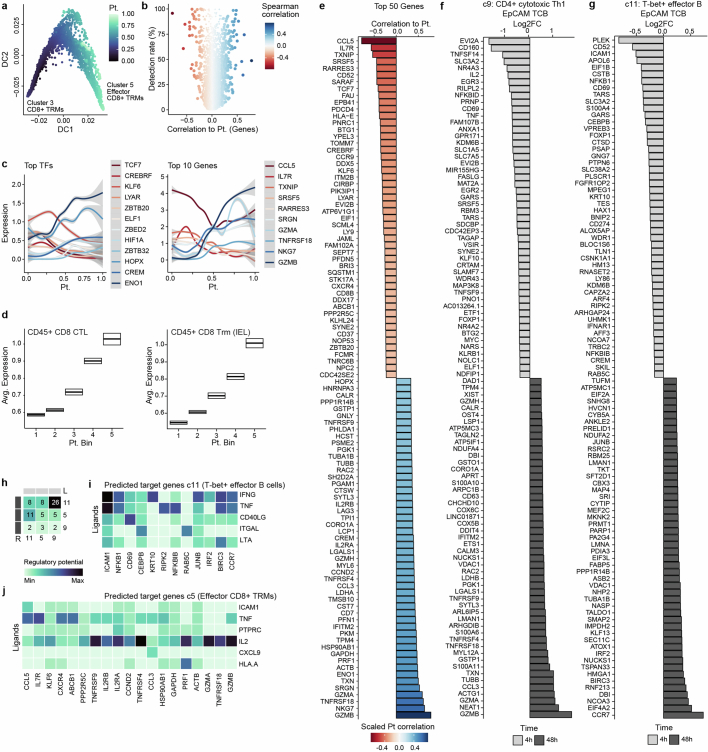
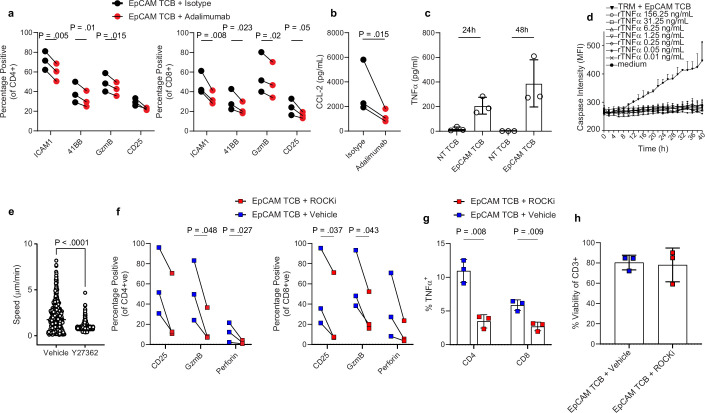
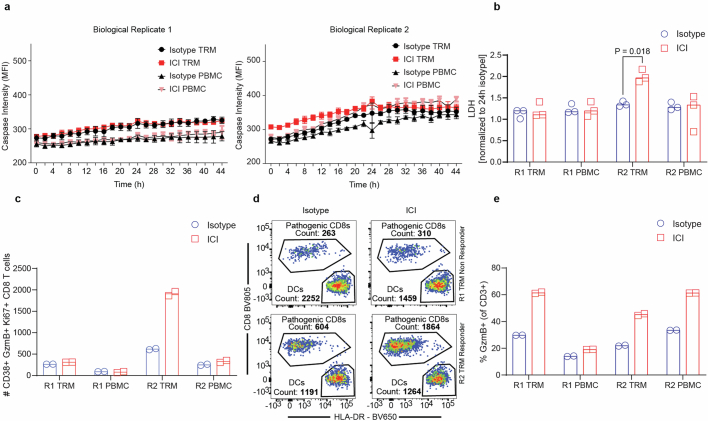
The intimate relationship between the epithelium and immune system is crucial for maintaining tissue homeostasis, with perturbations therein linked to autoimmune disease and cancer1-3. Whereas stem cell-derived organoids are powerful models of epithelial function4, they lack tissue-resident immune cells that are essential for capturing organ-level processes. We describe human intestinal immuno-organoids (IIOs), formed through self-organization of epithelial organoids and autologous tissue-resident memory T (TRM) cells, a portion of which integrate within the epithelium and continuously survey the barrier. TRM cell migration and interaction with epithelial cells was orchestrated by TRM cell-enriched transcriptomic programs governing cell motility and adhesion. We combined IIOs and single-cell transcriptomics to investigate intestinal inflammation triggered by cancer-targeting biologics in patients. Inflammation was associated with the emergence of an activated population of CD8+ T cells that progressively acquired intraepithelial and cytotoxic features. The appearance of this effector population was preceded and potentiated by a T helper-1-like CD4+ population, which initially produced cytokines and subsequently became cytotoxic itself. As a system amenable to direct perturbation, IIOs allowed us to identify the Rho pathway as a new target for mitigation of immunotherapy-associated intestinal inflammation. Given that they recapitulate both the phenotypic outcomes and underlying interlineage immune interactions, IIOs can be used to study tissue-resident immune responses in the context of tumorigenesis and infectious and autoimmune diseases.


Conflict of interest statement

All authors are employees of Hoffmann-LaRoche. The company provided support in the form of salaries for authors but did not have any additional role in the study design, data collection and analysis, decision to publish or preparation of the manuscript.

Figures

Fig. 1
Fig. 1. Intestine-derived TRM cells integrate homeostatically into autologous organoids to form IIOs.
a, Schematic overview of establishment of autologous IIOs (adapted with permission from ref. ). b,c, Flow cytometry-based, t-distributed stochastic neighbour-embedding (t-SNE) analysis of donor-matched gut TRM cell and circulating PBMC T cell subgroups based on surface marker expression, derived from one donor and representative of six biological replicates. t-SNE plot coloured according to original source of T cells (b; light grey for PBMCs and black for TRM cells), and expression of ten individual markers of naivety, memory and tissue residency (c). d, Fluorescent live image 24 h following IIO co-culture set-up (nuclei, teal; T cells, pink). Similar images were observed with four biological replicates. eg, mIF staining of cultures 24 h following co-culture with autologous TRM cells (e,f) or PBMCs (g). Intestinal organoids highlighted by E-cadherin+ (ECAD) epithelium (red). CD4+ (green) and CD8+ (turquoise) TRM cells integrated within larger (e) or smaller (f) organoids whereas blood-derived CD4+ and CD8+ T cells surrounded the organoid (g). Box i and box ii highlight the presence (f) or absence (g) of immune cell integration into two representative regions (i and ii) of the epithelium. eg, miF images representative of three independent biological replicates. IO, intestinal organoid. h, Immune cell count detected per organoid, each data point representing an individual organoid; n = 18 for PBMCs and n = 54 for TRM cells, two-tailed Mann–Whitney test. i, Ratio of epithelial to immune cells within each organoid (n = 35), 24 h following organoid supplementation with autologous TRM cells. h,i, Data represent the collation of two independent IIO cultures. Similar results were observed in three biological replicates. j, Elongated flossing T cell inserting between basal and lateral epithelial cell junctions. Scale bars, 25 µm (dg, j). Source data
Fig. 2
Fig. 2. Tissue-resident transcriptomic signatures and migratory behaviour underlie TRM cell epithelial insertion and IIO formation.
a, Overview of single-cell transcriptome analysis of organoids containing patient-matched TRM cells and PBMCs. Data were generated from TRM cells alone (TRM), organoids containing TRM cells (IIO) and organoids containing PBMCs (PBMC) from three small intestine donors (one jejunum, one duodenum, one undefined small intestine). Organoid schematic adapted with permission from ref. , human schematic adapted from ref. . b, Integrated UMAP embedding of transcriptome data from immune cells of each condition, showing 15 distinct cell clusters (colours, numbers) labelled based on analysis of marker genes (see Extended Data Fig. 2 for the entire dataset). R, resting. c, Dotplot summarizing marker gene expression across different clusters. Heatmap sidebar shows proportional distribution of each condition across clusters. d, Left, immune cell UMAP with each cell coloured by donor; right, stacked barplot showing donor cell proportion in each cluster in which each column sums to 100. e, Heatmap representing genes with enriched expression in PBMCs (left) or TRM cells (right). f, Plot showing significantly enriched Gene Ontolology biological processes of genes marking CD8+ and CD4+ TRM cell clusters. Enrichment P value was generated using hypergeometric test with Bonferroni’s multiple-hypothesis correction. g, Images showing migration analysis derived from IIO time-lapse imaging. Tracks are shown in cyan, immune cells in red. Data quantified in h. h, Comparison of TRM cell and blood-derived T cell shape (top) and speed (bottom) from 42 min time-lapse imaging of IIO and organoid + T cell cultures. Two-tailed Mann–Whitney test. Each dot represents a detected cell and is the collation of duplicate cultures from one representative experiment. Cell shape eccentricity, n = 471 for gut TRM cells and n = 593 for blood T cells; motility, n = 2,335 for gut TRM cells and n = 866 for blood T cells. Similar results were observed with three biological replicates. Scale bar, 100 µm. Source data
Fig. 3
Fig. 3. IIOs recapitulate clinically manifested intestinal inflammation associated with TCB.
a, Representative images examining induction of green caspase 3/7 signal within IIO co-cultures 24 h following supplementation with EpCAM TCB. b, Quantification of caspase 3/7 signal from a. Two-way analysis of variance (ANOVA) with Sidak’s multiple-comparisons test. Triplicate IIO cultures representative of experiments performed with three independent biological donors. MFI, mean fluorescence intensity. c, Quantification of caspase 3/7 signal in IIO co-cultures treated for 72 h across a range of EpCAM TCB. Two independent IIO cultures were run across a six-dose titration of EpCAM TCB; mean (black line) and s.d. (grey shading). d, Single-cell transcriptomic profiles of gut-derived immune cells from IIO model were integrated and grouped into 14 distinct cell states as represented by colours in the UMAP embedding. Organoid schematic adapted with permission from ref. . e, Dotplot summarizing the expression patterns of representative genes across the clusters identified in d. f, Integrated UMAP embedding (left) and proportional distribution (right) of gut-derived immune cells from IIO model, coloured by treatment and profiling time. g, Barplot showing significantly enriched Gene Ontology biological processes for activated cell states (top) and heatmap showing average expression profiles of corresponding associated genes (bottom). h, Dotplot summarizing the expression pattern of representative genes involved in proliferation, signalling and cytotoxicity in activated T cell populations, as captured by scRNA-seq snapshots at different time points and under various treatment conditions. i, Flow cytometry plots visualizing expression of TNF, IFNγ, Gzmb and Ki67 across different time points within CD4+ and CD8+ TRM cells isolated from IIO cultures. Representative of five biologically independent experiments. Scale bars, 1 mm. Source data
Fig. 4
Fig. 4. Transcriptomic analyses elucidate the immune dynamics underlying TCB-mediated inflammation and help identify mitigation strategies.
a, CD8+ T cell activation in the IIO model was analysed using diffusion maps. Plot represents CD8+ T cells on the first two diffusion components (DCs), coloured by cell state. b, Density plot showing distribution of CD8+ T cells along the reconstructed pseudotime (x axis) grouped by treatment condition and time point. c,d, Barplot showing differentially expressed genes for CD4+ cytotoxic TH1 population (c9) (c) and T-bet+ effector B cells (c11) (d) at 4 h (light grey) and 48 h (dark grey) following EpCAM TCB treatment. e, Ligand–receptor pairing analysis of IIO immune cell populations. Ligands and receptors are coloured based on coexpression module, with some representative genes labelled. Heatmap (right) shows the average expression of each gene within a module across each cell cluster. f, Circle plots illustrate signalling interactions received by T-bet+ effector B cells (c11) (left) and CD8+ Act. IELs (c5) (right). g, In silico perturbation analysis simulating the loss (KO) of TNF in the IIO model treated with EpCAM TCB. Plots show predicted perturbation-induced state transition (top) and enrichment (bottom). h, Schematic of experiments performed to inhibit TNF signalling and cell migration. Organoid cartoon adapted with permission from ref. . i, Representative images showing induction of caspase 3/7 signal within IIO co-cultures 40 h following supplementation with either a non-targeting control TCB or 5 ng ml−1 EpCAM TCB, with or without 10 µM ROCKi or a TNF blocking antibody. j, Bi-hourly quantification of caspase 3/7 signal in IIO cultures; top, comparison of EpCAM TCB + isotype with EpCAM TCB + adalimumab; bottom, comparison of EpCAM TCB + vehicle with EpCAM TCB + ROCKi. Data represent mean and standard deviation (grey shading) of three independent biological replicates; two-tailed unpaired t-test of the area under the curve generated for each condition. Scale bar, 200 µm. FC, fold change. Source data
Extended Data Fig. 1
Extended Data Fig. 1. Intestinal TRM isolation and comparison to circulating T cells.
a, Comparison of viable CD45+ count in matched donors subjected to either digestion- or crawl out- based isolation. Two-tailed paired T-test. 7 biological replicates. b, Comparison of immune cell proportions subjected to either digestion- or crawl out- based isolation. Values represent percentages of parent population listed above each bar, as determined via flow cytometry. LPL lamina propria lymphocyte, IEL intraepithelial lymphocyte. Mean ± SD of 5 (Digest CD4 LPL, CD4 IEL, CD8 LPL, CD8 IEL, B cells) or 6 (all other conditions) biological replicates. Different symbol shapes represent individual donors. c, Flow cytometry-generated tSNE analysis of one intestinal lymphocyte isolation incorporating lineage-defining immune cell markers. Leftmost plot represents annotated cell populations with smaller plots displaying heatmaps for each of the 10 key surface markers assessed. DP double positive, DN double negative. Data is representative of six biologically-independent replicates. d, Bar charts comparing expression of key activation markers in gut-derived CD4+ and CD8+ T cells isolated via crawl out in cytokine-free or cytokine-supplemented (10IU/ml IL-2, 2 ng/ml IL-15) media in four biological replicates. Two-tailed paired T-test. e, Flow cytometry assessment of key functionality markers in CD4+ T cells (left graph) and CD8+ T cells (right graph) after crawl out isolation. Violin plots collate data from 10 (8 for CD117) independent intestinal tissue resections, 5 (3 for CD117) of which have matched blood-derived comparators, with 1 additional blood only sample. Two-tailed unpaired T-test between gut- and blood-derived expression values for each marker. f, mIF image of an elongated flossing T cell inserting itself between basal-lateral epithelial cell junctions. The 3 images are from the same region: upper image shows the full stain, middle image contains only CD4 and DAPI to emphasize the unusual shape of the T cell, lower image shows only DAPI and cytokeratin to reveal the space in the epithelium generated by the CD4 cell integration. Diameter of the T cell from head to tail is listed. Similar elongated T cells were observed in all IIO cultures analysed by mIF (n = 5). g, Representative mIF image of the IIO culture over time (upon immune cell introduction, 7 and 14 days later). Markers for T cell (CD3) and epithelial cell (ECAD: E-cadherin) identity, and tissue-residence (CD103 and CD69) are included. Data are quantified in (h-j). h, Ratio of epithelial cells to immune cells within identified organoids, during the course of a 14 day IIO culture. Line at median. i-j, Percent of CD3+ T cells expressing CD69 (i) or CD103 (j) during the course of a 14 day IIO culture, as determined by mIF. Data from h-j is derived from 3 biological replicates, with each individual donor represented by a different symbol. Source data
Extended Data Fig. 2
Extended Data Fig. 2. Single-cell transcriptome analysis of homeostatic IIO model.
a, Flow cytometry plots displaying daily CD8+ TRM IEL proportions and GzmB expression in baseline (untreated) IIO cultures after digestion, across 96 h. Plots are representative of 3 independent IIO experiments. b-d, UMAP embeddings of single-cell transcriptome data colored by cell cluster (b), condition (c) and donor origin (d). The sequenced conditions include intestinal organoids containing TRMs (IIO), organoids containing PBMCs (PBMC) and TRMs cultured in matrigel (TRM). e, Dotplot summarizing marker gene expression across different immune (left) and epithelial (right) cell clusters. f, Boxplots displaying the minimum, mean and maximum number of cells across all donors (n = 3) for clusters of epithelial cells cultured with TRMs (IIO) or PBMCs (PBMC). g, Violin plots illustrating the expression of HES1 and ID3 transcription factors in intestinal epithelial stem cells cultured with TRMs or PBMCs. h, UMAP embedding of subsetted T cells colored by condition as portrayed in Fig. 2b. i, Heatmaps representing T cell densities along the reconstructed integration index vector for each condition (rows) and donor (groups) membership. j, Stacked barplot showing the proportion of TRMs cultured with epithelium (IIO), TRMs cultured in matrigel (TRM) and PBMCs cultured with epithelium (PBMC) within 5 equidistant bins of the integration index. k, Dotplot summarizing marker gene expression of TRMs cultured in matrigel (left, bin3) and TRMs cultured with epithelium (right, bin5). Source data
Extended Data Fig. 3
Extended Data Fig. 3. TRMs exhibit rapid and aggressive targeting of healthy epithelium following EpCAM-TCB treatment.
a, Bihourly quantification of caspase 3/7 signal in IIO co-cultures for 68 h treated with either 5 ng/ml EpCAM TCB or a non-targeting control molecule, IIO triplicates representative of 3 independent biological replicates, mean ± SD. Two-tailed unpaired T-test of the area under the curve for each condition. b, Flow cytometry-generated tSNE analysis of all T cells at all timepoints, derived from one representative IIO co-culture and its matched PBMC-organoid co-culture control, treated with 5 ng/ml EpCAM TCB. Plots display heatmaps for each of the 12 surface and intracellular markers assessed by flow cytometry. c, Gating strategy for identifying responder cells (those that expressed TNF-α, IFNγ or GzmB), and the ungating of the concatenated flow cytometry files to reveal the original source of responder T cells. d, Expression of key soluble and cell surface factors in matched TRM and PBMC CD4+ (top row) and CD8+ (bottom row) T cells over 48 h, following IIO or matched PBMC-organoid co-culture treatment with 5 ng/ml EpCAM TCB, as determined via flow cytometry. Mean and SEM, 5 biological replicates (4 for Ki67). Statistically significant values between TRM and PBMC condition at each timepoint are displayed, 2-way ANOVA with Tukey’s Multiple Comparisons Test. e, Cytokine fold-increase in IIO culture supernatants 48 h after 5 ng/mL EpCAM TCB treatment, relative to the matched PBMC-organoid co-culture control, as analysed via Luminex technology. Mean of 3 biological replicates. f, Quantification of caspase 3/7 signal in IIO co-cultures, versus matched organoid-PBMC co-cultures containing either circulating naive and memory T cells for 66 h treated with 5 ng/ml EpCAM TCB, culture quadruplicates representative of 3 independent biological replicates, mean and SD. One-way ANOVA of the area under the curve calculated for each condition. g, Quantification of caspase 3/7 signal in IIO co-cultures containing matched CD103+ and CD103- TRMs for 66 h treated with 5 ng/ml EpCAM TCB or a non-targeting TCB, IIO quadruplicates (triplicates for CD103-ve TRM) representative of 3 independent biological replicates, mean and SD. One-way ANOVA of the area under the curve calculated for each condition. h, Flow cytometry assessment of TNF-α (24 h), IFNγ (48 h) or GzmB (48 h) in CD103+ and CD103- CD4+ T cells (left graph) and CD8+ T cells (right graph) from unsorted IIO cultures after treatment with 5 ng/ml EpCAM TCB. Violin plots collate data from 5 biological replicates. i, Quantification of caspase 3/7 signal in 10-day old IIO co-cultures treated with 5 ng/ml EpCAM TCB or a non-targeting TCB, IIO triplicates (non-targeting) or quadruplicates (EpCAM TCB) representative of 2 biological-independent replicates, mean and SD. Two-tailed unpaired T-test of the area under the curve calculated for each condition. Source data
Extended Data Fig. 4
Extended Data Fig. 4. TRM-generated inflammation promotes recruitment of circulating T cells into the epithelium.
a, mIF images of TRM + PBMC (IIO + PBMC), TRM-alone (IIO) and PBMC-alone co-cultures with intestinal organoids, 18 h post treatment with 100 ng/ml EpCAM TCB treatment. EpCAM+ organoids (red) surrounded by CD3+ TRMs (yellow) and CellTracker CMFDA Green+ CD3+ PBMCs (cyan+yellow). Caspase 3 (green) captures TCB-triggered immune-induced apoptosis, nuclei are stained with DAPI (blue). Scale bar, 100 µm. Images are representative of four independent IIO experiments. b, Immune infiltration of TRMs, PBMC and TRMs+PBMC-organoid into organoids at 30 h post EpCAM TCB treatment. Data represented as boxplots, with whiskers showing all points (minimum to maximum) of the mean number of immune cells per individual organoid, summed and normalized to the sum organoid area for 4 (PBMC alone), 5 (TRM + PBMC) or 6 (TRM alone) independent IIO replicates. One-way ANOVA with Tukey’s multiple comparisons test. c, mIF images of TRM + PBMC, TRM-alone and PBMC-alone co-cultures with intestinal organoids following 4 h treatment with 100 ng/ml EpCAM TCB. Monocytes (yellow) surround organoids (pink), nuclei are stained with DAPI (blue). Scale bar, 100 µm. Images are representative of four independent IIO experiments. d, Luminex quantification of IL-1β, IL-6 and IL-8 in the supernatants of the TRM + PBMC co-culture with organoids and the respective single immune cell condition, 30 h after treatment with 100 ng/ml EpCAM, 3 independent IIO replicates, representative of 3 biologically independent experiments. Mean and SD. Source data
Extended Data Fig. 5
Extended Data Fig. 5. Extended analysis of cell states and interactions in IIOs after treatment.
a, Plot represents IIO CD8+ T cells on the first two diffusion components colored by reconstructed diffusion pseudotime. b, Volcano plot showing variable genes along reconstructed CD8+ T cell trajectory. x-axis represents spearman correlation value between gene expression and pseudotime value, y-axis represents detection rates of genes in the CD8+ T cell populations. c, Expression patterns of most variable TFs (left) and effector genes (right) along the reconstructed CD8+ T cell trajectory. d, Boxplot summarizing the expression pattern of CD8+ CTL (left) and CD8+ Trm IEL (right) gene signatures described in ref. along the reconstructed activation trajectory of IIO CD8+ T cells. x-axis represents 5 equidistant bins of the reconstructed pseudotime. Boxes represent the mean ± 95% CI computed from 100 bootstraps of the cells in each bin. e-g, Barplot showing differentially expressed genes in the CD8+ T cell trajectory (e), in the CD4+ cytotoxic Th1 population (c9) (f) and in the T-bet+ effector B cells (c11) (g) at 4 h and 48 h after EpCAM TCB treatment. h, Heatmap summarizes directed ligand-receptor pairing interactions of T-bet+ effector B cells (c11) and T cell populations (clusters 5 and 9) in the IIO model. i-j, Predicted regulatory potential of CD4+ cytotoxic Th1 cells (c9) ligands towards signature genes of T-bet+ effector B cells (c11) (i) and CD8+ activated IELs (c5) (j). Source data
Extended Data Fig. 6
Extended Data Fig. 6. Inhibition of TNF-α signaling and the ROCK1/2 pathway quells TRM-driven intestinal inflammation.
a, Line graphs quantifying expression of predicted TNF-α targets associated with T cell activation and cytotoxicity, 48 h after treatment with 5 ng/ml EpCAM TCB in the presence of the TNF-α-neutralizing antibody Adalimumab or an isotype control. Left graph displays expression in CD4+ T cells and the right graph displays expression in CD8+ T cells. Two-tailed paired T-test. Data derived from three biological replicates. b, Luminex quantification of CCL2 chemokine in the supernatant of IIO cultures, 48 h after treatment with 5 ng/ml EpCAM TCB in the presence of the TNF-α-neutralizing antibody Adalimumab or an isotype control. Two-tailed paired T-test. Data derived from three biological replicates. c, Luminex quantification of TNF-α in the supernatants of IIO cultures, 24 h and 48 h after treatment with either 5 ng/ml EpCAM TCB or a non-targeting control. Data derived from three biological replicates. Mean and SD. d, Bihourly quantification of caspase 3/7 signal in organoid cultures treated with increasing concentrations of recombinant TNF-α cytokine for 40 h. TRM-containing IIO cultures treated with 5 ng/ml EpCAM TCB served as a positive control for caspase 3/7 induction. Technical triplicates representative of 2 independent biological replicates, mean and SD. e, CellProfiler assessment of TRM migration speed during 1 h live-imaging of IIO cultures, either in the presence of 10 µM ROCKi or vehicle control. Each dot represents a migrating cell tracked for more than 20 frames. Violin plots are a collation of duplicate videos from one IIO culture, n = 471 for vehicle and 546 for ROCKi treated. Similar results were observed in 3 biologically-independent IIO cultures. Bar shows mean. Two-tailed unpaired Mann-Whitney test. f, Line graphs quantifying expression of CD25, GzmB and perforin in CD4+ T cells (left graph) CD8+ T cells (right graph) isolated from IIO co-cultures 72 h after treatment with 5 ng/ml EpCAM-targeting T-cell bispecific antibodies in the presence of 10 µM ROCKi or vehicle control, as determined via flow cytometry. Two-tailed paired T-test, 3 biological replicates. g, Expression of intracellular TNF-α in CD4+ T cells (left graph) CD8+ T cells (right graph) isolated from IIO co-cultures 72 h after treatment with 5 ng/ml EpCAM-targeting T-cell bispecific antibodies in the presence of 10 µM ROCKi or vehicle control. Two-tailed paired T-test, 3 biological replicates, mean and SD h, Viability of T cells within IIO co-cultures 72 h after treatment with 5 ng/ml EpCAM-targeting T-cell bispecific antibodies in the presence of 10 µM ROCKi or vehicle control, as determined via flow cytometry. Cells were first gated based on CD3 expression and defined as viable via the live/dead dye Efluor780. n = 3 biological replicates, mean and SD. Source data
Extended Data Fig. 7
Extended Data Fig. 7. IIO cultures provide a route to study ICI-induced colitis.
a, Bihourly quantification of caspase 3/7 signal in ICI- or isotype- treated IIOs or matched PBMC-organoid co-cultures. 3-independent co-cultures from two biological replicates are shown. Mean and SD. b, LDH signal in the supernatant of the conditions described in a after 48 h of culture. Two-tailed paired T test. c, Flow cytometry quantification of the number of cytotoxic CD38+ Ki67+ GzmB+ CD8+ T cells within the conditions described in a after 48 h of culture. d, Boolean gating-derived flow cytometry plots showing the counts of CD38+ GzmB+ Ki67+ “pathogenic” CD8+ T cells and allogeneic DCs after 48 h of IIO culture in each of the TRM donors, treated with either an isotype control or ICI e, Flow cytometry quantification of the number GzmB+ T cells within the conditions described in a after 48 h of IIO culture. ICI immune checkpoint inhibitor, R1 replicate 1, R2 replicate 2. DC dendritic cell. Source data

References

    1. Girardi, M. et al. Regulation of cutaneous malignancy by gammadelta T cells. Science294, 605–609 (2001). - PubMed
    1. Mayassi, T. et al. Chronic inflammation permanently reshapes tissue-resident immunity in celiac disease. Cell176, 967–981 (2019). - PMC - PubMed
    1. Dart, R. J. et al. Conserved gammadelta T cell selection by BTNL proteins limits progression of human inflammatory bowel disease. Science381, eadh0301 (2023). - PMC - PubMed
    1. Schutgens, F. & Clevers, H. Human organoids: tools for understanding biology and treating diseases. Annu. Rev. Pathol.15, 211–234 (2020). - PubMed
    1. Gray, J. I. & Farber, D. L. Tissue-resident immune cells in humans. Annu. Rev. Immunol.40, 195–220 (2022). - PMC - PubMed

MeSH terms

LinkOut - more resources