. 2024 Sep;633(8031):848-855.
doi: 10.1038/s41586-024-07808-z. Epub 2024 Aug 14.

Origin and evolution of the bread wheat D genome

Emile Cavalet-Giorsa #  1 Andrea González-Muñoz #  1 Naveenkumar Athiyannan #  1 Samuel Holden  2 Adil Salhi  3 Catherine Gardener  1 Jesús Quiroz-Chávez  4 Samira M Rustamova  5 Ahmed Fawzy Elkot  6 Mehran Patpour  7 Awais Rasheed  8   9 Long Mao  10 Evans S Lagudah  11 Sambasivam K Periyannan  11   12 Amir Sharon  13 Axel Himmelbach  14 Jochen C Reif  14 Manuela Knauft  14 Martin Mascher  14   15 Nils Stein  14   16 Noam Chayut  4 Sreya Ghosh  4 Dragan Perovic  17 Alexander Putra  18 Ana B Perera  1 Chia-Yi Hu  1 Guotai Yu  1 Hanin Ibrahim Ahmed  1   19 Konstanze D Laquai  1 Luis F Rivera  1 Renjie Chen  1 Yajun Wang  1   20 Xin Gao  3 Sanzhen Liu  21 W John Raupp  22 Eric L Olson  23 Jong-Yeol Lee  24 Parveen Chhuneja  25 Satinder Kaur  25 Peng Zhang  26 Robert F Park  26 Yi Ding  26 Deng-Cai Liu  27 Wanlong Li  28 Firuza Y Nasyrova  29 Jan Dvorak  30 Mehrdad Abbasi  2 Meng Li  2 Naveen Kumar  2 Wilku B Meyer  31 Willem H P Boshoff  31 Brian J Steffenson  32 Oadi Matny  32 Parva K Sharma  33 Vijay K Tiwari  33 Surbhi Grewal  34 Curtis J Pozniak  35 Harmeet Singh Chawla  35   36 Jennifer Ens  35 Luke T Dunning  37 James A Kolmer  38 Gerard R Lazo  39 Steven S Xu  39 Yong Q Gu  39 Xianyang Xu  40 Cristobal Uauy  4 Michael Abrouk  1 Salim Bougouffa  3 Gurcharn S Brar  2   41 Brande B H Wulff  42 Simon G Krattinger  43
Affiliations

Origin and evolution of the bread wheat D genome

Emile Cavalet-Giorsa et al. Nature. 2024 Sep.

Abstract

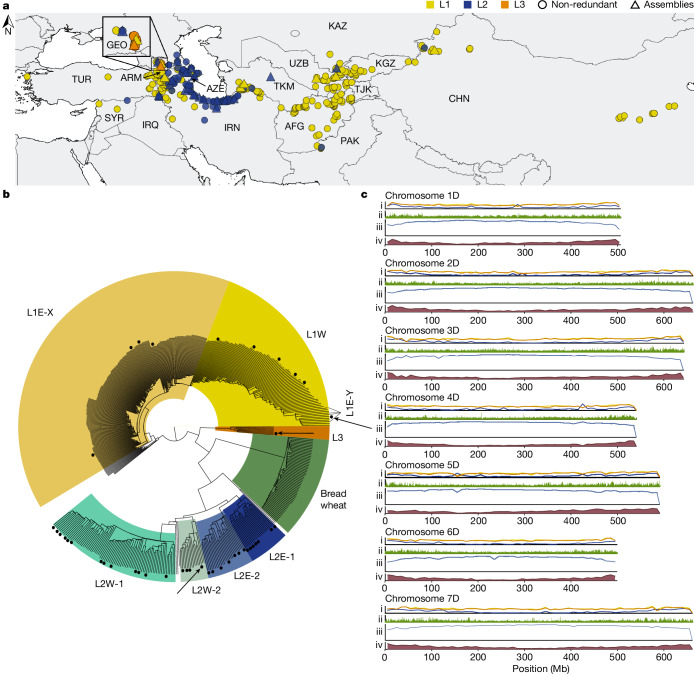
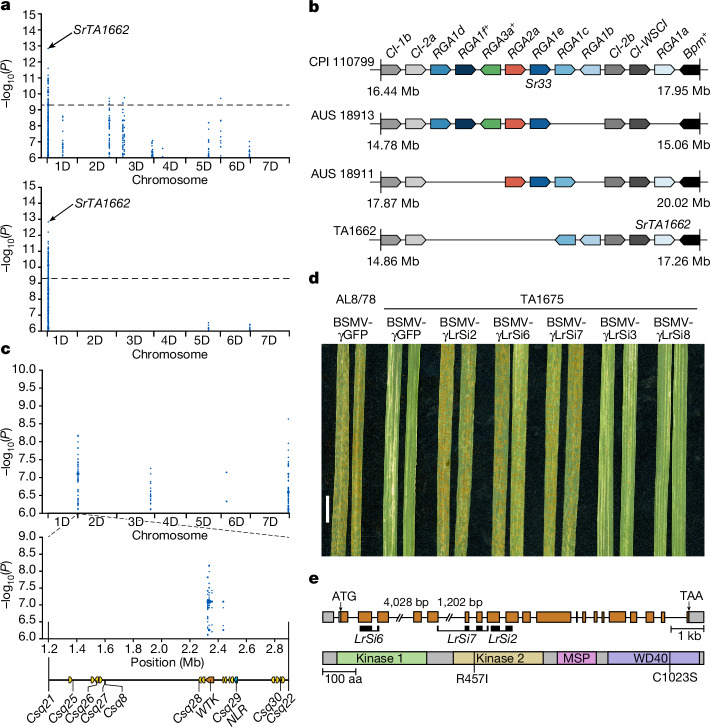
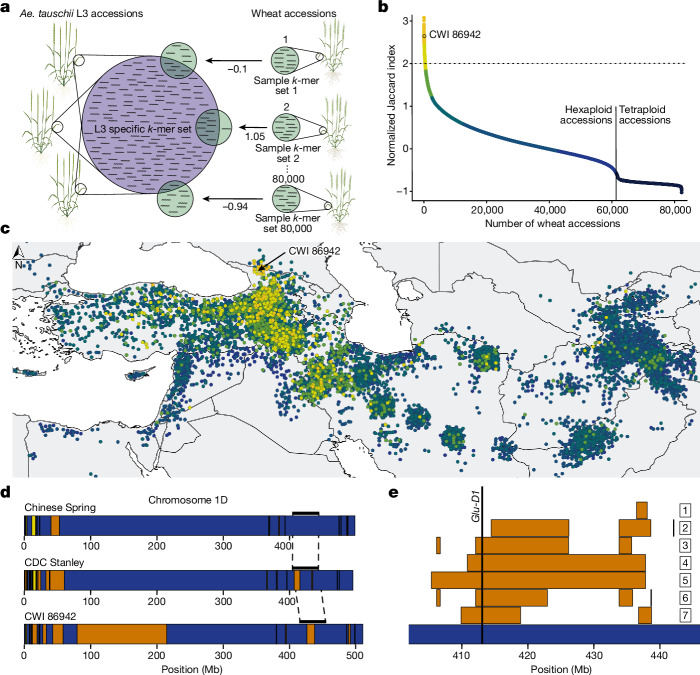
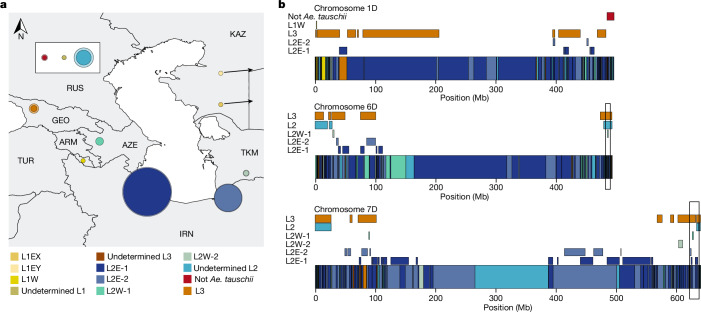
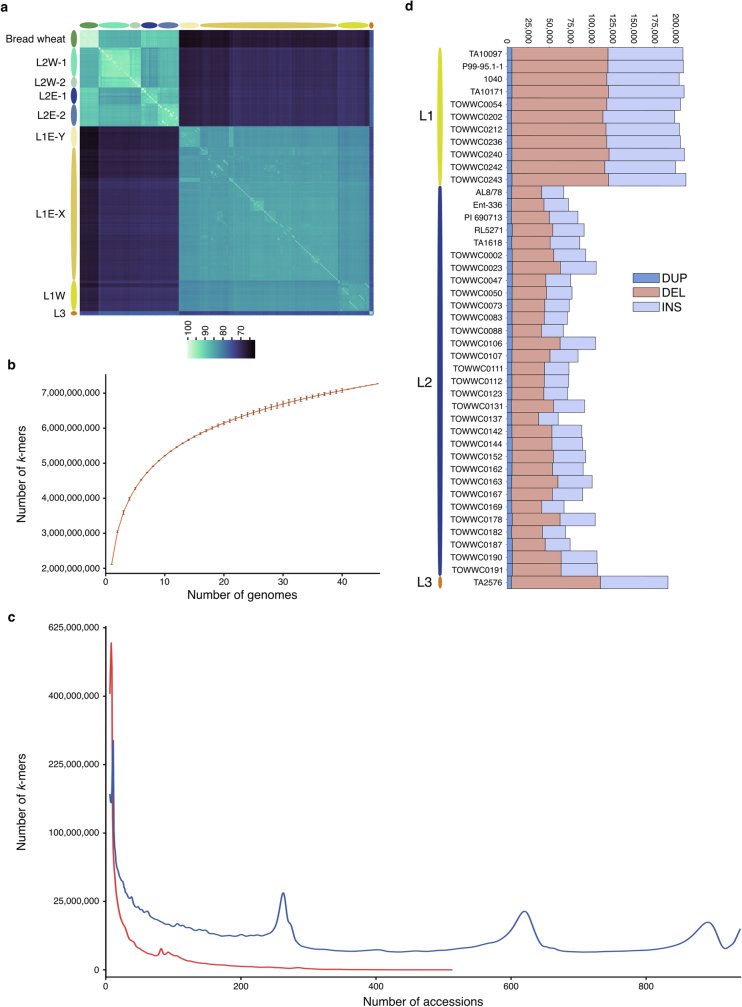
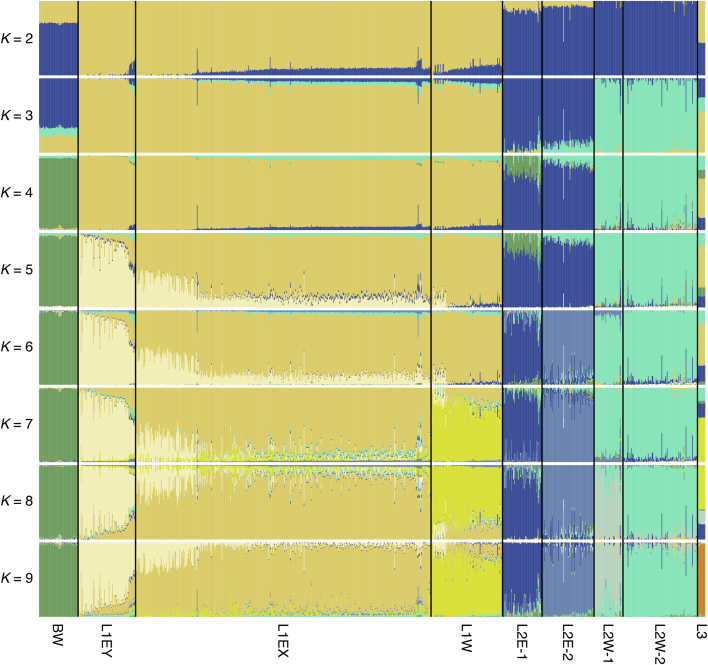
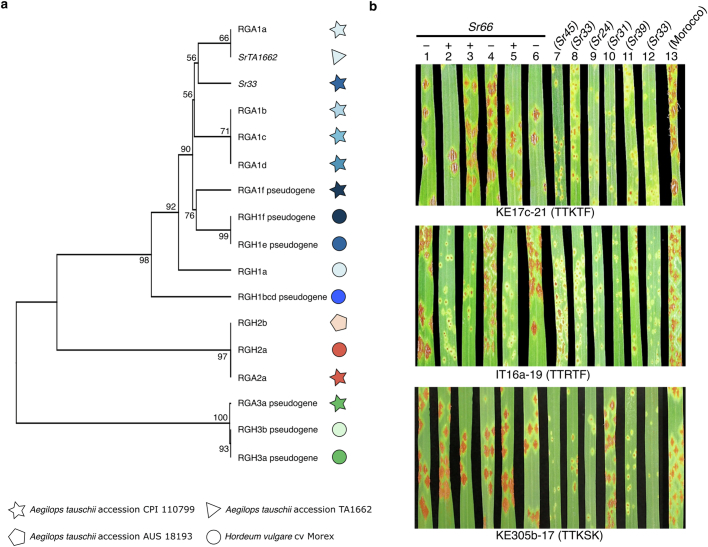
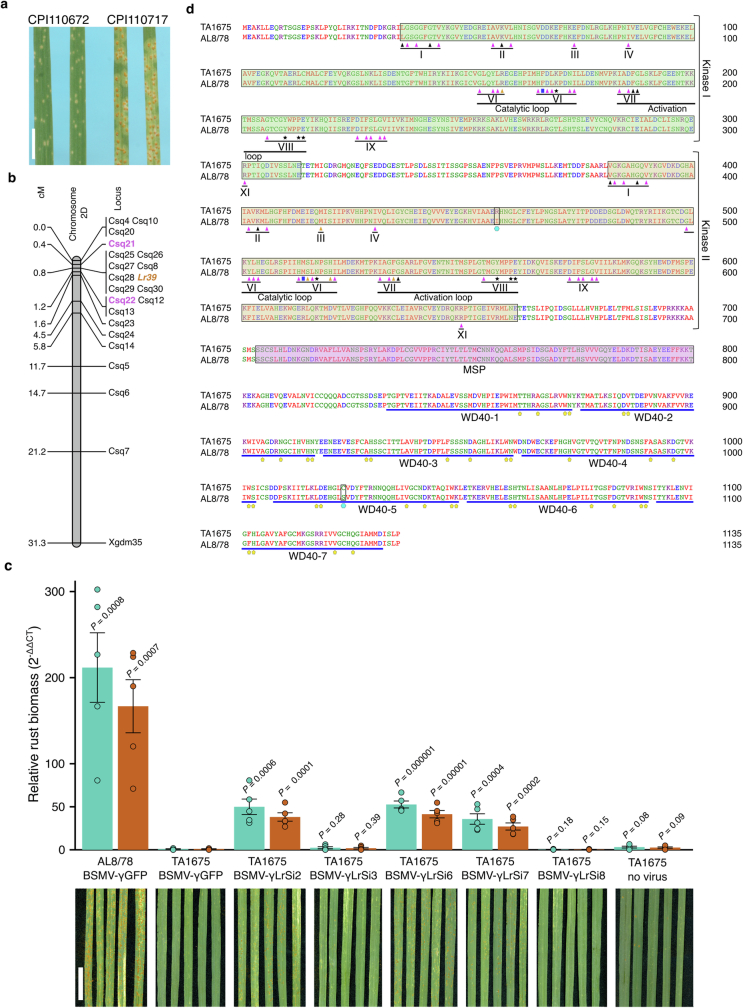
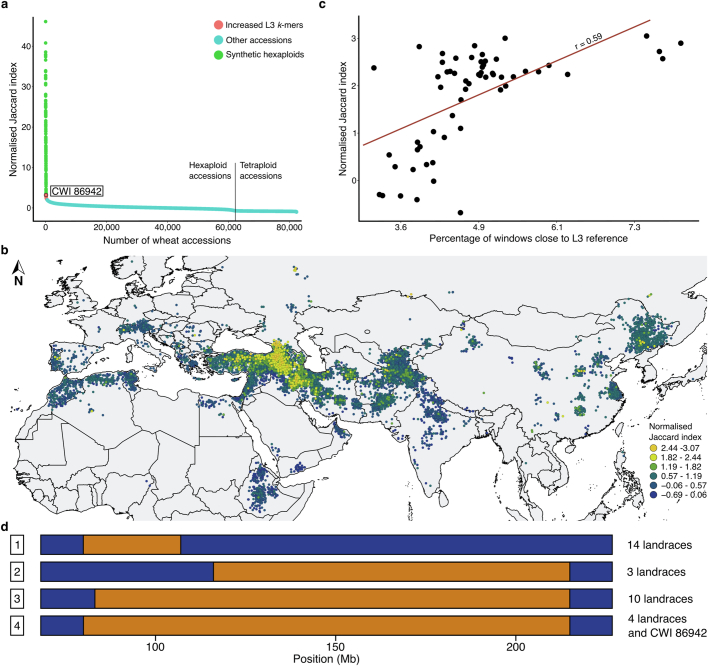
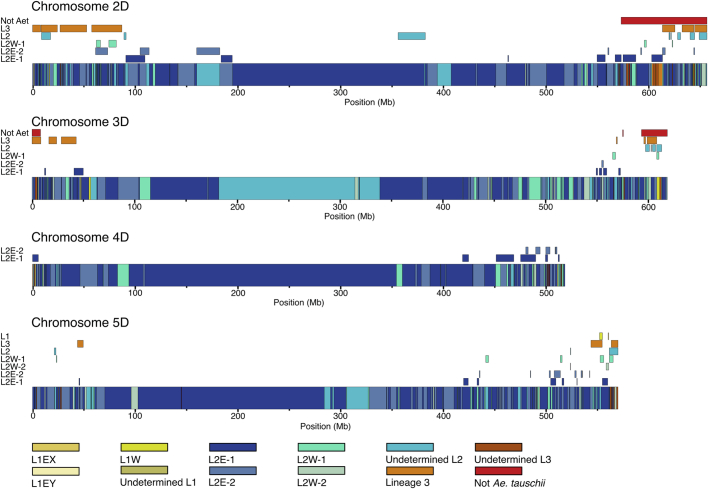
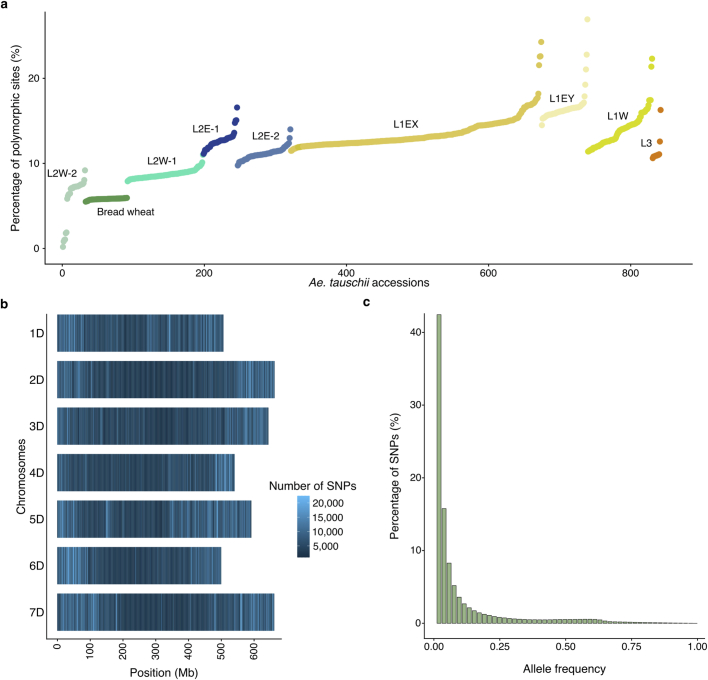
Bread wheat (Triticum aestivum) is a globally dominant crop and major source of calories and proteins for the human diet. Compared with its wild ancestors, modern bread wheat shows lower genetic diversity, caused by polyploidisation, domestication and breeding bottlenecks1,2. Wild wheat relatives represent genetic reservoirs, and harbour diversity and beneficial alleles that have not been incorporated into bread wheat. Here we establish and analyse extensive genome resources for Tausch's goatgrass (Aegilops tauschii), the donor of the bread wheat D genome. Our analysis of 46 Ae. tauschii genomes enabled us to clone a disease resistance gene and perform haplotype analysis across a complex disease resistance locus, allowing us to discern alleles from paralogous gene copies. We also reveal the complex genetic composition and history of the bread wheat D genome, which involves contributions from genetically and geographically discrete Ae. tauschii subpopulations. Together, our results reveal the complex history of the bread wheat D genome and demonstrate the potential of wild relatives in crop improvement.


Conflict of interest statement

The authors declare no competing interests.

Figures

Fig. 1
Fig. 1. The Ae. tauschii diversity panel and genomes.
a, Geographical distribution of the 493 non-redundant Ae. tauschii accessions in the diversity panel. Accessions selected to generate high-quality assemblies are indicated by triangles coloured according to their respective lineage. AFG, Afghanistan; ARM, Armenia; AZE, Azerbaijan; CHN, China; GEO, Georgia; IRQ, Iraq; IRN, Islamic Republic of Iran; KAZ, Kazakhstan; KGZ, Kyrgyzstan; PAK, Pakistan; SYR, Syrian Arab Republic; TJK, Tajikistan; TKM, Turkmenistan; TUR, Türkiye; UZB, Uzbekistan. b, SNP-based phylogeny of the non-redundant Ae. tauschii accessions showing the subpopulations within the three lineages as labelled on the tree. Accessions sequenced with PacBio HiFi are indicated by black dots next to the tree branches. The three reference accessions TA10171 (L1), TA1675 (L2) and TA2576 (L3) are indicated by black arrows. The D subgenome from 59 wheat landraces is shown in relation to Ae. tauschii. c, Linear chromosome representation showing structural variants, nucleotide diversity and annotation features across the Ae. tauschii panel and genomes relative to the TA1675 L2 reference assembly. The tracks show (i) mean structural variant density in 10 Mb windows for L1 (yellow), L2 (blue) and L3 (orange) accessions of the 46 high-quality assemblies (range 0–800 structural variants), (ii) nucleotide diversity in 10-kb windows across the diversity panel of 493 non-redundant Ae. tauschii accessions (π = 0–0.0045), (iii) repeat density in TA1675 in 10-Mb windows (range 1–10 million repeat-masked nucleotides), and (iv) gene density in TA1675 in 10-Mb windows (range 0–350 high-confidence genes).
Fig. 2
Fig. 2. Haplotype analyses and cloning of a disease resistance gene.
a, Effect of assembly quality on association genetics. Significantly associated k-mers for resistance to Pgt race QTHJC mapped to two Ae. tauschii TA1662 assemblies (top, low-quality, contig N50 = 196 kb (ref. ); bottom, high-quality, contig N50 = 58.21 Mb (this study)). The chromosome arm 1DS disequilibrium block contains the stem rust resistance gene SrTA1662 (renamed Sr66). b, Different Mla haplotypes reflected by analysis of resistance gene analogues (RGA) in Ae. tauschii CPI 110799 (Sr33 donor), AUS 18913, AUS 18911 and TA1662 (SrTA1662 donor). Boxes indicates genes; + indicates pseudogenes. Alleles are indicated by matching colour and position. The locus is flanked by subtilisin-chymotrypsin inhibitor (CI, grey) and pumilio (Bpm, black) genes. Unrelated genes present in this region are omitted. Locus length and gene distribution are not drawn to scale. c, k-mer-based genome-wide association study (GWAS) with Pt race BBBDB mapped to the Ae. tauschii TA1675 assembly. The chromosome arm 2D peak corresponds to leaf rust resistance locus LR39. The diagram shows the LR39 interval delimited by bi-parental mapping, flanked by markers Csq21 and Csq22, and markers Csq8 and Csq25-Csq30 co-segregating with LR39. Arrows indicate candidate genes. d, Effects of VIGS on susceptibility to leaf rust. AL8/78, susceptible control; BSMV-γGFP, barley stripe mosaic virus (BSMV) expressing a GFP silencing construct (control); BSMV-γLrSi2, BSMV-γLrSi6 and BSMV-γLrSi7 are silencing constructs specific for the WTK gene. BSMV-γLrSi3 and BSMV-γLrSi8 are silencing construct specific for the NLR gene. Probe specificities were evaluated using the TA1675 assembly. Chlorosis in BSMV-γGFP controls represent virus symptoms. Scale bar, 1 cm. e, Gene structure of Lr39 (top) and domain architecture of the Lr39 protein (bottom). Grey boxes represent untranslated regions, orange boxes are exons and lines are introns. VIGS probes are indicated. R457I and C1023S indicate the two Lr39 amino acid changes between the TA1675 (resistant) and AL8/78 (susceptible) lines. MSP, major sperm protein domain.
Fig. 3
Fig. 3. Ae. tauschii L3 introgressions in bread wheat.
a, Diagram of the Missing Link Finder pipeline. An Ae. tauschii L3-specific k-mer set (769 million L3-specific k-mers; blue circle) was compared to individual sample k-mer sets generated from more than 80,000 genotyped wheat accessions (green circles). The result is indicated as normalized Jaccard indices. b, Distribution of normalized Jaccard scores across 82,154 wheat accessions. The horizontal dotted line indicates the two-fold threshold. The 139 synthetic hexaploid wheat lines with increased Jaccard indices have been removed and are shown in Extended Data Fig. 6a. c, The Jaccard indices show a gradual decline with increasing geographical distance from Georgia. Dots represent individual bread wheat accessions for which exact coordinates were available. Colours represent different normalized Jaccard indices corresponding to b. A full map is shown in Extended Data Fig. 6b. Eastern bread wheat accessions from Tajikistan with high Jaccard indices carry the same L3 introgression segments as bread wheat landraces from Georgia, indicating a common origin of the L3 haplotype blocks (Supplementary Table 18). d, Diagram of chromosome 1D in the wheat lines Chinese Spring, CDC Stanley and CWI 86942. Haplotype blocks corresponding to Ae. tauschii L1 are indicated in yellow, L2 is indicated in blue, and L3 is in orange. The black bars above the chromosome indicate the region shown in e. e, Diagram of a portion of the long arm of bread wheat chromosome 1D. Shown are different lengths of the L3 introgression segment in various bread wheat lines. The numbers correspond to the following accessions chosen for their diverse recombination patterns in this locus: (1) CWI 86929; (2) CWI 30140; (3) CWI 57175; (4) CWI 84686; (5) CWI 84704; (6) CWI 86481; (7) CDC Stanley.
Fig. 4
Fig. 4. Different Ae. tauschii subpopulations contributed to the hexaploid wheat D genome.
a, Proportions of Ae. tauschii subpopulations that make up the wheat D genome. Inner circles in solid colours represent the average proportions across 17 hexaploid wheat assemblies. The outer lighter circles represent the maximum proportion found across the 17 wheat genomes. The geographical location for each subpopulation was assigned on the basis of representative accessions. RUS, Russian Federation. b, Minimal number of hybridization events that gave rise to the extant bread wheat D genome. Diagrams show chromosomes 1D, 6D and 7D in Chinese Spring. The coloured boxes along the chromosomes represent the haplotypes present in Chinese Spring. Coloured rectangles above the chromosomes represent alternative haplotype blocks identified across 126 hexaploid wheat landraces (cumulative length of alternative haplotype blocks across all 126 landraces). Colours refer to the Ae. tauschii subpopulations. The maximum number of haplotype blocks was four. Black boxes highlight the regions on chromosome 3D and 7D in which four overlapping haplotypes are found.
Extended Data Fig. 1
Extended Data Fig. 1. Aegilops tauschii genomic resources.
a, Clustered heatmap showing SNP-based pairwise identity across 957 Ae. tauschii accessions and 59 bread wheat landraces. The different Ae. tauschii subpopulations are indicated on the left. b, Logarithmic curve fit to k-mer accumulation across the 46 Ae. tauschii accessions selected for high-quality genome assemblies. The vertical bars show the standard deviation. c, k-mer frequency distributions across 920 Ae. tauschii accessions. The red curve shows k-mers that are absent in the 46 accessions selected for high-quality genome assemblies. The blue curve shows k-mers present in the 46 accessions. The peaks at ~250 and ~600 correspond to L2 and L1-specific k-mers, respectively. A square root function was applied to the y-axis for better visualization. d, Number of structural variants across Ae. tauschii accessions from lineages 1, 2 and 3 relative to the chromosome-scale assembly of L2 accession TA1675. Shown are duplications (DUP), deletions (DEL), and insertions (INS) ranging from 50 bp to 100 kb.
Extended Data Fig. 2
Extended Data Fig. 2. Ae. tauschii population structure from K = 2 to K = 9.
Each vertical bar represents an accession and the bars are filled by colours representing the proportion of each ancestry. The subpopulation designations are described in the main text. BW = bread wheat.
Extended Data Fig. 3
Extended Data Fig. 3. Chromosome contact maps of Ae. tauschii accessions TA10171 (a), TA1675 (b), TA2576 (c), and bread wheat accession CWI 86942 (d).
Green boxes represent individual PacBio contigs. Blue boxes indicate chromosomes. Chromosome 7D of TA1675 was assembled as a single PacBio contig.
Extended Data Fig. 4
Extended Data Fig. 4. Haplotype analysis leads to the designation of stem rust resistance gene Sr66.
a, Phylogeny showing the relationship across Mla genes from Ae. tauschii and barley. Resistance Gene Analogs (RGA) represent Ae. tauschii and Resistance Gene Homologs (RGH) represent barley cultivar Morex. The Ae. tauschii RGA gene sequences were derived from different accessions (Supplementary Table 10). RGA/RGH families 1, 2 and 3 are indicated in blue, red and green, respectively. The tree was constructed using the unweighted UPGMA algorithm. Bootstrap support values are shown based on 5,000 replicates. b, SrTA1662 (Sr66) and Sr33 display different race specificities. Reactions to Puccinia graminis f. sp. tritici isolates KE17c-21 (race TTKTF), IT16a-19 (TTRTF), and KE305b-17 (TTKSK) of transgenic SrTA1662 (Sr66) wheat lines and non-transgenic nulls (1 to 6) and wheat Sr gene introgression lines and controls (7 to 13). 1, Fielder null (DPRM0050); 2, Sr66 (DPRM0051); 3, Sr66 (DPRM0059); 4, Fielder null (DPRM0062); 5, Sr66 (DPRM0071); 6, Fielder null (DPRM0072); 7. Sr45 (RL5406); 8. Sr33 (RL5405); 9. Sr24 (LcSr24Ag); 10. Sr31 (Little Club/Agent (CI 13523)); 11. Sr39 (RL5711); 12. Sr33 (Chinese Spring); 13. cv. Morocco.
Extended Data Fig. 5
Extended Data Fig. 5. Bi-parental genetic mapping of LR39 and analysis of key conserved domains in Lr39.
a, Phenotypes of Ae. tauschii parents inoculated with the Puccinia triticina race Pt 26-1,3 (accession 316). CPI110672 (synonymous TA1675) carries Lr39. CPI110717 is the susceptible parent. Scale bar = 1 cm. b, Fine mapping of LR39 in chromosome arm 2DS. Markers Csq21 and Csq22 are flanking the LR39 locus whereas Csq8, Csq25, Csq26, Csq27, Csq28, Csq29 and Csq30 are co-segregating. c, Fungal biomass quantification using qPCR after virus-induced gene silencing (VIGS). Cereal rust specific primers amplifying the 28 S large subunit region (LSU - blue) or the internal transcribed spacer 1 (ITS1 - red) were used. Values represent means and error bars standard errors. Statistical analyses were done using a two tailed t-test against the TA1675 γGFP control. BSMV-γLrSi2, BSMV-γLrSi6, and BSMV-γLrSi7 are silencing constructs specific for the WTK gene. BSMV-γLrSi3 and BSMV-γLrSi8 are silencing construct specific for the NLR gene. N = 5 independent biological replicates. Scale bar = 5 cm. d, Analysis of key conserved domains of the Lr39 protein. The kinase 1 domain is highlighted by a green box, kinase 2 by a yellow box, the major sperm protein (MSP) domain by a pink box, and the seven WD40-repeats are underlined by blue lines. Roman numerals represent conserved kinase subdomains. Black triangles = ATP binding site predicted by InterPro; magenta triangles = key conserved residues; black asterisks = putative substrate binding site; blue squares = residue determining RD and non-RD kinases; brown triangles = polymorphism in the key conserved residues. In kinase 1, a key residue histidine is replaced by arginine in subdomain VI. In kinase 2, substitutions of residues glutamic acid to methionine in subdomain III, aspartic acid to serine and asparagine to histidine in subdomain VI form a catalytic loop, and aspartic acid to glycine in subdomain VII in the activation loop. Yellow pentagons = key conserved residues of WD40 repeats predicted by InterPro. Cyan hexagon = two polymorphic residues of TA1675 compared to AL8/78.
Extended Data Fig. 6
Extended Data Fig. 6. Tracing lineage-specific Ae. tauschii haplotype blocks in bread wheat.
a, Normalized Jaccard scores across 82,293 wheat accessions (including the 139 synthetic hexaploid wheats). Green indicates 139 synthetic hexaploid wheat accessions with k-mer enrichments of up to 40-fold. Red indicates bread wheat landraces with increased (2 to 3-fold) normalized Jaccard index. b, The Jaccard indices show a gradual decline with increasing geographic distance from Georgia. Dots represent individual bread wheat accessions for which exact coordinates were available. Colors represent different normalized Jaccard indices. c, Correlation between normalized Jaccard indices and the percentage of L3 genome based on whole-genome sequencing data. d, Diagram of a portion of chromosome arm 1DS. The chromosome positions indicated in Mb are according to the CWI 86942 assembly. Haplotype blocks corresponding to Ae. tauschii L2 are indicated in blue, and L3 in orange. Shown are different lengths of the L3 haplotype segment in various bread wheat lines. 1, CWI 84680, CWI 84694, CWI 84704, CWI 84686, CWI 14537, GEO-L1, WATDE0105, WATDE0944, WATDE0957, WATDE1005, WATDE1018, WATDE1017, WATDE0113, WATDE1010; 2, C33, WATDE1031, WATDE1032; 3, BW 50849, CWI 14244, CWI 28055, WATDE0026, WATDE0749, WATDE0047, WATDE0739, WATDE0999, WATDE1003, WATDE0993; 4, CWI 86929, CWI 86942, WATDE0975, WATDE0973, WATDE0974. The IBSpy variation values for the Watkins lines (WATDE) were extracted from Cheng et al..
Extended Data Fig. 7
Extended Data Fig. 7. Minimal number of hybridizations that gave rise to the extant bread wheat D genome.
Shown are graphical representations of Chinese Spring chromosomes 2D, 3D, 4D and 5D. The colored boxes in the chromosomes represent the haplotypes found in Chinese Spring. Colored rectangles above the chromosomes represent alternative haplotype blocks identified across 126 hexaploid wheat landraces (cumulative length of alternative haplotype blocks across all 126 landraces). Colors refer to the Ae. tauschii subpopulations following the legend. The maximum number of haplotype blocks is four.
Extended Data Fig. 8
Extended Data Fig. 8. SNP data statistics.
a, The percentage of polymorphic sites for each Ae. tauschii accession compared to the TA1675 (L2) reference accession. Each color represents an Ae. tauschii or bread wheat group. b, SNP density in windows of 1 Mb computed across the 7 chromosomes of TA1675. c, Allele frequency distribution.
Extended Data Fig. 9
Extended Data Fig. 9. IBSpy variation score distribution.
Shown are the average variation scores for each Ae. tauschii accession (represented as a dot) against TA10171 (L1) (a), TA1675 (L2) (b), and TA2576 (L3) (c) (Supplementary Table 32). Based on the distribution, we defined IBSpy values ≤ 30 as identical by state, values > 30 ≤ 250 as being the same Ae. tauschii lineage as the reference, values > 250 ≤ 500 as being a different Ae. tauschii lineage, and values > 500 as not being Ae. tauschii.

References

    1. Dubcovsky, J. & Dvorak, J. Genome plasticity a key factor in the success of polyploid wheat under domestication. Science316, 1862–1866 (2007). - PMC - PubMed
    1. Zhou, Y. et al. Triticum population sequencing provides insights into wheat adaptation. Nat. Genet.52, 1412–1422 (2020). - PubMed
    1. Tadesse, W. et al. Genetic gains in wheat breeding and its role in feeding the world. Crop Breed. Genet. Genom.1, e190005 (2019).
    1. Marcussen, T. et al. Ancient hybridizations among the ancestral genomes of bread wheat. Science345, 1250092 (2014). - PubMed
    1. Wang, J. et al. Aegilops tauschii single nucleotide polymorphisms shed light on the origins of wheat D‐genome genetic diversity and pinpoint the geographic origin of hexaploid wheat. New Phytol.198, 925–937 (2013). - PubMed