. 2024 Sep;633(8031):923-931.
doi: 10.1038/s41586-024-07812-3. Epub 2024 Aug 14.

Mitochondrial complex I promotes kidney cancer metastasis

Affiliations

Mitochondrial complex I promotes kidney cancer metastasis

Divya Bezwada et al. Nature. 2024 Sep.

Abstract

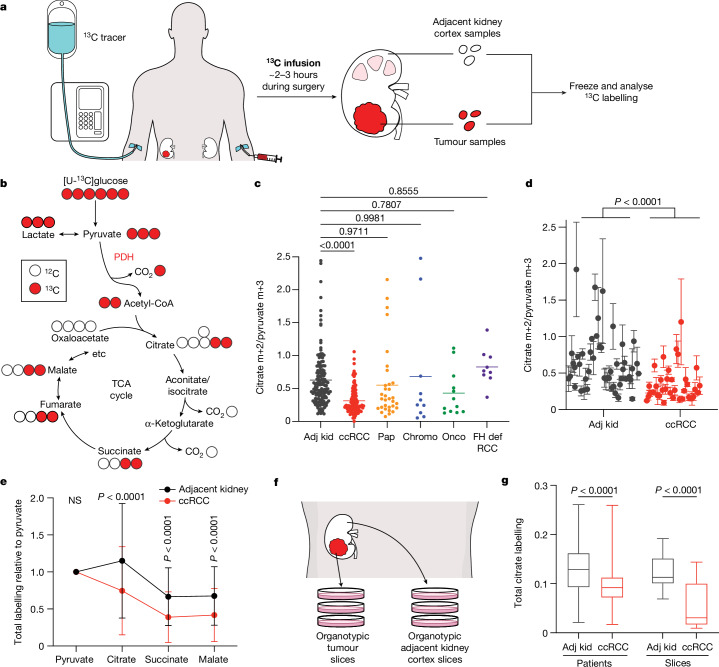
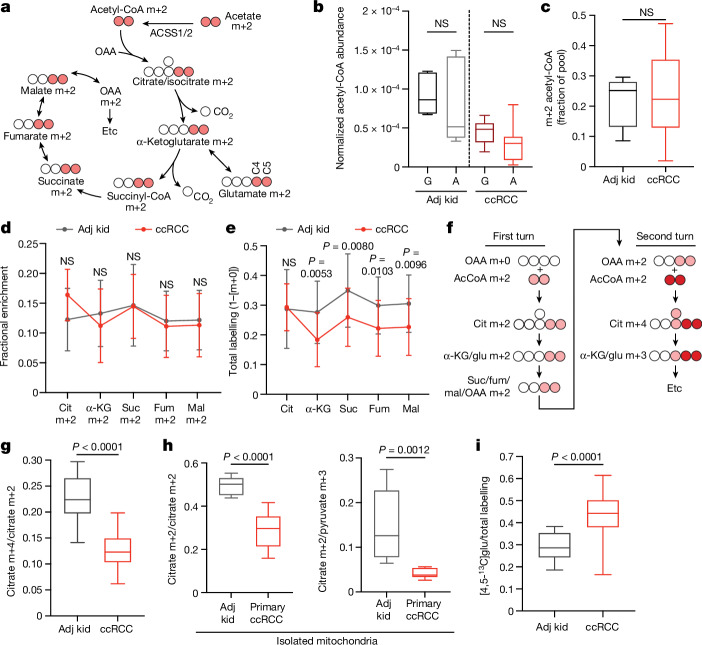
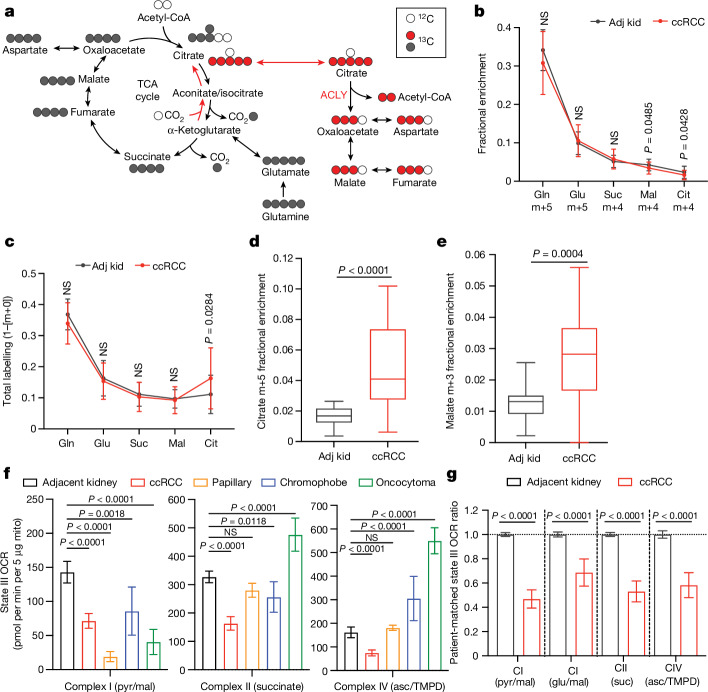
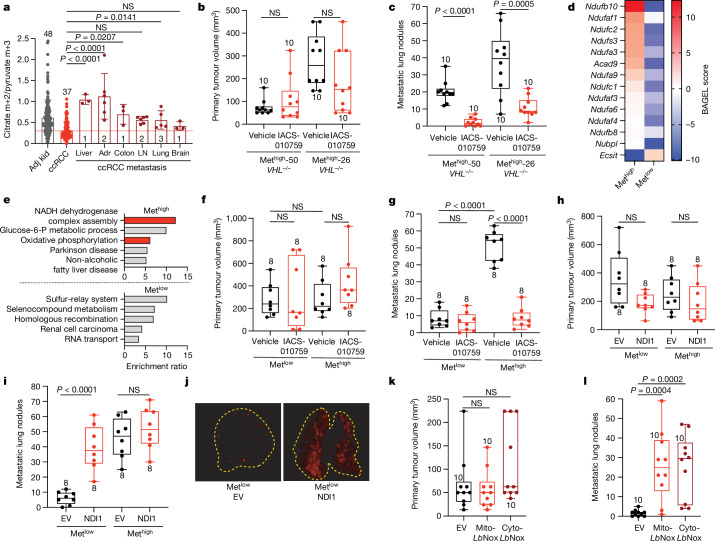
Most kidney cancers are metabolically dysfunctional1-4, but how this dysfunction affects cancer progression in humans is unknown. We infused 13C-labelled nutrients in over 80 patients with kidney cancer during surgical tumour resection. Labelling from [U-13C]glucose varies across subtypes, indicating that the kidney environment alone cannot account for all tumour metabolic reprogramming. Compared with the adjacent kidney, clear cell renal cell carcinomas (ccRCCs) display suppressed labelling of tricarboxylic acid (TCA) cycle intermediates in vivo and in ex vivo organotypic cultures, indicating that suppressed labelling is tissue intrinsic. [1,2-13C]acetate and [U-13C]glutamine infusions in patients, coupled with measurements of respiration in isolated human kidney and tumour mitochondria, reveal lower electron transport chain activity in ccRCCs that contributes to decreased oxidative and enhanced reductive TCA cycle labelling. However, ccRCC metastases unexpectedly have enhanced TCA cycle labelling compared with that of primary ccRCCs, indicating a divergent metabolic program during metastasis in patients. In mice, stimulating respiration or NADH recycling in kidney cancer cells is sufficient to promote metastasis, whereas inhibiting electron transport chain complex I decreases metastasis. These findings in humans and mice indicate that metabolic properties and liabilities evolve during kidney cancer progression, and that mitochondrial function is limiting for metastasis but not growth at the original site.


Conflict of interest statement

R.J.D. is a founder and advisor at Atavistik Bio, and serves on the Scientific Advisory Boards of Agios Pharmaceuticals, Vida Ventures and Droia Ventures. I.P. has served on Scientific Advisory Boards of Health Tech International, Merck and Otsuka, and is co-inventor of patents with Philips Healthcare. K.D.C. participated on an Advisory Board for Novartis. G.G. serves on the Advisory Board of Medendi.

Figures

Fig. 1
Fig. 1. Glucose metabolism varies among kidney cancer subtypes.
a, Schematic of intraoperative infusions. b, Isotopologue labelling in the TCA cycle from [U-13C]glucose via PDH. c, Citrate m+2/pyruvate m+3 ratio from [U-13C]glucose-infused patients. Each point reflects one tissue fragment (138 adjacent kidney (Adj kid) fragments from 48 patients, 109 ccRCC fragments from 37 patients, 32 papillary RCC (Pap) tissue fragments from 11 patients, 10 chromophobe RCC (Chromo) fragments from 4 patients, 12 oncocytoma (Onco) fragments from 4 patients, and 9 FH-deficient RCC (FH def RCC) fragments from 3 patients). d, Nested analysis of citrate m+2/pyruvate m+3 ratios separated by patient. Each data point represents a different patient. Error bars reflect the standard deviation from three fragments, tissue permitting, from the same patient. n = 48 patients for adjacent kidney and 37 patients for ccRCC. e, Total isotopologue labelling (1 − [m+0]) of TCA cycle intermediates divided by total isotopologue labelling of pyruvate. n = 48 patients for adjacent kidney and 37 patients for ccRCC. f, Schematic of organotypic cultures. Approximately 300-μm tissue sections were cultured on polytetrafluoroethylene inserts in 5% O2. g, Total citrate labelling (1 − [m+0]) from [U-13C]glucose in patients or tissue slices after 3 h of labelling. n = 48 patients for adjacent kidney, 37 patients for ccRCC, and 6 patients for adjacent kidney and ccRCC slices. All data represent mean ± s.d. Whiskers of box plots indicate minimum and maximum values. Statistical significance was assessed using a one-way analysis of variance (ANOVA) with a multiple comparison adjustment using Tukey’s methods (c), nested two-sided t-test (d) or unpaired two-sided t-tests with a Benjamini–Hochberg’s multiple comparison adjustment (e,g). Significant P values are indicated on figure panels. NS, not significant (P > 0.05). Source Data
Fig. 2
Fig. 2. TCA cycle metabolism is suppressed in ccRCCs.
a, Isotopologue labelling from [1,2-13C]acetate. ACSS1/2, acetyl-CoA synthetase 1 or 2; OAA, oxaloacetate. b, Total ion count-normalized acetyl-CoA abundance after infusion with [U-13C]glucose (G) or [1,2-13C]acetate (A). For [U-13C]glucose infusions, n = 6 adjacent kidney fragments from 2 patients and 10 ccRCC fragments from 4 patients. For [1,2-13C]acetate infusions, n = 15 adjacent kidney fragments from 5 patients and 32 ccRCC fragments from 12 patients. c, Enrichment of m+2 acetyl-CoA in adjacent kidney and ccRCC. n = 15 adjacent kidney fragments from 5 patients and 31 ccRCC fragments from 12 patients. d, m+2 isotopologues of TCA cycle intermediates from patients infused with [1,2-13C]acetate. Cit, citrate; fum, fumarate; mal, malate; suc, succinate. e, Total labelling (1 − [m+0]) of TCA cycle intermediates from [1,2-13C]acetate-infused patients. n = 15 adjacent kidney fragments from 5 patients and 33 ccRCC fragments from 12 patients (d,e). f, 13C labelling from [1,2-13C]acetyl-CoA through two TCA cycle turns. AcCoA, acetyl-CoA; glu, glutamate. g, Citrate m+4/citrate m+2 ratios from adjacent kidney and ccRCC. n = 15 adjacent kidney fragments from 5 patients and 33 ccRCC fragments from 12 patients. h, Citrate m+4/citrate m+2 and citrate m+2/pyruvate m+3 ratios from mitochondria isolated from adjacent kidney or ccRCC. n = 9 fragments from 3 patients for both adjacent kidney and ccRCC. i, [4,5-13C]glutamate ([4,5-13C]glu) labelling as a fraction of total glutamate labelling after infusion with [1,2-13C]acetate. n = 18 adjacent kidney fragments from 5 patients and 81 ccRCC fragments from 12 patients. All data represent mean ± s.d. Whiskers of box plots are minimum and maximum values. Statistical significance was assessed using unpaired two-sided parametric t-tests (be,gi). A Benjamini–Hochberg’s multiple comparison adjustment was made in panels d,e. Significant P values are indicated on the figure panels. Source Data
Fig. 3
Fig. 3. ccRCC mitochondria have low oxidative metabolism.
a, Isotopologue labelling from [U-13C]glutamine. Labelling from oxidative metabolism is indicated in grey, whereas reductive metabolism is indicated in red. b, TCA cycle intermediate isotopologues from [U-13C]glutamine metabolism through the first oxidative TCA cycle turn. Gln, glutamine. c, Total labelling (1 − [m+0]) of TCA cycle intermediates from patients with ccRCC infused with [U-13C]glutamine. d, Fractional enrichment of m+5 citrate. e, Fractional enrichment of m+3 malate. n = 21 fragments from 7 patients for adjacent kidney and 54 fragments from 7 patients for ccRCC (be). f, State III ADP-stimulated OCRs from mitochondria isolated from primary human tissues. Substrates used to stimulate respiration are indicated in parentheses. n = 92 replicates from 21 patients for adjacent kidney, 74 replicates from 21 patients for ccRCC, 24 replicates from 3 patients for chromophobe RCC, 16 replicates from 3 patients for oncocytoma and 16 replicates from 3 patients for papillary RCC. Asc, ascorbate; pyr, pyruvate; TMPD, N,N,N,N-tetramethyl-p-phenylenediamine. g, OCRs from ccRCC mitochondria normalized to the patient-matched adjacent kidney. n = 54 replicates from 12 patients for adjacent kidney and 54 replicates from 12 patients for ccRCC. Statistical significance was assessed using unpaired two-sided parametric t-tests (be,g), and a one-way ANOVA with a multiple comparison adjustment using Tukey’s methods (f). A Benjamini–Hochberg’s multiple comparison adjustment was made in panels b,c,g. Whiskers of box plots (d,e) represent minimum and maximum values. Error bars represent s.d. (b,c) and mean ± 95% CI (f,g). Significant P values are indicated on the figure panels. Source Data
Fig. 4
Fig. 4. Complex I is required for efficient metastasis in mice.
a, Citrate m+2/pyruvate m+3 ratio from patients infused with [U-13C]glucose. ccRCC metastases to different organs are in brown. For metastases, the number of patients is indicated on each bar and individual fragments are shown. Data for adjacent kidney and primary ccRCCs are from Fig. 1c. The red dotted line indicates the citrate m+2 to pyruvate m+3 mean for primary ccRCC. Adr, adrenal gland; LN, lymph node. b,c, Primary tumours (b) and metastatic lung nodules (c) 21 days after introduction of VHL−/− cells into the renal capsule and treatment with vehicle or IACS-010759. d, BAGEL scores for complex I genes essential for either Methigh or Metlow proliferation. e, Gene ontology enrichment ratios for Methigh and Metlow cells; the red bars are related to the ETC. f,g, Primary tumours (f) and metastatic lung nodules (g) treated with vehicle or IACS-010759 for 21 days. h,i, Primary tumours (h) and metastatic lung nodules (i) from Methigh or Metlow cells expressing an empty vector (EV) or NDI1. j, Representative images of Metlow metastasis-bearing lungs expressing empty vector or NDI1. Original images are provided in Supplementary Data. k,l, Primary tumours (k) and metastatic lung nodules (l) from Methigh or Metlow cells expressing empty vector, mito-LbNOX or cyto-LbNOX. The number of mice per group is indicated on the figure panels (b,c,fi,kl). All data represent mean ± s.d. The whiskers of box plots represent minimum and maximum values. Statistical significance was assessed using a one-way ANOVA with a multiple comparison adjustment using Dunnett’s method (a) and unpaired two-sided parametric Student’s t-tests (b,c,fi,kl). Significant P values are indicated on the figure panels. Source Data
Fig. 5
Fig. 5. Elevated mitochondrial gene expression correlates with worse survival in human ccRCC.
a, OxPhos scores for grade 1/2 tumours versus grade 3/4 tumours. Medians for each group are indicated by colour-coded dashed lines. OxPhos score calculations are described in the Methods. b,c, Kaplan–Meier survival curve of grade 3/4 tumours with level 1 or 2 staging (a primary tumour less than 7 cm confined to the kidney; b) or grade 3/4 tumours with level 3 or 4 staging (a primary tumour more than 7 cm or evidence of metastasis; c) classified by OxPhos score. d, Kaplan–Meier survival curve of patients from the TCGA KIRC dataset classified by mtDNA copy number (top 30% indicates mtDNA high; bottom 30% denotes mtDNA low). The number of patients in each group is indicated on the panels. Statistical significance was assessed using a two-sided Mann–Whitney rank test (a) and log-rank (Mantel–Cox) tests (bd). P values are indicated on the panels. Source Data
Extended Data Fig. 1
Extended Data Fig. 1. Clinical cohort reflects heterogenous ccRCC biology.
Plasma m+6 glucose enrichment from patients infused with [U-13C]glucose separated by (a) kidney cancer subtype or (b) continuous infusion rate. The number of patients per group is indicated on the graph. (c) Correlation of RNA sequencing data from the TCGA KIRC cohort reporting ccRCC tumours versus ccRCC tumours infused with [U-13C]glucose reported in this study. Data are plotted as the effect size (Cohen’s d) reflecting the increase (d > 0) or decrease (d < 0) in mRNA abundance in tumours relative to adjacent kidney. Genes involved in glycolysis and the electron transport chain (ETC) are highlighted. (d) Matched citrate m+2/pyruvate m+3 ratio from patients infused with [U-13C]glucose. The x-axis indicates 28 patients in whom both tumour and kidney tissue were available. Patients in whom the average citrate m+2/pyruvate m+3 ratio was higher in ccRCC tissue are highlighted in grey boxes; this difference reached statistical significance only in patient 28. (e) Total labeling relative to plasma glucose m+6 and (f) plasma pyruvate m+3 for TCA cycle metabolites. (48 patients for adjacent kidney, 37 patients for ccRCC.) (g) Fractional enrichment in m+1 TCA cycle isotopologues. (48 patients for adjacent kidney, 37 patients for ccRCC.) (h) Enrichment in glycolytic and TCA cycle intermediates associated with glucose oxidation for ccRCC and papillary tumours. Labelling is normalized to the matched adjacent kidney (28 ccRCC patients, 9 papillary RCC patients). (i) Total malate labeling (1-[m+0]) from [U-13C]glucose in patients or tissue slices after 3 h of labeling (48 patients for adjacent kidney, 37 patients for ccRCC, 6 patients for adjacent kidney and ccRCC slices). All data represent mean ± standard deviation. Statistical significance was assessed using one way analysis of variance (ANOVA) with a multiple comparison adjustment using Tukey’s methods, (a) or two-sided unpaired t-tests (b, d-i). A Benjamini-Hochberg’s multiple comparison adjustment was made for d-i. Significant P values are indicated or ns = not significant (P > 0.05) on panels (a, b, e-i). ns = not significant (P > 0.05), *P < 0.05, **P < 0.01. Adj Kid = adjacent kidney, ccRCC = clear cell renal cell carcinoma, Pap = papillary renal cell carcinoma, Chromo = chromophone renal cell carcinoma, Onco = oncocytoma, FH def. RCC = FH deficient renal cell carcinoma. Gluc = glucose, 3PG = 3-phosphoglycerate, Lac = lactate, Pyr = pyruvate, Cit = citrate, Suc = succinate, Mal = malate, Glu = glutamate, Asp = aspartate. Source Data
Extended Data Fig. 2
Extended Data Fig. 2. mRNA abundance of ETC and glycolysis genes in primary ccRCC tumours.
(a) mRNA abundance for genes related to glycolysis and the electron transport chain (ETC) in the TCGA KIRC cohort and the cohort infused with [U-13C]glucose in this study. The ETC genes were selected from the gene ontology cellular component (cc) library combining complex I-IV genes. The glycolysis genes are shared genes among the following four gene sets: KEGG_GLYCOLYSIS_GLUCONEOGENESIS, REACTOME_GLYCOLYSIS, HALLMARK_GLYCOLYSIS, WP_GLYCOLYSIS_AND_GLUCONEOGENESIS. Source Data
Extended Data Fig. 3
Extended Data Fig. 3. Consistency of metabolomics data between this cohort and a published cohort from a different center.
(a) Correlation of metabolomics data from a published cohort with metabolomics from this study. Data are plotted as the effect size (Cohen’s d) reflecting the increase (d > 0) or decrease (d < 0) in metabolite abundance in ccRCC tumours relative to the adjacent kidney. Source Data
Extended Data Fig. 4
Extended Data Fig. 4. Glutamate enrichment in [1,2-13C]acetate-infused patients.
(a) Total labeling (1-[m+0]) of glutamate from ccRCC patients infused with [1,2-13C]acetate (18 fragments from 5 patients for adjacent kidney, 81 fragments from 12 ccRCC patients). (b) Fractional enrichment of glutamate m+2 from ccRCC patients infused with [1,2-13C]acetate (15 fragments from 5 patients for adjacent kidney, 32 fragments from 12 ccRCC patients). All panels show mean ± standard deviations. Statistical significance was assessed using two-sided unpaired t-tests (a,b). Significant P values are indicated on figure panels. ns = not significant (P > 0.05). Adj Kid = adjacent kidney, ccRCC = clear cell renal cell carcinoma. Source Data
Extended Data Fig. 5
Extended Data Fig. 5. Metabolite labeling in plasma and tissues of patients infused with [U-13C]glutamine.
(a) Citrate isotopologue distributions in [U-13C]glutamine-infused tissues (21 fragments from 7 patients for adjacent kidney, 54 fragments from 7 patients for ccRCC). (b) Fractional abundance of citrate m+5 in plasma at the time of resection and in ccRCC tumour tissue samples (Plasma samples from 7 patients, 54 ccRCC tissue samples from 7 patients). (c) Malate isotopologue distributions in [U-13C]glutamine-infused tissues (21 fragments from 7 patients for adjacent kidney, 54 fragments from 7 patients for ccRCC). All data reflect mean ± standard deviations. The mean is indicated in panel b. Statistical significance was assessed using unpaired t-tests with a Benjamini-Hochberg’s multiple comparison adjustment (a-c). Significant P values are indicated on figure panels. ns = not significant (P > 0.05). ccRCC = clear cell renal cell carcinoma. Source Data
Extended Data Fig. 6
Extended Data Fig. 6. Respiration of mitochondria from primary human kidney cancers.
(a) Respiratory control ratio (RCR) for mitochondria from the adjacent kidney and ccRCCs. RCR is the ratio of the State III ADP-stimulated oxygen consumption rate (OCR) to the State IV basal OCR. (49 adjacent kidney replicates from 12 patients, 17 ccRCC replicates from 5 patients). (b) State III ADP-stimulated OCR from mitochondria isolated from primary human tissues, using glutamate and malate to stimulate complex I. (91 replicates from 21 patients for adjacent kidney, 74 replicates from 21 patients for ccRCC, 21 replicates from 3 patients for chromophobe RCC, 16 replicates from 3 patients from oncocytoma, and 16 replicates from 3 patients for papillary RCC). (c) State IV basal OCR from mitochondria isolated from primary human tissues. Injected substrates are indicated under each complex. (92 replicates from 21 patients for adjacent kidney, 74 replicates from 21 patients for ccRCC, 21 replicates from 3 patients for chromophobe RCC, 16 replicates from 3 patients from oncocytoma, and 16 replicates from 3 patients for papillary RCC). (d) Respiratory control ratio (RCR) for chromophobe RCCs and oncocytomas (52 adjacent kidney samples from 12 patients, 16 oncocytoma samples from 3 patients, 16 chromophobe samples from 3 patients). Panels a-c show mean ± 95% confidence intervals, and panel d shows mean ± standard deviation. Statistical significance was assessed using an unpaired two-sided parametric t-test with a Benjamini-Hochberg’s multiple comparison adjustment (a) or one way analysis of variance (ANOVA) with a multiple comparison adjustment using Tukey’s methods (b-d). Significant P values are indicated on figure panels. ns = not significant (P > 0.05). pyr = pyruvate, mal = malate, glu = glutamate, asc = ascorbate, TMPD = N,N,N,N-tetramethyl-p-phenylenediamine. Source Data
Extended Data Fig. 7
Extended Data Fig. 7. Metabolic and molecular characteristics of primary and metastatic ccRCCs.
(a) Citrate m+2/pyruvate m+3 ratio from two patients infused with [U-13C]glucose who had a primary ccRCC and synchronous metastasis to the adrenal gland removed during the same infusion and surgery. (b) Total citrate labeling (1-[m+0]) from a patient infused with [1,2-13C]acetate who had ccRCC metastases at two organ sites. (15 fragments from 5 patients for adjacent kidney, 33 fragments from 12 patients for ccRCC, 6 fragments from two metastases from 1 patient). (c) Scaled expression of genes in the HALLMARK_HYPOXIA gene set from the adjacent kidney (44 patients), primary ccRCC (25 patients), and metastatic ccRCC tumours (15 patients). (d) Log2(CPM) expression of VHL in the adjacent kidney (44 patients), primary ccRCC (25 patients), and metastatic ccRCC tumours (15 patients). (e) Estimation of STromal and Immune cells in MAlignant Tumour tissues using Expression data (ESTIMATE) estimation of immune and (f) stromal infiltrate and (g) tumour cell purity (ESTIMATE score) in primary and metastatic ccRCC tumours from RNA sequencing data. (22 patients for primary tumours, 15 patients for metastatic tumours). Statistical significance was assessed with a one-way analysis of variance (ANOVA) with a multiple comparison adjustment using Tukey’s methods (a, d) or an unpaired two-sided parametric t-test (b, e-g). Significant P values are indicated on figure panels. ns = not significant (P > 0.05). Adj Kid = adjacent kidney, ccRCC = clear cell renal cell carcinoma, CPM = counts per million. Source Data
Extended Data Fig. 8
Extended Data Fig. 8. ETC complex I drives spontaneous metastasis of renal cell carcinoma in mice.
(a) and (b) Representative images of metastasis-bearing lungs from vehicle and IACS-010759-treated mice. (c) Oxygen consumption rate (OCR) of Metlow and Methigh cells. 12 replicates per cell line. (d) BAGEL scores for Methigh and Metlow cell proliferation CRISPR screen. Mitochondrially associated genes are indicated in red (n = 102, 25 for Metlow, 77 for Methigh), and all other genes are indicated in black (n = 17,975). Genes selectively essential for Metlow proliferation are in the top left quadrant, and genes selectively essential for Methigh proliferation are in the bottom right quadrant. (e) Representative images of orthotopic Methigh tumour-bearing kidneys treated with vehicle or IACS-010759. (f) Representative images of Methigh metastasis-bearing lungs treated with vehicle or IACS-010759. (g) Number of cells with Ki67-positive nuclei per high powered field (HPF). Data are from 5 HPF per mouse (5 mice per group, total 25 quantified fields per group). (h) Representative Ki67 staining of Methigh lung metastases treated with vehicle or IACS-010759 from panel g. Red arrows indicate Ki67-positive nuclei. (i) RT-qPCR of NDI1 expression in Metlow and Methigh cells. 3 replicates per group; control values were normalized to 1. (j) OCR of Metlow and (k) Methigh cells expressing EV or NDI1. 30 replicates for Methigh EV, 32 replicates for Methigh NDI1, 8 replicates for Metlow EV, 11 replicates for Metlow NDI1. (l) Total citrate labeling of Metlow and Methigh cells expressing EV or NDI1. 3 replicates per group. (m) Anti-FLAG western blot of Metlow cells expressing EV or FLAG-tagged cyto-LbNOX or mito-LbNOX. For gel source data, see Supplementary Fig. 1. Immunoblots were repeated two additional times with similar results. (n) Representative immunofluorescence imaging of HSP60 (for mitochondria), FLAG (for LbNOX), and merged images of HSP60 and FLAG for Metlow cyto-LbNOX and mito-LbNOX cells. Representative images were taken from ten images that showed similar results. (o) Representative images of Metlow metastasis-bearing lungs expressing EV, cyto-LbNOX, or mito-LbNOX. Statistical significance was assessed using unpaired two-sided t-tests (g, i, l). Original images for are provided in Supplementary Data (abefno). Panels c, j, and k, show mean ± standard error of the mean (S.E.M.), and panels h, i, and l show mean ± standard deviations. Significant P values are indicated on figure panels. ns = not significant (P > 0.05). EV = empty vector, cyto = cytosol, mito = mitochondria, OA = oligomycin, CCCP = carbonyl cyanide 3-chlorophenylhydrazone, R = rotenone. Source Data
Extended Data Fig. 9
Extended Data Fig. 9. ETC complex I drives metastatic colonization of human ccRCC cell lines in mice.
(a) RT-qPCR of NDI1 expression in 786-O and Caki-1 cells. 3 replicates per group; control values were normalized to 1. (b) OCR of 786-O and Caki-1 cells expressing EV or NDI1. 6 replicates for 786-O EV and NDI1, 8 replicates for Caki-1 EV and NDI1. (c) OCR of renal proximal tubule epithelial cells (RPTEC) and 786-O and Caki-1 cells. 12 replicates for RPTEC, 8 replicates for 786-O, 8 replicates for Caki-1. (d) Total citrate labeling of 786-O or (e) Caki-1 cells expressing EV or NDI1. 6 replicates for 786-O cells expressing EV or NDI1, 3 replicates for Caki-1 expressing EV or NDI1. (f) Total citrate labeling (1-[m+0]) from cells cultured with [U-13C]glucose for 6 h in RPMI with 5% dialyzed FBS. Labelling from non-small cell lung cancer (NSCLC) cell lines was previously published. 786-O data points reflect the average of 6 replicates and Caki-1 data points reflect the average of 3 replicates. (g) Metastatic burden in mice assessed with bioluminescence six weeks after tail vein injection of 786-O or (h) Caki-1 cells expressing EV or NDI1. 10 mice for 786-O EV, 7 mice for 786-O NDI1, 9 mice for Caki-1 EV, 10 mice for Caki-1 NDI1. Mice were excluded if signal was limited to the tail (3 mice for 786-O NDI1, 1 mouse for Caki1-EV). (i) Subcutaneous tumour volume of 786-O or (j) Caki-1 cells expressing EV or NDI1. 10 mice for 786-O EV, 9 mice for 786-O NDI1, 9 mice for Caki-1 EV, 9 mice for Caki-1 NDI1. Mice were excluded if euthanasia was required prior to endpoint or if mice died unexpectedly (1 per group for 786-O NDI1, Caki-1 EV, Caki-1 NDI1). (k) Representative immunofluorescence imaging of HSP60 (for mitochondria), FLAG (for LbNOX), and merged images of HSP60 and FLAG for 786-O cyto-LbNOX and mito-LbNOX cells. Representative images were taken from ten images that showed similar results. Original images are in Supplementary Data. (l) Anti-FLAG western blot of 786-O cells expressing EV or FLAG-tagged cyto-LbNOX or mito-LbNOX. For gel source data, see Supplementary Fig. 1. Immunoblots were repeated two additional times with similar results. (m) Subcutaneous tumour volume of 786-O cells expressing EV, cyto-LbNOX, or mito-LbNOX. 10 mice per group. (n) Metastatic burden in mice assessed with bioluminescence after tail vein injection with 786-O cells expressing EV, cyto-LbNOX, or mito-LbNOX. 10 mice per group. Panels a, d, e, g, h, and n show mean ± standard deviations and panels b and c show mean ± standard error of the mean (S.E.M.). The NSCLC mean is indicated on panel f. Statistical significance was assessed using unpaired two-sided t-tests (a, d, e, g, h, n). Significant P values are indicated on figure panels. EV = empty vector, cyto = cytosol, mito = mitochondria, OA = oligomycin, CCCP = carbonyl cyanide 3-chlorophenylhydrazone, R = rotenone. Source Data
Extended Data Fig. 10
Extended Data Fig. 10. Increased mitochondrial gene signatures in primary human ccRCC are associated with worse survival.
(a) OxPhos score from 7 matched ccRCC patients. OxPhos score calculations are described in the Methods. (b) mtDNA:nDNA ratio from adjacent kidney (AK), primary ccRCC (P), and metastastic ccRCC (M) from 7 patients. (c) Expression of genes in the OxPhos gene set used to calculate the OxPhos score. Samples are ordered according to the OxPhos score (highest to lowest). Statistical significance was assessed using one-way analysis of variance (ANOVA) with a multiple comparison adjustment using Tukey’s methods (b). Significant P values are indicated on figure panels. ns = not significant (P > 0.05). Adj kid = adjacent kidney, ccRCC = clear cell renal cell carcinoma. Source Data

Update of

Comment in

References

    1. Courtney, K. D. et al. Isotope tracing of human clear cell renal cell carcinomas demonstrates suppressed glucose oxidation in vivo. Cell Metab.28, 793–800.e2 (2018). - PMC - PubMed
    1. Davis, C. F. et al. The somatic genomic landscape of chromophobe renal cell carcinoma. Cancer Cell26, 319–330 (2014). - PMC - PubMed
    1. Ricketts, C. J. et al. The Cancer Genome Atlas comprehensive molecular characterization of renal cell carcinoma. Cell Rep.23, 313–326.e5 (2018). - PMC - PubMed
    1. Linehan, W. M. et al. Comprehensive molecular characterization of papillary renal-cell carcinoma. N. Engl. J. Med.374, 135–145 (2016). - PMC - PubMed
    1. Ivan, M. et al. HIFα targeted for VHL-mediated destruction by proline hydroxylation: implications for O2 sensing. Science292, 464–468 (2001). - PubMed

MeSH terms