. 2024 Sep;633(8029):442-450.
doi: 10.1038/s41586-024-07820-3. Epub 2024 Aug 14.

Recognition and control of neutrophil extracellular trap formation by MICL

Affiliations

Recognition and control of neutrophil extracellular trap formation by MICL

Mariano Malamud et al. Nature. 2024 Sep.

Abstract

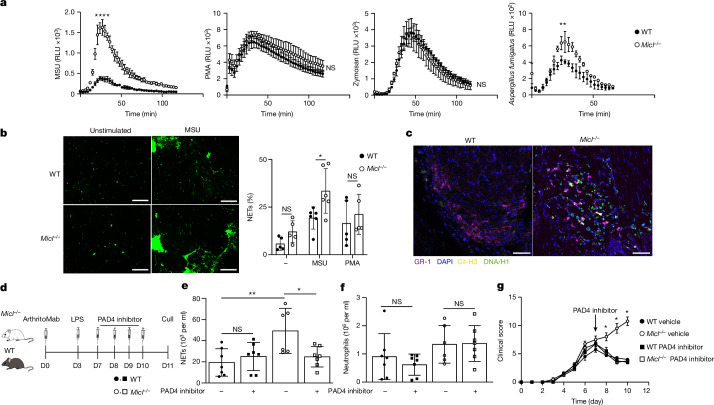
Regulation of neutrophil activation is critical for disease control. Neutrophil extracellular traps (NETs), which are web-like structures composed of DNA and neutrophil-derived proteins, are formed following pro-inflammatory signals; however, if this process is uncontrolled, NETs contribute to disease pathogenesis, exacerbating inflammation and host tissue damage1,2. Here we show that myeloid inhibitory C-type lectin-like (MICL), an inhibitory C-type lectin receptor, directly recognizes DNA in NETs; this interaction is vital to regulate neutrophil activation. Loss or inhibition of MICL functionality leads to uncontrolled NET formation through the ROS-PAD4 pathway and the development of an auto-inflammatory feedback loop. We show that in the context of rheumatoid arthritis, such dysregulation leads to exacerbated pathology in both mouse models and in human patients, where autoantibodies to MICL inhibit key functions of this receptor. Of note, we also detect similarly inhibitory anti-MICL autoantibodies in patients with other diseases linked to aberrant NET formation, including lupus and severe COVID-19. By contrast, dysregulation of NET release is protective during systemic infection with the fungal pathogen Aspergillus fumigatus. Together, we show that the recognition of NETs by MICL represents a fundamental autoregulatory pathway that controls neutrophil activity and NET formation.


Conflict of interest statement

The authors declare no competing interests.

Figures

Fig. 1
Fig. 1. MICL is required for control of neutrophil responses.
a, tSNE plots of CD45+ myeloid populations in the inflamed ankle joint during CAIA displayed as CD11b+ cells (grey), neutrophils (blue), Ly6Chigh cells (green), Ly6Clow cells (orange) and remaining antigen-presenting cells (APCs; pale violet). b, Myeloid cell populations (defined as shown in the gating strategy in Extended Data Fig. 1b) in the inflamed ankle joint during CAIA at day 7 are represented as a percentage of total live cells (pooled data from two independent experiments with four mice per group per experiment). WT versus Micl−/− neutrophils P < 0.0001. c, Schematic representation of the anti-Ly6G-mediated neutrophil depletion strategy in the CAIA model. D0, day 0; LPS, lipopolysaccharide. d, Quantification of neutrophils (CD45+CD11b+F4/80SSChigh) in the peripheral blood at day 9 by flow cytometry (n = 1 experiment with 3 mice per group). Isotype versus anti-Ly6G WT P = 0.0035 and Micl−/− P = 0.0021. e, Severity scoring of WT and knockout (Micl−/−) mice treated with isotype or anti-Ly6G antibodies (Abs), as indicated (n = 1 experiment with 5 mice per group). f, Schematic representation of neutrophil adoptive transfer during CAIA in WT mice. KO, knockout. g, CAIA severity scoring in WT mice that received adoptively transferred WT or knockout neutrophils, as indicated (pooled data from two independent experiments with five mice per group per experiment). Day 8 WT versus Micl−/− P = 0.0013. h, Representative Safranin O-stained sections of the tarsal joints of WT mice that received adoptively transferred WT or knockout neutrophils, as indicated at day 8 (left). Synovial inflammation (black asterisks) is indicated. Scale bars, 500 µm. The histological arthritis severity score is also shown (right; nine mice per group). WT versus Micl−/− P = 0.0281. Data are represented as mean ± s.d. (b,d,e,g,h). Statistical significance was determined by two-way analysis of variance (ANOVA) with Bonferroni’s multiple comparisons test (b,d,e,g). Data were analysed using an unpaired two-tailed Student’s t-test (h). *P < 0.05, **P < 0.01 and ****P < 0.0001. Schematics in panels c,f were created using BioRender (https://biorender.com). Source Data
Fig. 2
Fig. 2. NET formation drives CAIA severity in Micl−/− mice.
a, ROS generation by MSU, PMA, zymosan or A. fumigatus hyphae-stimulated bone marrow neutrophils, depicted as relative light units (RLU), over time. Data are a representative example of n = 4 independent experiments and mean ± s.d. performed in triplicate. Area under curve was analysed using unpaired two-tailed Student’s t-test. WT versus Micl−/− MSU P < 0.0001, A. fumigatus P = 0.0056 and not significant (NS). b, Sytox green fluorescent images of MSU-induced NETs and NET formation percentage by thioglycollate-elicited neutrophils (3 fields of view per condition) 4 h post-stimulation with PMA or MSU, or medium alone (–). Data are represented as mean ± s.d. (n = 3 independent experiments performed in triplicate). Scale bars, 500 µm. Statistical significance was determined by two-way ANOVA with Bonferroni’s multiple comparisons test. WT versus Micl−/− MSU P = 0.0304. c, Representative confocal immunofluorescence microscopy of NETs in CAIA WT and Micl−/− day 11 synovial sections (as per Extended Data Fig. 1a; n = 1 experiment with 3 mice per group). GR-1 (purple), DAPI (blue), citrullinated histone 3 (cit-H3; yellow) and DNA/H1 (green) are shown. NETs are defined as GR-1+cit-H3+DNA/H1+-stained cells. Scale bars, 100 µm. d, Schematic of the PAD4 inhibitor CAIA treatment regime. e,f, Image stream quantification of NET-positive cells (e) and neutrophils isolated from arthritic ankle joints (f) at day 11 during PAD4 inhibitor (BB-CL-amidine) treatment. Pooled data are from 2 independent experiments with n = 7 biologically independent mice per group, represented as mean ± s.d. Statistical significance was determined using two-way ANOVA with Tukey’s multiple comparisons test. WT versus Micl−/− P = 0.0063 and Micl−/− versus Micl−/− + PAD4 inhibitor P = 0.0295 (e). g, Severity scoring of WT and Micl−/− mice during CAIA treated with vehicle or the PAD4 inhibitor (GSK484). The black arrow indicates the start of treatment. Data shown are a representative example of n = 2 experiments with 4 mice per group, represented as mean ± s.d. Statistical significance was determined by two-way ANOVA with Tukey’s multiple comparisons test. Days 8–10 Micl−/− versus Micl−/− + GSK484 P < 0.0001. *P < 0.05, **P < 0.01 and ****P < 0.0001. The diagram in panel d was created using BioRender (https://biorender.com). Source Data
Fig. 3
Fig. 3. Anti-MICL antibodies modulate neutrophil function and correlate with disease.
a, ROS generation by MSU or PMA of human neutrophils (hPMNs) in the presence or absence of anti-MICL antibodies (anti-hMICL), depicted as RLU over time. Anti-hMICL versus isotype MSU P = 0.0084. b, Fluorescence of NET-bound Sytox green of MSU or PMA-induced NETs in hPMNS in the presence or absence of anti-hMICL. MSU anti-hMICL versus isotype P = 0.0043. RFU, relative fluorescence units. c, ROS generation by MSU of hPMNs in the presence of serum from patients with rheumatoid arthritis (RA) and healthy controls (HC). HC1 versus RA38 P < 0.0001, HC1 versus RA40 P < 0.0001, HC2 versus RA38 P < 0.0001 and HC2 versus RA40 P < 0.0001. d, Level of anti-MICL autoantibodies detected in serum samples from patients with rheumatoid arthritis (n = 199) and healthy controls (n = 132). Abs450, absorbance at 450 nm. e, Correlation of MICL autoantibody titres with rheumatoid factor levels in SERA cohort serum from patients with rheumatoid arthritis. f, Correlation of MICL autoantibody titres with CCP levels in SERA cohort serum from patients with rheumatoid arthritis. g, Level of anti-MICL autoantibodies detected in serum from patients with SLE (n = 40) and healthy controls (n = 25). h, Level of anti-MICL autoantibodies detected in serum from patients with mild/moderate (mCOVID-19; n = 25) and severe (sCOVID-19; n = 67) COVID-19 and healthy controls (n = 36). sCOVID-19 versus mCOVID-19 P = 0.0472 and sCOVID-19 versus healthy controls P = 0.0284. i, ROS generation and area under curve (AUC) of hPMNs stimulated with MSU in the presence of serum from patients with SLE pre-incubated with Fc–hMICL. Data are a representative example of n = 3 (a,b) or n = 2 (c,i) independent experiments, and mean ± s.d. performed in triplicate. The AUC was analysed by one-way ANOVA with Tukey’s multiple comparisons test. Box plots extend from the 25th to 75th percentile, including the median, and whiskers extend from the minimum to maximum value (d,g,h). Data were analysed by unpaired two-tailed Student’s t-test (d,g), a Spearman correlation and two-sided t-test (e,f), or using one-way ANOVA with Kruskal–Wallis multiple comparisons test (h). *P < 0.05, **P < 0.01, ***P < 0.001 and ****P < 0.0001. Source Data
Fig. 4
Fig. 4. NET–MICL interaction regulates inflammation.
a, ROS generation by bone marrow neutrophils stimulated with preformed NETs, depicted as RLU over time. Data are a representative example of n = 4 independent experiments, depicted as mean ± s.d. performed in triplicate. mNET, preformed mouse NETs. b, Immunofluorescence staining for MPO (yellow), cit-H3 (magenta) and DNA (DAPI; grey) of neutrophils stimulated with preformed NETs. Scale bars, 200 µm. Quantification is in Extended Data Fig. 7b. c, ROS generation by human neutrophils stimulated with preformed NETs in the presence or absence of antibodies targeting MICL. Data are a representative example of n = 2 independent experiments, depicted as mean ± s.d. performed in duplicate. hPMNs versus anti-hMICL P = 0.0011 and anti-hMICL versus isotype P = 0.0016. d, Fc–MICL recognition of untreated NETs (NETs), proteinase K-treated (+prot K) or DNase-treated (+DNase I) NETs by ELISA. e, MICL-expressing BWZ reporter cell recognition of untreated NETs, proteinase K-treated or DNase-treated NETs. OD, optical density. Pooled data from two independent experiments, depicted as mean ± s.d. performed in triplicate (d,e). f, Neutrophil infiltration (CD45+CD11b+Ly6G+ cells) 4 h after preformed NETs or LPS injection in the peritoneum of WT and Micl−/− mice. Pooled data are from two independent experiments (n = 9 mice per group), depicted as mean ± s.d. NETs WT versus Micl−/− P = 0.0384. *P < 0.05, **P  < 0.01 and ****P < 0.0001. Source Data
Fig. 5
Fig. 5. MICL regulates NET formation during fungal infection.
a, Fluorescence of A. fumigatus hyphae-induced NETs bound to Sytox green in bone marrow-isolated neutrophils from WT and MICL-deficient mice or human neutrophils in the presence of antibodies to MICL. The fluorescence background signal from the unstimulated controls was subtracted from values. Data are a representative example of n = 3 independent experiments, depicted as mean ± s.d. performed in triplicate. The AUC was analysed using an unpaired two-tailed Student’s t-test. WT versus Micl−/− P = 0.0272 and anti-hMICL versus isotype P = 0.0032. b, Survival of mice following intravenous infection with 106 A. fumigatus conidia (n = 15 mice per group). Pooled data are from two independent experiments, analysed by log-rank test; P = 0.0005. ce, Brain fungal burdens (c), and serum (d) and brain (e) cytokine levels of mice 2 days after intravenous infection with 106 A. fumigatus conidia. Values are mean ± s.e.m. of pooled data from two independent experiments. n = 12 (c) or n = 8 (d,e) biologically independent mice, analysed using an unpaired two-tailed Student’s t-test. IL-6 WT versus Micl−/− P = 0.0185 (d) and G-CSF WT versus Micl−/− P = 0.0492 (e). CFU, colony-forming unit. f, Survival of mice following intravenous infection with 106 A. fumigatus conidia and treated with GSK484 (PAD4 inhibitor). Pooled data are from two independent experiments; n = 14 biologically independent mice, analysed by log-rank test. g, Brain fungal burdens of mice 2 days after intravenous infection with 106 A. fumigatus conidia treated with GSK484 (PAD4 inhibitor) or vehicle control. Values are mean ± s.e.m. of 1 experiment with n = 6 biologically independent mice, analysed by one-way ANOVA with Tukey’s multiple comparisons test. WT vehicle versus Micl−/− vehicle P = 0.0378, WT + GSK4848 versus Micl−/− vehicle P = 0.0356 and Micl−/− vehicle versus Micl−/− + GSK484 P = 0.0242. *P < 0.05, **P < 0.01, ***P < 0.001 and ****P < 0.0001. Source Data
Extended Data Fig. 1
Extended Data Fig. 1. MICL regulates inflammation during arthritis.
a, Schematic of the CAIA model and severity scoring shown as mean ± SEM (pooled data from three independent experiments, n = 16 biologically independent mice) assessed over time. Statistical significance was determined by two-way ANOVA with Bonferroni’s multiple comparisons test. Schematic in panel a was created using BioRender (https://biorender.com). b, Flow cytometry gating strategy used for characterisation of the ankle joint cellular infiltrate. Cells isolated from the inflamed joint were first gated to identify single viable cells using a fixable viability dye. CD11b+ populations were further gated into subsets namely; neutrophils (Ly6G+CD11b+) and Ly6Chigh cells (Ly6ChighF4/80+CD11b+) or Ly6Clow cells (Ly6ClowF4/80+CD11b+). Antigen presenting cells (APCs) were gated as MHC II+CD11b+. c, Neutrophils and Ly6Chigh (defined as shown in the gating strategy in Extended Data Fig. 1b) in the ankle joint during CAIA at day 5 are represented as a percentage of total live cells (n = 1 experiment with 6 mice/group). Statistical significance determined by two-way ANOVA with Bonferroni’s multiple comparisons test. WT, wild-type mice; *p < 0.05. Source Data
Extended Data Fig. 2
Extended Data Fig. 2. MICL is required for controling neutrophil responses during arthritis.
a, Schematic of K/BxN serum transfer model and severity scoring shown as mean ± SD analysed over time. b, Total live cell populations (defined by gating strategy in Extended Data Fig. 1b) isolated from inflamed joints on day 10, mean ± SD. Neutrophils WT vs MICL−/− p = 0.0086. a,b, Data is a representative example of three independent experiments, with 4 mice/group/experiment, and analysed using two-way ANOVA with Bonferroni’s multiple comparisons test. Schematic in panel a was created using BioRender (https://biorender.com). c,d, tSNE plots of CD45+ myeloid populations displayed as neutrophils (blue), Ly6Chigh cells (green), Ly6Clow cells (orange), antigen presenting cells (APCs) (pale violet), and all other subpopulation (grey) in the bone marrow (c), and blood (d) of naïve mice. Data is a representative example of three independent experiments, with 4 mice/group/experiment, represented as mean ± SD. e,f, Fold change in mean fluorescent intensity (MFI), relative to wild-type mice of (e) neutrophil activation markers (CD11b, CD18, CD62L) and (f) chemokine receptors (CXCR2, CCR1, C5aR), isolated concomitantly from joints or blood of arthritic mice during CAIA on day 7 (pooled data from two independent, n = 10 biologically independent mice). g, Fold change in mean fluorescence intensity (MFI) on neutrophils, relative to wild-type mice of CD11b, CD18, CD62L and CCR1, isolated from the joints of arthritic mice on day 10. Data is a representative example of n = 3 independent experiments with 4 mice/group/experiment, shown as mean ± SD and analysed using two-way ANOVA with Bonferroni’s multiple comparisons test. h,j, Fold change in mean fluorescent intensity (MFI) relative to wild-type mice of neutrophil activation markers (CD11b, CD18, CD62L) and chemokine receptors (CXCR2, CCR1), isolated concomitantly from bone marrow (h) and blood (j) of naïve mice (representative example of n = 2 experiments with 5 mice/group/experiment). WT, wild-type mice; KO, MICL−/− mice; *p < 0.05; ns, not significant. Source Data
Extended Data Fig. 3
Extended Data Fig. 3. Neutrophil depletion reduces inflammation in WT and MICL−/− mice during arthritis.
a, Flow cytometry gating strategy used to confirm αLy6G antibody-mediated neutrophil depletion in CAIA model at day 9. Neutrophils were identified as CD45+CD11b+SSChigh cells. b, Schematic representation of the αGR-1-mediated neutrophil depletion strategy in the CAIA model. Schematic in panel b was created using BioRender (https://biorender.com). c, Flow cytometry contour plot-illustrating depletion of peripheral blood neutrophils 48 h post-injection with αGR-1. d, Severity scoring of WT and KO mice treated with isotype or αGR-1 antibodies, as indicated (pooled data from two independent experiments, n = 12 biologically independent mice). Data is represented as mean ± SEM. e, Quantification of neutrophils (CD45+CD11b+SSChi) and monocytes (CD45+CD11b+F4/80+) in the peripheral blood on day 11. n = 4 (neutrophils) or n = 3 (monocytes) biologically independent mice represented as mean ± SD. f, Contour plot showing purity of neutrophils after bone marrow isolation. g, Pseudo-colour plot illustrating endogenous and cell-tracker labelled, adoptively transferred CD45+CD11b+Ly6G+ neutrophils in the joint at day 9 (48 h post-transfer).WT, wild-type mice; KO, MICL−/− mice; Ab, αGR-1 or isotype; ns, not significant; *, p < 0.05. Source Data
Extended Data Fig. 4
Extended Data Fig. 4. MICL regulates NET formation.
a, Fluorescence of NET-bound Sytox green of MSU or PMA-induced NETs in thioglycollate-elicited neutrophils analysed using a SPARK CYTO reader (Tecan) every 10 min for up to 7 h. Data is a representative example of n = 3 independent experiments, mean ± SD performed in triplicate. b, Representative Sytox green fluorescent (cyan), Draq5 (magenta), and bright field (grey) images of MSU-induced NETs in bone marrow neutrophils isolated from WT and MICL-deficient animals. Cells were stained unfixed. Quantification (as percentage of Sytox green positive cells extruding NETs) shown as mean ± SD, n = 1 experiment performed in triplicate. Statistical significance determined by Student’s t-test. c, Representative Sytox green fluorescent and bright field images of MSU-induced NETs in thioglycollate-elicited neutrophils isolated from MICL-deficient animals with and without DPI pre-treatment. Scale bar = 100 µm. Quantification (mean ± SD) shown right (n = 2 experiments performed in triplicate). Statistical significance determined by Student’s t-test. d, Fluorescence of NET-bound Sytox of MSU-induced NETs in thioglycollate-elicited neutrophils with and without NSC87877 treatment analysed 4 h after stimulation. Pooled data from two independent experiments performed in duplicate represented as mean ± SD. e, Representative confocal immunofluorescence microscopy images of NETs in CAIA WT and MICL−/− synovial sections on day 11 (as per schedule in Extended Data Fig. 1a). GR-1 (purple), DAPI (blue), Cit-H3 (yellow), and DNA/H1 (green) and quantification of cit-H3/GR-1 area (n = 1 experiment with 3 mice/group). NETs are defined as GR-1+Cit-H3 + DNA/H1+ stained cells. Scale bar = 100 µm. Statistical significance determined by Student’s t-test. f, Representative imaging flow cytometry examples of NET positive (+) and NET negative (−) neutrophils isolated from the ankle joints of mice at day 11 during CAIA. BF, Brightfield; DNA/H1 (green); Ly6G (purple); Cit-H3 (red). *, p < 0.05. Source Data
Extended Data Fig. 5
Extended Data Fig. 5. Neutrophil NET formation drives arthritis disease severity in MICL−/− mice.
a, Representative Sytox green fluorescent and bright field images of MSU-induced NETs in thioglycollate-elicited neutrophils in the presence of 100 μM BB-Cl-amidine or 10 μM GSK484. Scale bar = 200 µm. b, Schematic representation of BB-Cl-amidine treatment regime during CAIA and severity scoring of WT and KO mice during CAIA treated with vehicle or PAD4 inhibitor. Black arrow indicates start of the treatment. Data are represented as mean ± SEM (pooled data from two independent experiments with 5 mice/group/experiment). c, Schematic representation of GSK484 treatment regime during K/BxN serum transfer model and severity scoring of WT and KO mice during K/BxN serum transfer model treated with vehicle or GSK484. Black arrow indicates start of the treatment. Data is a representative example of n = 2 independent experiments, mean ± SD, 5 mice/group/experiment. d, Schematic representation of DNaseI treatment regime and severity scoring of WT and KO mice during CAIA (n = 1 experiment with 6 mice/group). Black arrow indicates start of the treatment. b,c,d, Statistical significance was determined by two-way ANOVA with Tukey’s post hoc test. WT, wild-type mice; KO, MICL−/− mice; ns, not significant; *, p < 0.05. Schematics in panels bd were created using BioRender (https://biorender.com). Source Data
Extended Data Fig. 6
Extended Data Fig. 6. Anti-MICL antibodies exacerbate autoinflammatory diseases.
a, ROS generation by MSU (left) or zymosan (right) of neutrophils derived from WT animals in the presence/absence of antibodies targeting MICL (αMICL) depicted as relative light units (RLU) over time. Data is a representative example of n = 2 independent experiments, mean ± SD performed in triplicate. b, Schematic and severity scoring of the GSK484 treatment regime during CAIA in the presence of anti-MICL or isotype control monoclonal antibodies. Severity scoring is shown as mean ± SD, n = 1 experiment with 3 mice/group. c, Schematic, severity scoring and cell recruitment in the inflamed joints at day 35 during CIA model. Severity scoring is shown as mean ± SD, n = 1 experiment with 6 mice/group, myeloid cell populations are represented as a percentage of total live cells. Statistical significance determined by two-way ANOVA with Tukey’s post hoc test. Schematics in panels b,c were created using BioRender (https://biorender.com). d, Level of anti-MICL autoantibodies in serum from healthy controls (HC) and RA patients used to stimulate human neutrophils in Fig. 3c. e, ROS generation by MSU of human neutrophils in the presence of serum from SLE patients and healthy controls (HC). Data is a representative example of n = 2 independent experiments, mean ± SD performed in triplicate. f, ROS generation by MSU of human neutrophils in the presence of pooled serum from sCOVID-19 patients and healthy controls (HC). Data is a representative example of n = 2 independent experiments, mean ± SD performed in triplicate. g, ROS generation and area under curve (AUC) of human neutrophils stimulated with MSU in the presence of pooled serum from sCOVID-19 patients pre-incubated with Fc-hMICL or Fc-control. Data is a representative example of n = 2 independent experiments, mean ± SD performed in triplicate. WT, wild-type mice; KO, MICL−/− mice; ns, not significant; *, p < 0.05. Source Data
Extended Data Fig. 7
Extended Data Fig. 7. MICL recognizes NETs.
a, NET-bound Sytox green fluorescence of bone marrow-isolated neutrophils stimulated with preformed murine NETs (mNETs). Data is a representative example of n = 3 independent experiments, mean ± SD performed in triplicate. b, Mean fluorescence intensity (MFI) of cit-H3 and MPO (mean ± SD, 3 fields of view per condition) during NET formation in WT or MICL-deficient mNETs-stimulated neutrophils. Statistical significance determined by Student’s t-test. c, ROS production of MICL-deficient neutrophils mNETs-stimulated with or without polyxymin B. Data is a representative example of n = 2 independent experiments, mean ± SD performed in triplicate. d, NET formation and quantification of area under curve (AUC, right) of WT or MICL-deficient mNETs-stimulated neutrophils with GSK484 or DPI. Data is a representative example of n = 2 independent experiments, mean ± SD performed in triplicate. e, Fold change in MFI of MICL expression on cultured neutrophils (CD66b+CD15+), relative to human neutrophils treated with negative control scrambled guide RNA. f, ROS production by preformed NETs of human MICL-knockout cultured neutrophils (hKO) or human WT derived from CD34+ haematopoietic progenitors. Data is a representative example of n = 2 independent experiments, mean ± SD performed in triplicate. g, Fc-MICL NET recognition by ELISA in the presence/absence of anti-MICL antibodies. Pooled data represented as mean ± SD of n = 2 independent experiments performed in triplicate. Statistical significance determined by One-way ANOVA and Bonferroni multiple comparison test. h, ROS production of MICL-deficient neutrophils stimulated with untreated NETs, Proteinase K-treated NETs or DNaseI-treated NETs. Data is a representative example of n = 3 independent experiments, mean ± SD performed in triplicate. i, Fc-MICL genomic DNA recognition by ELISA in the presence/absence of anti-MICL antibodies. Pooled data represented as mean ± SD of n = 2 independent experiments performed in triplicate. Statistical significance determined by One-way ANOVA and Bonferroni multiple comparison test. j, Cell free DNA concentration 4 h after NETs or LPS intraperioteneal injection in WT and MICL-deficient animals (n = 1 experiment with 6 animals/group). *, p < 0.05. Source Data
Extended Data Fig. 8
Extended Data Fig. 8. MICL regulates NET formation during fungal infection.
a, Representative Sytox green fluorescent (DNA, green) and calcofluor white (blue) images of A. fumigatus-induced NETs in bone marrow neutrophils isolated from WT or MICL-deficient animals and quantification as percentage of neutrophils under NETosis (3 fields of view per condition) at 4 h post-stimulation. Statistical significance determined by student’s t-test. b, Tissue fungal burdens of mice two days after intravenous (i.v) infection with 106 A. fumigatus conidia (values shown are mean± SEM of pooled data from two independent experiments, n = 14 biologically independent mice). c, Survival of mice following i.v infection with 106 A. fumigatus conidia and treated with vehicle control (n = 1 experiment with 6 mice/group) analysed by log-rank test. p = 0.0195. CFU, colony-forming unit. *, p < 0.05. Source Data
Extended Data Fig. 9
Extended Data Fig. 9. Proposal model for MICL in NETs recognition.
MICL directly recognizes NETs and this interaction regulates neutrophil activation. In the absence of MICL or in the presence of antibodies targeting this receptor, this interaction fails to occur, generating a positive feedback loop of neutrophil activation that on the one hand increases the severity of autoimmunity, but on the other, increases the ability to resist invasive infections. Diagram was created using BioRender (https://biorender.com).

References

    1. Brinkmann, V. et al. Neutrophil extracellular traps kill bacteria. Science303, 1532–1535 (2004). 10.1126/science.1092385 - DOI - PubMed
    1. Papayannopoulos, V. Neutrophil extracellular traps in immunity and disease. Nat. Rev. Immunol.18, 134–147 (2018). 10.1038/nri.2017.105 - DOI - PubMed
    1. Kruger, P. et al. Neutrophils: between host defence, immune modulation, and tissue injury. PLoS Pathog.11, e1004651 (2015). 10.1371/journal.ppat.1004651 - DOI - PMC - PubMed
    1. Lefrançais, E., Mallavia, B., Zhuo, H., Calfee, C. S. & Looney, M. R. Maladaptive role of neutrophil extracellular traps in pathogen-induced lung injury. JCI Insight3, e98178 (2018). 10.1172/jci.insight.98178 - DOI - PMC - PubMed
    1. Mantovani, A., Cassatella, M. A., Costantini, C. & Jaillon, S. Neutrophils in the activation and regulation of innate and adaptive immunity. Nat. Rev. Immunol.11, 519–531 (2011). 10.1038/nri3024 - DOI - PubMed

MeSH terms