. 2024 Sep;633(8028):216-223.
doi: 10.1038/s41586-024-07828-9. Epub 2024 Aug 14.

Structural basis for transthiolation intermediates in the ubiquitin pathway

Affiliations

Structural basis for transthiolation intermediates in the ubiquitin pathway

Tomasz Kochańczyk et al. Nature. 2024 Sep.

Abstract

Transthiolation (also known as transthioesterification) reactions are used in the biosynthesis of acetyl coenzyme A, fatty acids and polyketides, and for post-translational modification by ubiquitin (Ub) and ubiquitin-like (Ubl) proteins1-3. For the Ub pathway, E1 enzymes catalyse transthiolation from an E1~Ub thioester to an E2~Ub thioester. Transthiolation is also required for transfer of Ub from an E2~Ub thioester to HECT (homologous to E6AP C terminus) and RBR (ring-between-ring) E3 ligases to form E3~Ub thioesters4-6. How isoenergetic transfer of thioester bonds is driven forward by enzymes in the Ub pathway remains unclear. Here we isolate mimics of transient transthiolation intermediates for E1-Ub(T)-E2 and E2-Ub(T)-E3HECT complexes (where T denotes Ub in a thioester or Ub undergoing transthiolation) using a chemical strategy with native enzymes and near-native Ub to capture and visualize a continuum of structures determined by single-particle cryo-electron microscopy. These structures and accompanying biochemical experiments illuminate conformational changes in Ub, E1, E2 and E3 that are coordinated with the chemical reactions to facilitate directional transfer of Ub from each enzyme to the next.


Conflict of interest statement

The authors declare no competing interests.

Figures

Fig. 1
Fig. 1. The Ub pathway, transthiolation intermediates and strategy to obtain stable mimics.
a, Reactions in the Ub-conjugation cascade. b, Reaction of the Ub-PSAN probe with E2 to form E2–Ub vinyl thioether and subsequent reactions with E1 and E3HECT to obtain stable analogues of transthiolation intermediates. c, SDS–PAGE analysis of reactions of Ub-PSAN with E2 (top) and E2–Ub(T) vinyl thioether with E1 (middle) and E3HECT (bottom). Asterisks indicate bands for side- or retro-reaction products (Extended Data Fig. 1d,e and Supplementary Fig. 1).
Fig. 2
Fig. 2. Reconstructions of doubly loaded E1 reveal Ub(T) conformational changes and the transthiolation active site.
a, Schematic of Ub (Ub(A) and Ub(T)), E2 (Ubc4) and E1 (Uba1) with colour-coded domains and the crosslink indicated by lines between Ub(T), E2 and E1. UFD, C-terminal Ub fold domain. b, Ten reconstructions of doubly loaded E1 obtained by 3D classification showing different conformations of Ub(T) in states 1–10 from its donor to acceptor positions. c,d, Reconstructions of states 1 (c) and 10 (d) shown next to models highlighting movement of Ub(T). Electron microscopy (EM) densities and models are colour-coded as in a. e, Cartoon representation of models for Ub(T), illustrating the 180° rotation and 35 Å translation between states 1 and 10. f,g, Magnified views of the transthiolation site (T-site) with overlaid electron microscopy densities and model for doubly loaded E1 state 1 (f) and state 10 (g), centred on the cyanomethyldithioacetal mimic of the E1–Ub(T)–E2 tetrahedral intermediate. Isosurface levels contoured at 0.5 (b), 0.63 (c,d), 0.54 (f) and 0.60 (g).
Fig. 3
Fig. 3. Conformational changes for E1–Ub(T)–E2 complexes and coupling of Ub(A) adenylation and Ub(T) transitions to E2 for doubly loaded E1–Ub(T)–E2.
a, Superposed models of clusters 1 and 5 for singly loaded E1 with Ub(T) in solid as isosurface rendering of 5 Å lowpass-filtered EM densities showing translation of E1 FCCH and SCCH domains and E2 as indicated by labels and arrows; rotational changes are not labeled. b, Superposed models of cluster 1 and 5 for doubly loaded E1 rendered as in a, highlighting translation of the E1 SCCH domain, E2 and Ub(T). c,d, Electron microscopy densities and models for the adenylation (A) active site (c) and Ub(T) conformations (%) per E1 cluster (d) (Extended Data Fig. 6) indicate that E1 and E2 rotations do not correlate with changes in Ub(T) positioning. e,f, Electron microscopy densities for the adenylation (A) active site (e) and Ub(T) conformations (%) per E1 cluster (f) (Extended Data Fig. 7) indicate that E1 and E2 rotations correlate with loss of PPi in the adenylation site and movement of Ub(T) from donor to acceptor positions. Isosurface levels contoured at 0.23–0.24 (a,b); 1.06, 1.01 and 0.9 for clusters 1, 3 and 5 (c); and 1.19, 1.2 and 1.15 for clusters 1, 3 and 5 (e). Ub(T) conformations (%) per E1 cluster are plotted as a bar graph (Extended Data Fig. 7). g, Stimulation of E1-to-E2 transthiolation by E1 adenylation site ligands. SDS–PAGE gels indicating E1~Ub(T) and E2~Ub(T) over time after initiating reactions with E2. h, Quantification of transthiolation rates from g (Extended Data Fig. 5k and Supplementary Fig. 3). RFU, relative fluorescence units. Green triangle indicates fluorescein. Bars represent mean ± s.d of n = 3 replicates. Statistical differences by two-sided one-way ANOVA with Tukey’s test, ***P < 0.001, **P < 0.01. Source Data
Fig. 4
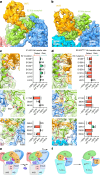
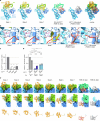
Fig. 4. E2–Ub(T)-E3HECT structures reveal active site remodelling and conformational changes for E2 and Ub(T).
a, Schematic of Ub (Ub(T)), E2 (Ubc4) and E3HECT (Pub2) with domains colour-coded and the crosslink indicated by lines between Ub(T), E2 and E3. b, Seven reconstructions obtained for E2–Ub(T)–E3HECT showing conformations of Ub(T) in states 1–7 from donor to intermediate positions (unsharpened maps). c, Reconstructions and models of state 1 and state 7 next to orthogonal views (sharpened maps), highlighting movement of Ub(T). d, Superposed models showing movement of Ub(T) between states 1 and 7. e, Magnified views of transthiolation sites (T-site) with electron microscopy densities for states 1 and 7, showing the cyanomethyldithioacetal mimic of the E2–Ub(T)–E3HECT tetrahedral intermediate and Ub(T) Arg74 side chain. f, Magnified views of areas of interest highlighting differences in E2 contacts with Ub(T) between states 1 and 7 with residues labelled. g, Results of transthiolation assays with E2, Ub and E3 mutations to probe putative protein–protein interactions during transthiolation, quantified after normalization to wild type (WT) with indicated mutations labelled and colour-coded. Densities and models colour-coded according to a. Isosurface levels contoured at 0.47–0.52 (b); at 0.72, 0.75 and 0.71 for state 1 and 0.5, 0.6 and 0.59 for state 7 (c,e,f). Bars represent mean ± s.d of n = 3 replicates (n = 9 and n = 6 for wild type in E2 and E3 mutations sets, respectively). Statistical differences between wild type and mutants by two-tailed unpaired t-test, ***P < 0.001 (Supplementary Fig. 4). Source Data
Fig. 5
Fig. 5. Differential contribution of E2 residues to transthiolation when E2 is the acceptor of Ub(T) from E1 or donor of Ub(T) to E3HECT.
a,b, Reconstructions and models for E1–Ub(T)–E2 with Ub(T) in the acceptor position (state 10) (a) and for E2–Ub(T)–E3HECT with Ub(T) in the donor position (state 1) (b), highlighting distinct contacts of E2 with Ub(T) and E1 or E3. c, Electron microscopy densities and models and results of E1-to-E2 transthiolation assays with indicated E2 mutants. Bar graphs depict loss or gain of activity relative to wild type (n = 18 replicates) and represent mean ± s.d of n = 3 replicates. Statistical differences between wild type and mutants by two-tailed unpaired t-test, ***P < 0.001, **P < 0.01, *P < 0.05; NS, not significant. d, As in c but for E2-to-E3 transthiolation assays with indicated E2 mutants. Bar graphs depict loss or gain of activity relative to wild type (n = 9 replicates) and represent mean ± s.d. of n = 3 replicates (Supplementary Figs. 4 and 5). Models and electron microscopy densities colour-coded according to Figs. 2 and 4, with mutated residues in pink. Isosurface levels contoured at 0.57 and 0.51 (a,c) and 0.71 (b,d). e, Schematic for E1-to-E2 transthiolation indicating Ub(T) conformations during transthiolation and adenylation. f, Schematic for E2-to-E3 transthiolation indicating Ub(T) conformations and E2 loop remodelling during transthiolation. Domains are coloured and labelled, active site Cys in E1, E2 and E3 are indicated as magenta circles. Source Data
Extended Data Fig. 1
Extended Data Fig. 1. Semisynthesis of Ub-PSAN and compositional stability of the E1-Ub(T)-E2 and E2-Ub(T)-E3HECT transthiolation analogues.
a, Schematic of semisynthesis of Ub-PSAN from a Ub(-2) intein fusion protein expressed in E. coli (shown here as thioester intermediate following intein-catalyzed N-to-S acyl transfer), and synthetic H2N-Gly-PSAN (3-[phenylsulfonyl] acrylonitrile). Ub(-2) is truncated by last two glycine residues at its C-terminus and contains StrepTag and TEV protease cleavage site (MWSHPQFEKSAENLYFQGSGG) added to its N-terminus. Positions of Ub residues R74 and G75 in italics, PSAN containing surrogate of G76 additionally indicated in brackets. b,c, Electrospray ionization-mass spectrometry (ESI-MS) spectra of Ub(-2) hydrazide (mass observed, 10840.5 Da; theoretical, 10839.3 Da) (b), and Ub-PSAN (mass observed, 11085.5 Da; theoretical, 10886.6 Da) (c). d,e, SDS-PAGE analysis of the purified E1-Ub(T)-E2 complex (d), and purified E2-Ub(T)-E3HECT complex (e), incubated at indicated pH and temperatures. Gels are representative of three independent preparations of protein complexes. Source Data
Extended Data Fig. 2
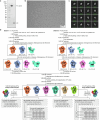
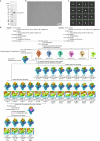
Extended Data Fig. 2. Cryo-EM data collection and processing of E1-Ub(T)-E2 complexes.
a, SDS-PAGE analysis of sample used in cryo-EM sample preparation representative of three independent preparations. b, Representative micrograph (out of 19,833 images used for particle picking), scale bar = 50 nm. c, Representative 2D-class averages from initial reference-free 2D classification (representative of 200 classes), d, Flowchart of the image processing of the cryo-EM data. Resolutions indicated in parentheses.
Extended Data Fig. 3
Extended Data Fig. 3. Consensus EM reconstructions and focused Ub(T) classifications in E1-Ub(T)-E2 complexes.
a,b, EM densities and the fitted atomic models of the transthiolation site in the consensus reconstructions of E1-Ub(T)-E2:Ub(A) (doubly-loaded) complex (a) and E1-Ub(T)-E2 (singly-loaded) complex (b). c, Reconstructions and corresponding models of Ub(T) states after 3D classification without image realignment, performed with a focus mask on Ub(T) in doubly- and singly-loaded complexes. d, Comparison of doubly-loaded E1-Ub(T)-E2 complex (State 1) to doubly-loaded E1-Ub(T) in the absence of E2 (PDB ID: 4NNJ) with Ub(T) interacting with the FCCH domain of E1. e, Comparison of doubly-loaded E1-Ub(T)-E2 complex (State 10) to singly-loaded E1-Ub(T)-E2 where E2 is Cdc34 (PDB ID: 7K5J) with Ub(T) in contact with E2. Isosurface levels contoured at 0.67, 0.65, 0.5 (a,b,c).
Extended Data Fig. 4
Extended Data Fig. 4. Local resolution estimates for consensus, singly- and doubly loaded E1-Ub(T)-E2 and E2-Ub(T)-E3 cryo-EM reconstructions.
Names and corresponding particle counts (shown in brackets) are specified above each reconstruction along with a scale bar indicating resolution range to the right of each row where that scale applies. a, Reconstructions for consensus doubly and singly-loaded E1-Ub(T)-E2 complexes and corresponding Ub(T) donor and acceptor classes. b, Reconstructions for five conformational clusters of SCCH domain rotation in singly-loaded E1-Ub(T)-E2 complex. c, Reconstructions for five conformational clusters of SCCH domain rotation in doubly-loaded E1-Ub(T)-E2 complex. d,e, Reconstructions for Ub(T) donor and acceptor classes in cluster 1 and 5 of SCCH domain rotation in singly- (d) and doubly-loaded (e) E1-Ub(T)-E2 complexes. f, Reconstructions for states 1 through 7 of E2-Ub(T)-E3HECT. Isosurface levels contoured at 0.48, 0.48, 0.50, 0.47, 0.48, 0.48 (left to right in a), 0.48 (all maps in b), 0.48, 0.46, 0.47, 0.46, 0.47 (left to right in c), 0.53, 0.47, 0.53, 0.48 (left to right in d), 0.54, 0.55 (left to right in e), 0.48 (all maps in b).
Extended Data Fig. 5
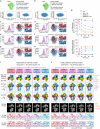
Extended Data Fig. 5. 3D variability analysis to resolve the rotation of the SCCH domain in singly and doubly-loaded E1-Ub(T)-E2 complex and transthiolation assays.
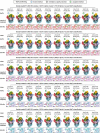
3D variability analysis for singly-loaded (a) and doubly loaded (b) E1 performed with a mask on E1-E2, excluding Ub(T), as detailed in Methods. 2D scatter plots show particle latent coordinates of sequential pairs of variability components. c,e,g, Histograms of variability components for singly-loaded complex with binning of the particles into 5 non-overlapping clusters. Maps from 3D refinements of clusters 1 (red) and 5 (blue) for each component shown next to magnified views of the adenylation (A) site. Component 1 (c) captures the largest range of E1SCCH domain orientations as evidenced by comparing overlap between red and blue maps. d,f,h, Histograms of variability components obtained for doubly-loaded complex showing binning of the particles into 5 non-overlapping clusters. Maps from 3D refinements of clusters 1 (red) and 5 (blue) for each component shown next to magnified views of the adenylation (A) site. Component 1 (d) captures the largest range of E1SCCH domain orientations as evidenced by comparing overlap between red and blue maps. i,j, detailed analysis of all reconstructions obtained for clusters 1–5 shown in panels c,d. Resolution of reconstructions indicated in parentheses. Maps were lowpass filtered at 5 Å to visualize conformational differences in complexes shown in three views. The 2D slice view shows corresponding summed 10-pixel (10.64 Å thick) cross-sections of the map at the nominal resolution. Views of the adenylation site ((A) site) and transthiolation site ((T) site) show EM densities at the nominal resolution of the map with fitted atomic models for the indicated cluster. Isosurface levels contoured at 0.25-0.28 (low pass filtered maps) (i); 0.41, 0.43, 0.41, 0.52, 0.44 for clusters 1, 2, 3, 4, 5 in singly-loaded complex and 0.66, 0.59, 0.58, 0.48, 0.46 for clusters 1, 2, 3, 4, 5 in doubly-loaded complex ((T) site); 1.1, 1.1, 1.0, 1.0, 0.9 for clusters 1, 2, 3, 4, 5 in singly-loaded complex and 1.2, 1.2, 1.2, 1.2, 1.2 for clusters 1, 2, 3, 4, 5 in doubly-loaded complex ((A) site). k, Quantification of the in-gel fluorescence of the gels presented in Supplementary Fig. 3. Data points for three replicates (symbols) and average (line) is plotted versus reaction time. RFU, relative fluorescence units. Green triangle next to ubiquitin indicates fluorescein. Source Data
Extended Data Fig. 6
Extended Data Fig. 6. Focused Ub(T) classifications in each of five conformational clusters of SCCH domain rotation in singly-loaded E1-Ub(T)-E2 complexes.
Classifications were performed without image realignment using a focus mask on Ub(T), as shown in Extended Data Fig. 3. Overall views show maps lowpass filtered at 5 Å to better visualize Ub(T) density. The views of the adenylation site ((A) site) represent of EM density at the nominal resolution of the map superimposed with the consensus atomic model for the corresponding cluster. Isosurface levels contoured at 0.5 (5 Å lowpass filtered maps) and 0.7 ((A) site).
Extended Data Fig. 7
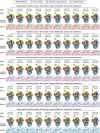
Extended Data Fig. 7. Focused Ub(T) classifications in each of five conformational clusters of SCCH domain rotation in doubly-loaded E1-Ub(T)-E2 complexes.
Classifications were performed without image realignment using a focus mask on Ub(T), as shown in Extended Data Fig. 3. Overall views show maps lowpass filtered at 5 Å to better visualize Ub(T) density. The views of the adenylation site ((A) site) represent of EM density at the nominal resolution of the map superimposed with the consensus atomic model for the corresponding cluster. Isosurfaces contoured at level 0.5 (5 Å lowpass filtered maps) and 0.7 ((A) site).
Extended Data Fig. 8
Extended Data Fig. 8. Cryo-EM data collection and processing of E2-Ub(T)-E3HECT to resolve conformational states of the E2-Ub(T)-E3HECT complex.
a, SDS-PAGE analysis of sample used in cryo-EM sample preparation representative of three independent preparations. b, Representative micrograph (out of 22,110 images used for particle picking), Scale bar = 50 nm. c, Representative 2D-class averages from initial reference-free 2D classification (representative of 100 classes), d, Flowchart of the image processing of the cryo-EM data. The resolutions are indicated in parentheses. Clusters are labeled with number of particles enclosed in brackets and resolution in parentheses. States 1–7 are indicated below the relevant cluster or class.
Extended Data Fig. 9
Extended Data Fig. 9. Comparison of E2-Ub(T)-E3HECT in states 1, 2 and 7 (this study) with published structures of E3sHECT and structure-function analysis of the interface between N and C-lobes in E3HECT.
a, Comparison of states 1, 2 and 7 of E2-Ub(T)-E3HECT showing similar orientation of the N and C-lobes of E3HECT and distinct positioning and conformation of Ub(T) compared to crystal structures of E2~Ub(T):E3HECT complex (Protein Data Bank (PDB) ID: 3JW0) and E3HECT~Ub(T) (PDB ID: 4BBN). b, Magnified view of the interface between N and C-lobes in the structures shown in (a). c, Histograms derived by quantification of the in-gel fluorescence of the gels presented in (Supplementary Fig. 4). Bars represent mean ± s.d of n = 3 replicates. Statistical differences between wild-type and mutants were determined by two-tailed unpaired t-test: ***P < 0.001. d, Histograms derived by quantification of the in-gel fluorescence of the gels presented (Supplementary Fig. 4). EQ/EQ indicate E451Q/E455Q mutation in E3. Bars represent mean ± s.d of n = 3 replicates. Data were analyzed by two-sided one-way ANOVA with Tukey’s test: ***P < 0.001, ns, not significant. e, Orthogonal views of surfaces for models for E2 and E3 for states 1 through 7 with ubiquitin shown as in cartoon representation next to similar depictions of PDB ID: 3JW0 and 4BBN to illustrate the rotation and translation of ubiquitin as it transits between states 1–7 to its product conformation in 3JW0 and 4BBN. Cartoon of ubiquitin shown at the bottom aligned at its C-terminus in respective complexes to provide another view of Ub(T) transitioning through states 1–7 compared to Ub(T) in PDB ID: 3JW0 and 4BBN. Source Data
Extended Data Fig. 10
Extended Data Fig. 10. Select disease-associated mutations affecting transthiolation in human E1 and sequence conservation of residues important for transthiolation among human E3HECT cognate E2s.
a,b, Residues corresponding to VEXAS syndrome mutations (VEXAS mutations Y55H, S56F, G477A and D506N/G correspond to residues Y20, S21, G436 and D465 in S. pombe Uba1, respectively) affecting E1-E2 transthiolation mapped to onto structures of doubly-loaded E1-Ub(T)-E2 complex (cluster 1 – ATP Mg2+ bound) with Ub at the donor interface and doubly-loaded E1-Ub(T)-E2 complex (cluster 5 – Ub-AMP bound) shown in magenta and labeled. Model color coded as in Fig. 2. c,d, Magnified views showing EM densities and fitted atomic models of the region surrounding adenylation site in doubly-loaded E1-Ub(T)-E2 complex (cluster 1 – ATP Mg2+ bound) with Ub at the donor interface (c) and doubly-loaded E1-Ub(T)-E2 complex (cluster 5 – Ub-AMP bound) shown in magenta and labeled (d). Isosurface levels contoured at 0.95 and 0.87 (c,d). e. Sequence alignment of S. pombe Ubc4 and human E2 enzymes. Sequence alignment logos (generated using WebLogo) display the conservation of E2 residues among human E2s that form functional pairs with HECT-type E3 ligases and the remaining human E2s, numbered according to Ubc4. Sequences in the alignment are: UBE2D1, UBE2D2, UBE2D3, UBE2D4, UBE2E1, UBE2E2, UBE2E3, UBE2L3, UBE2J1, UBE2J2 (Uniprot accession codes: P51668, P62837, P61077, Q9Y2X8, P51965, Q96LR5, Q969T4, P68036, Q9Y385, Q8N2K1, respectively) for HECT-cognate E2s, and UBE2A, UBE2B, UBE2C, UBE2G1, UBE2G2, UBE2H, UBE2K, UBE2L6, UBE2N, UBE2O, UBE2Q1, UBE2Q2, UBE2QL1, UBE2R1, UBE2R2, UBE2S, UBE2T, UBE2U, UBE2W, UBE2Z (Uniprot accession codes: P49459, P63146, O00762, P62253, P60604, P62256, P61086, O14933, P61088, Q9C0C9, Q7Z7E8, Q8WVN8, A1L167, P49427, Q712K3, Q16763, Q9NPD8, Q5VVX9, Q96B02, Q9H832, respectively) for the remaining E2s. The Ubc4 sequence is shown above, with residues in States 1 and 7 that make contacts within 4.5 Å of Ub(T) and E3HECT indicated by orange and blue circles, respectively. The active site cysteine and residues mutated in this study are marked by a star and black triangles, respectively.

References

    1. Morrison, H. in Enzyme Active Sites and their Reaction Mechanisms 79–84 10.1016/B978-0-12-821067-3.00015-5 (Elsevier, 2021).
    1. Chen, A., Jiang, Z. & Burkart, M. D. Enzymology of standalone elongating ketosynthases. Chem. Sci.13, 4225–4238 (2022). 10.1039/D1SC07256K - DOI - PMC - PubMed
    1. Cappadocia, L. & Lima, C. D. Ubiquitin-like protein conjugation: structures, chemistry, and mechanism. Chem. Rev.118, 889–918 (2018). 10.1021/acs.chemrev.6b00737 - DOI - PMC - PubMed
    1. Buetow, L. & Huang, D. T. Structural insights into the catalysis and regulation of E3 ubiquitin ligases. Nat. Rev. Mol. Cell Biol.17, 626–642 (2016). 10.1038/nrm.2016.91 - DOI - PMC - PubMed
    1. Wang, Y., Argiles-Castillo, D., Kane, E. I., Zhou, A. & Spratt, D. E. HECT E3 ubiquitin ligases—emerging insights into their biological roles and disease relevance. J. Cell Sci.133, jcs228072 (2020). 10.1242/jcs.228072 - DOI - PMC - PubMed

MeSH terms

LinkOut - more resources