. 2024 Aug;632(8027):1009-1013.
doi: 10.1038/s41586-024-07821-2. Epub 2024 Aug 14.

Black holes regulate cool gas accretion in massive galaxies

Affiliations

Black holes regulate cool gas accretion in massive galaxies

Tao Wang et al. Nature. 2024 Aug.

Abstract

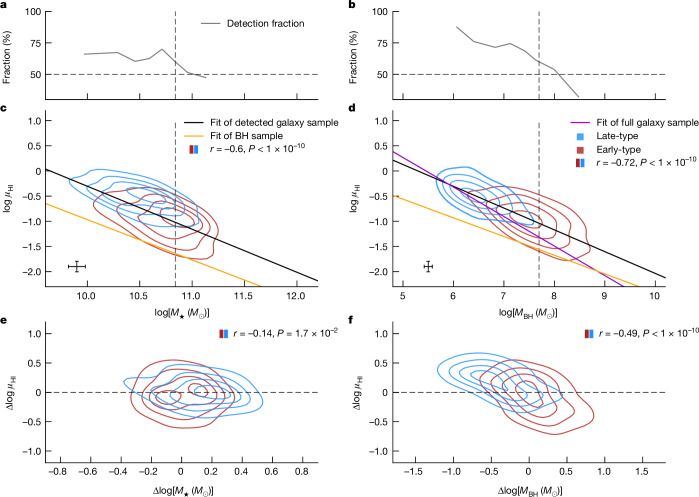
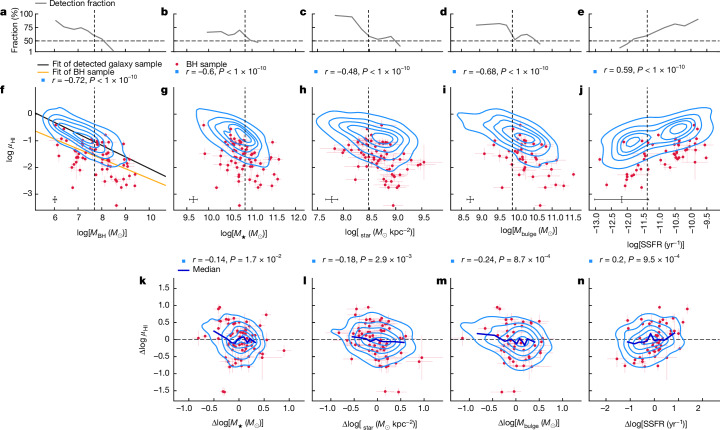
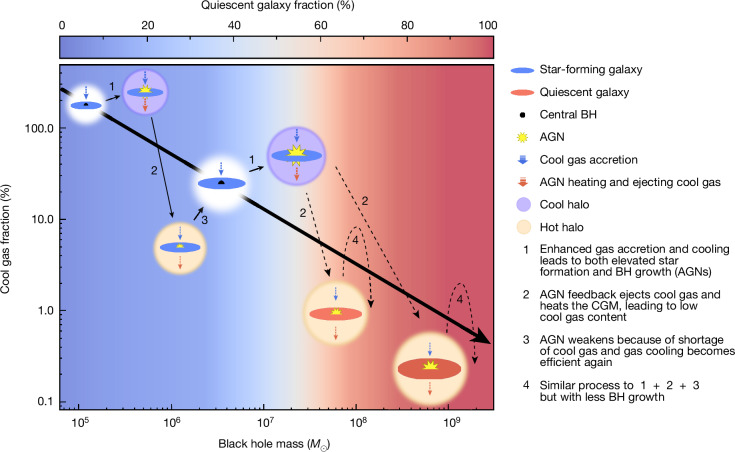
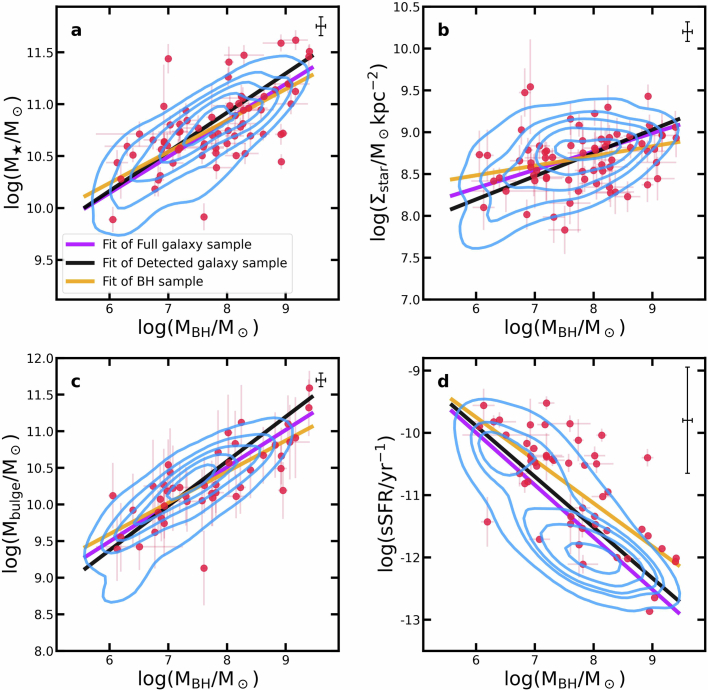
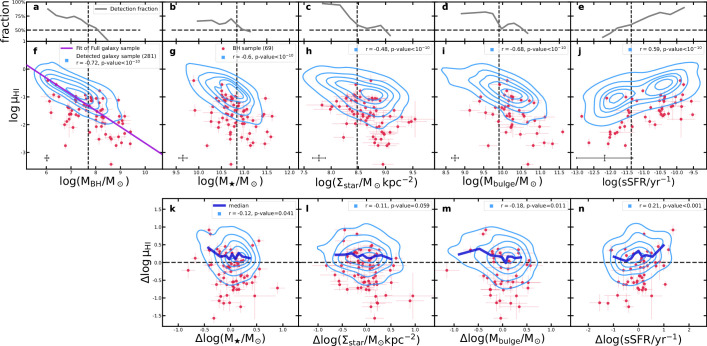
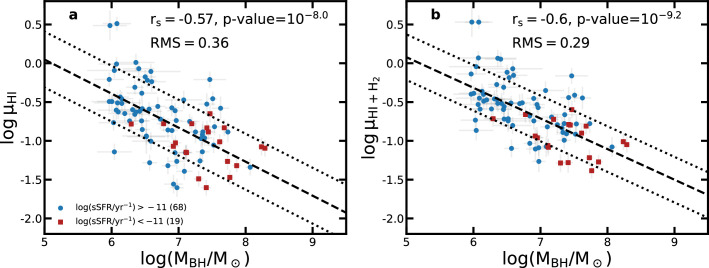
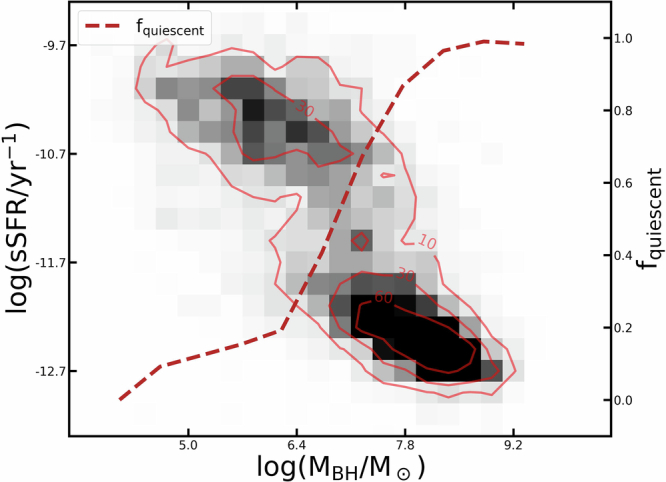
The nucleus of almost all massive galaxies contains a supermassive black hole (BH)1. The feedback from the accretion of these BHs is often considered to have crucial roles in establishing the quiescence of massive galaxies2-14, although some recent studies show that even galaxies hosting the most active BHs do not exhibit a reduction in their molecular gas reservoirs or star formation rates15-17. Therefore, the influence of BHs on galaxy star formation remains highly debated and lacks direct evidence. Here, based on a large sample of nearby galaxies with measurements of masses of both BHs and atomic hydrogen (HI), the main component of the interstellar medium18, we show that the HI gas mass to stellar masses ratio (μHI = MHI/M) is more strongly correlated with BH masses (MBH) than with any other galaxy parameters, including stellar mass, stellar mass surface density and bulge masses. Moreover, once the μHI-MBH correlation is considered, μHI loses dependence on other galactic parameters, demonstrating that MBH serves as the primary driver of μHI. These findings provide important evidence for how the accumulated energy from BH accretion regulates the cool gas content in galaxies, by ejecting interstellar medium gas and/or suppressing gas cooling from the circumgalactic medium.


Conflict of interest statement

The authors declare no competing interests.

Figures

Fig. 1
Fig. 1. Comparison between the relations of μHI to M and μHI to MBH for the BH sample.
a,b, μHIM (a) and μHIMBH (b) correlations. Galaxies are colour-coded by their morphological T types, with smaller values being more early-type and larger values more late-type morphologies. The orange lines represent the best-fitted linear relation, taking into account the uncertainties of both variables. c,d, Comparison of the partial correlation of μHI–M (while controlling for MBH) (c) and μHI–MBH (while controlling for M) (d). The x- and y-axes show the residual in μHI and M after removing their dependence on MBH in the left panel, and MBH after removing their dependence on M in the right panel: Δlog μHI = log μHI − log μHI(MBH) and Δlog M = log M − log M(MBH) in the left panel, and Δlog μHI = log μHI − log μHI(M) and Δlog MBH = log MBH − log MBH(M) in the right panel. The horizontal dashed line indicates zero correlation, that is, there is no intrinsic correlation between the two quantities. The Spearman correlation coefficients between the two corresponding variables are shown in each panel. The error bars refer to 1σ measurement errors.
Fig. 2
Fig. 2. Comparison between the relations of μHI to M and μHI to MBH for the galaxy sample.
a,b, μHI–M (a) and μHI–MBH (b) correlations. Galaxies are divided into early- and late-type galaxies based on their Sérsic indexes (separated at n = 2), which are shown in red and blue contours, respectively. The HI-detection rates of galaxies are shown as a function of stellar masses and BH masses. The vertical dashed lines indicate the position when the HI-detection fraction reaches 60%. c,d, μHI–M (c) and μHI–MBH (d) relations. The best-fitted relations for the HI-detected galaxy sample and the BH sample are shown by the black and orange lines, respectively. We also show the μHI–MBH relation for the full galaxy sample with the magenta line in d. e,f, The partial correlation between μHI and M while controlling for MBH (e), and the partial correlation between μHI and MBH while controlling for M (f). The corresponding Spearman coefficients are shown in each panel. The median 1σ error bars for the galaxy sample are shown in c and d.
Fig. 3
Fig. 3. The impact of MBH on the correlation between μHI and other main galactic parameters.
ae, The HI-detection fraction along MBH (a) and some other main physical parameters of galaxies, including M (b), Σstar (c), Mbulge (d) and SSFR (e). The vertical dashed lines indicate the position at which the HI-detection rates hit 60%. fj, The relation between the parameters MBH (f), M (g), Σstar (h), Mbulge (i) and SSFR (j) and μHI. The contours denote the distribution of the HI-detected galaxy sample, whereas the filled red circles denote the BH sample with 1σ error bars. The best-fitted μHIMBH relations for the HI-detected galaxy sample and the BH sample are shown in f by the black and orange lines, respectively. The median 1σ error bars for the galaxy sample are shown. kn, The relation between the residual in μHI and the residual in other galactic parameters after removing their dependence on MBH: Δlog μHI = log μHI − log μHI(MBH) and Δlog X = log X − log X(MBH) with X representing M (k), Σstar (l), Mbulge (m) and SSFR (n), and μHI(MBH) and X(MBH) derived from their best-fitted relation with MBH (Extended Data Fig. 2). The solid medium-blue lines in kn show the running median of the residuals in μHI. The Spearman correlation coefficients for the HI-detected galaxy sample between the corresponding x and y variables are shown in fn.
Fig. 4
Fig. 4. Schematic of the proposed scenario on how BHs regulate cool gas content in galaxies.
The large arrow indicates the μHI–MBH correlation. The background colour scale indicates the quiescent galaxy fraction as a function of MBH, which shows a sharp increase at MBH ≳ 107.5M (Methods and Extended Data Fig. 5), corresponding to μHI < 10%. At fixed MBH, galaxies could maintain their μHI at a certain level determined by the relative strength of the inner halo binding energy and MBH. Once gas accretion is enhanced onto galaxies (and their BHs), which increases μHI, MBH will also grow and release additional heating energy that prevents further gas cooling or accretion. This will bring down μHI together with increasing M by star formation and reach a balance at higher MBH. Although the same process takes place in both SFGs and quiescent galaxies, the growth of MBH or M should be much less significant in quiescent galaxies than in SFGs, and the large range of MBH among quiescent galaxies (MBH ~ 107−10M) is probably inherited from their different star-forming progenitors when they were quenched.
Extended Data Fig. 1
Extended Data Fig. 1. The impact of inclinations on the observed HI line width.
The relation between M and the observed HI line width are shown in panels (a, c), while the relation between M and the inclination-corrected HI line width are shown in panels(b, d), for MaNGA and xGASS galaxies respectively. The error bars refer to 1-σ errors for logM. For W50, we denote 20% measurement uncertainties.
Extended Data Fig. 2
Extended Data Fig. 2. The relation between BH masses and other major galactic parameters for the BH and galaxy sample.
The relation between MBH and M, Σstar, Mbulge, and SSFR for the BH sample (red filled dots) and the full galaxy sample (blue contours) are shown in Panels a, b, c, and d, respectively. The best-fitted relation for the galaxy sample, the full galaxy, and the HI-detected galaxy sample are respectively drawn in solid orange, darkviolet, and black lines in each panel. These relations are used to derive the residuals of the corresponding galactic parameters after controlling for MBH in the bottom row of Fig. 3, and Extended Data Fig. 3. The median error of the galaxy sample is shown in the upper right in each panel. The error bars refer to 1-σ errors.
Extended Data Fig. 3
Extended Data Fig. 3. The impact of MBH on the correlation between μHI and other major galactic parameters for the full galaxy sample.
Similar as Fig. 3, but with the third row replaced by the relation between the residual in μHI and other galactic parameters after removing their dependence on MBH based on the full sample instead of only the HI-detected ones. The solid medium-blue lines denote the running median of the residuals in μHI. Since the HI-detected samples are always biased compared to the full sample, the running medians exhibits a positive offset compared to zero values(black dashed lines). The median error of the galaxy sample is shown in the lower left in panel (f ~ j). The error bars refer to 1-σ errors. In the top-right corners of the middle and bottom panels, we show the Spearman correlation coefficients for the HI-detected galaxy sample between the corresponding x and y variables.
Extended Data Fig. 4
Extended Data Fig. 4. Comparison between the relations of BH masses to the HI gas fraction and to the total gas fraction.
The relation between MBH and HI gas fraction is shown in panel a, and the relation between MBH and total gas fraction is shown in panel b for central galaxies. The blue circles and red squares denote respectively star-forming and quiescent galaxies, which are classified based on their SSFR. Spearman correlation coefficients and the RMS between data and the fitted relations (black dashed lines) are shown in the top-right corners. The error bars refer to 1-σ errors.
Extended Data Fig. 5
Extended Data Fig. 5. Relation between SSFR and BH masses for SDSS group central galaxies.
Density map of SDSS group central galaxies is shown in the SSFR-MBH plot. The dashed line denotes the quiescent fraction as a function of MBH. The contours and corresponding numbers denote the galaxy number for each pixel.
Extended Data Fig. 6
Extended Data Fig. 6. The comparison between the stellar masses derived from SED-fitting and those derived based on K-band luminosities.
The SED-based estimation M is taken from the MPA-JHU catalog and the K-band luminosity based estimation of M is derived from the relation among M, LK and Re given by Ref. . The dashed line denotes the ‘1:1’ line shifted by the mean mass difference of 0.32 dex. The error bars refer to 1-σ error.

References

    1. Ho, L. C. Nuclear activity in nearby galaxies. Annu. Rev. Astron. Astrophys.46, 475–539 (2008).
    1. Silk, J. & Rees, M. J. Quasars and galaxy formation. Astron. Astrophys.331, L1–L4 (1998).
    1. Balogh, M. L., Pearce, F. R., Bower, R. G. & Kay, S. T. Revisiting the cosmic cooling crisis. Mon. Not. R. Astron. Soc.326, 1228–1234 (2001).
    1. Cattaneo, A. et al. The role of black holes in galaxy formation and evolution. Nature460, 213–219 (2009). - PubMed
    1. Fabian, A. C. Observational evidence of AGN feedback. Annu. Rev. Astron. Astrophys.50, 455–489 (2012).

LinkOut - more resources