. 2024 Oct;634(8032):96-103.
doi: 10.1038/s41586-024-07830-1. Epub 2024 Aug 14.

The genomes of all lungfish inform on genome expansion and tetrapod evolution

Affiliations

The genomes of all lungfish inform on genome expansion and tetrapod evolution

Manfred Schartl et al. Nature. 2024 Oct.

Abstract

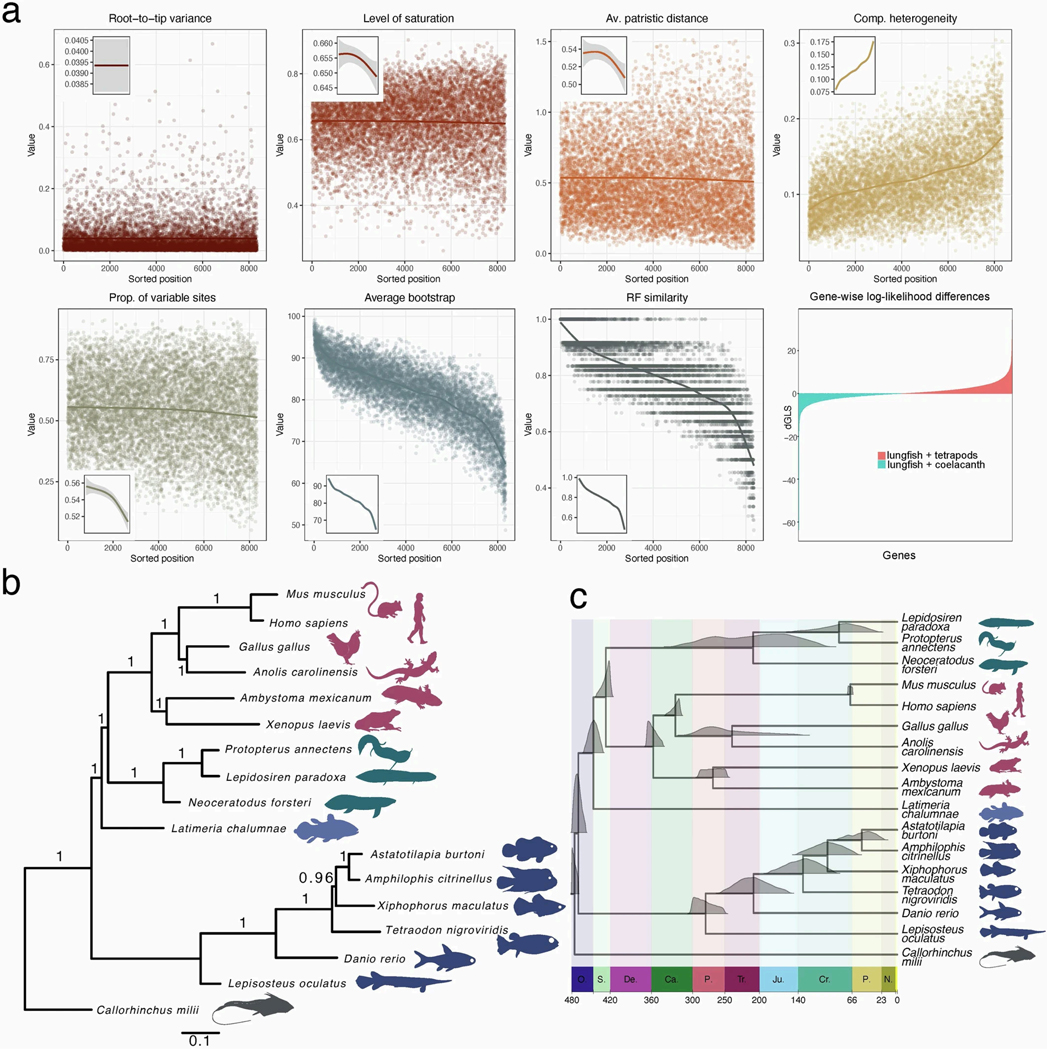
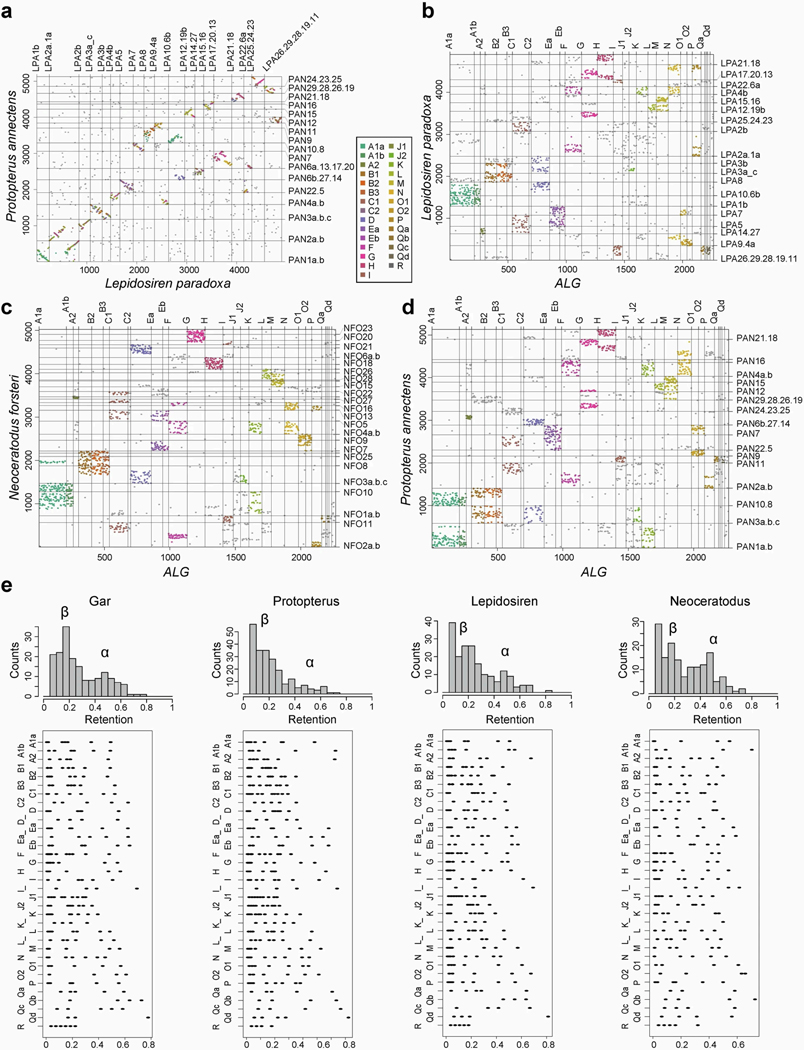
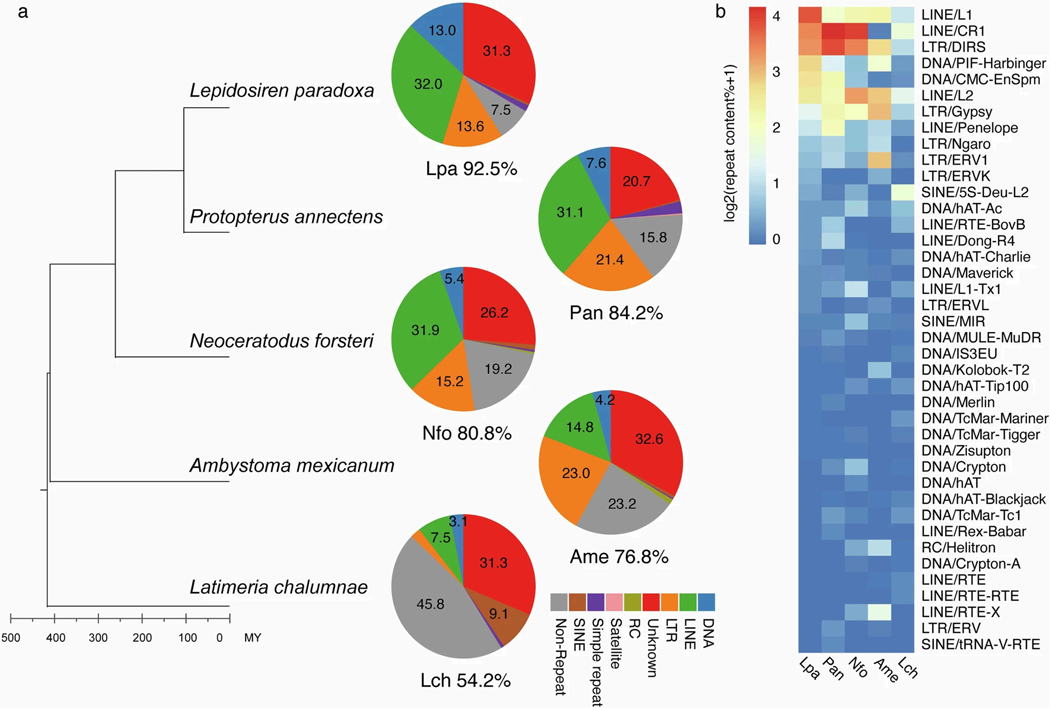
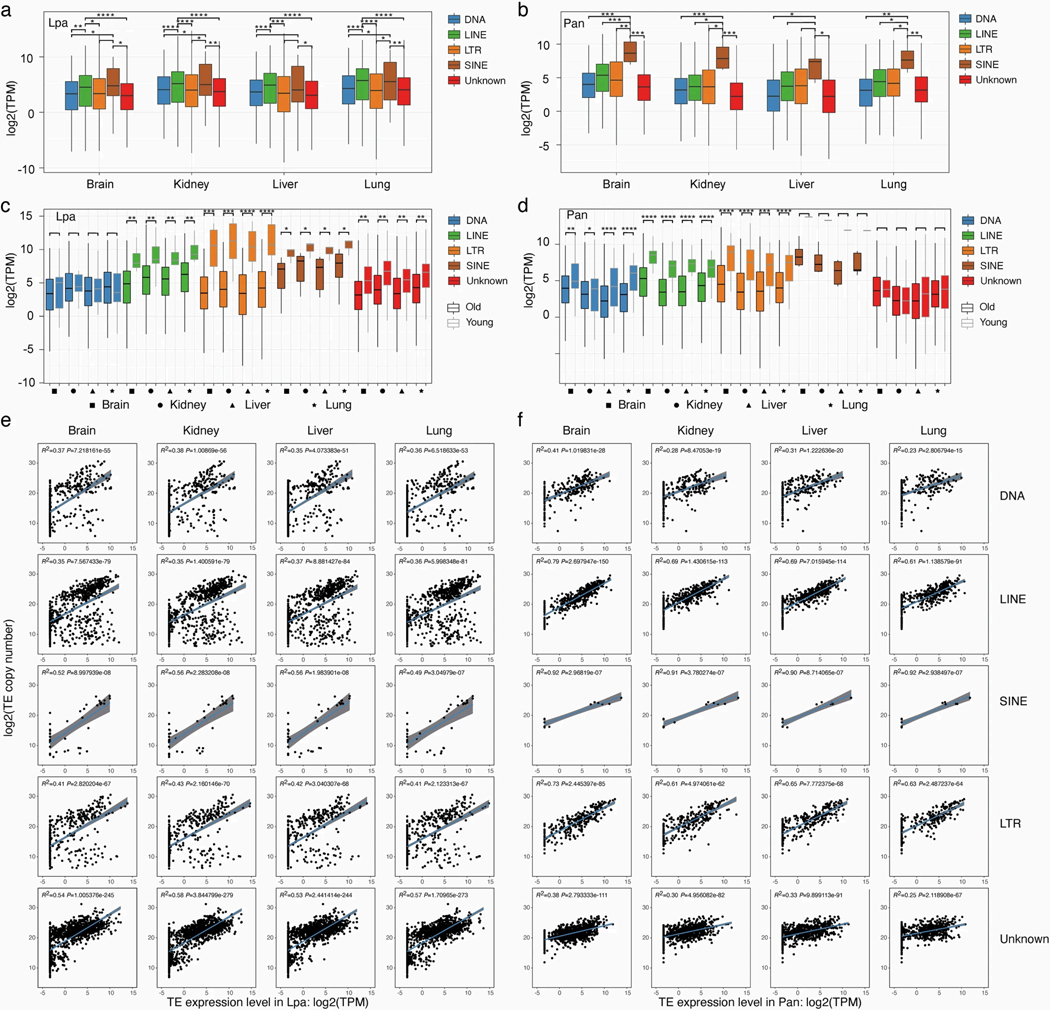
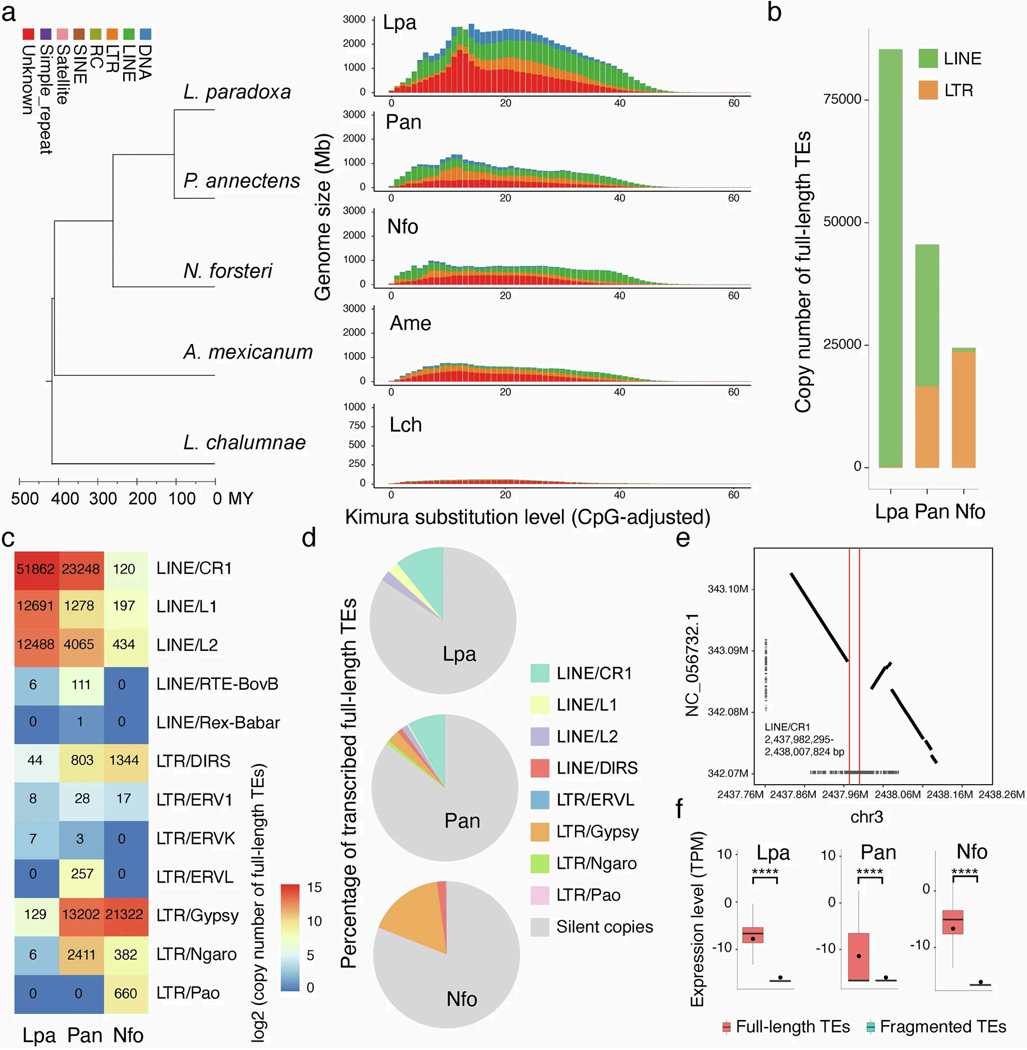
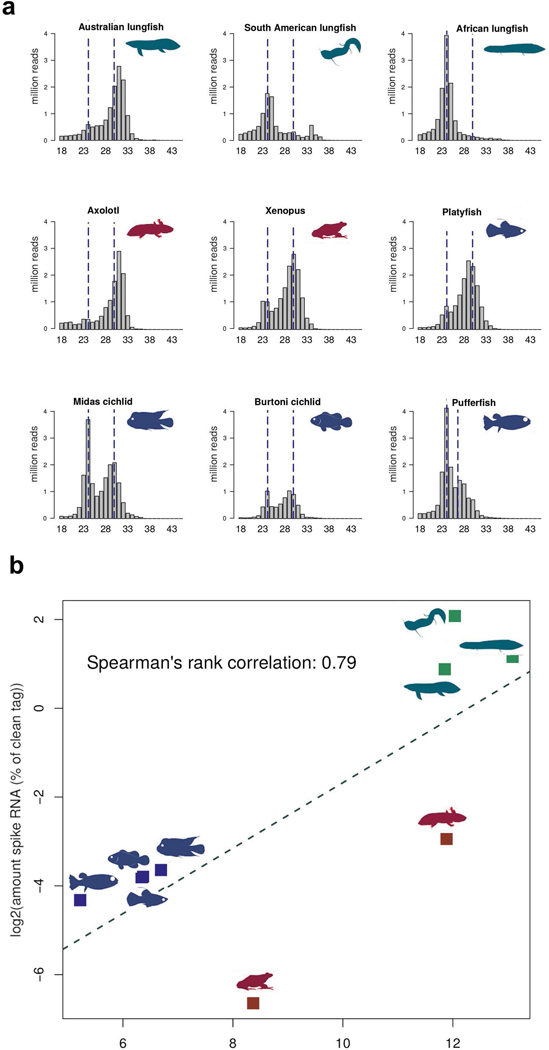
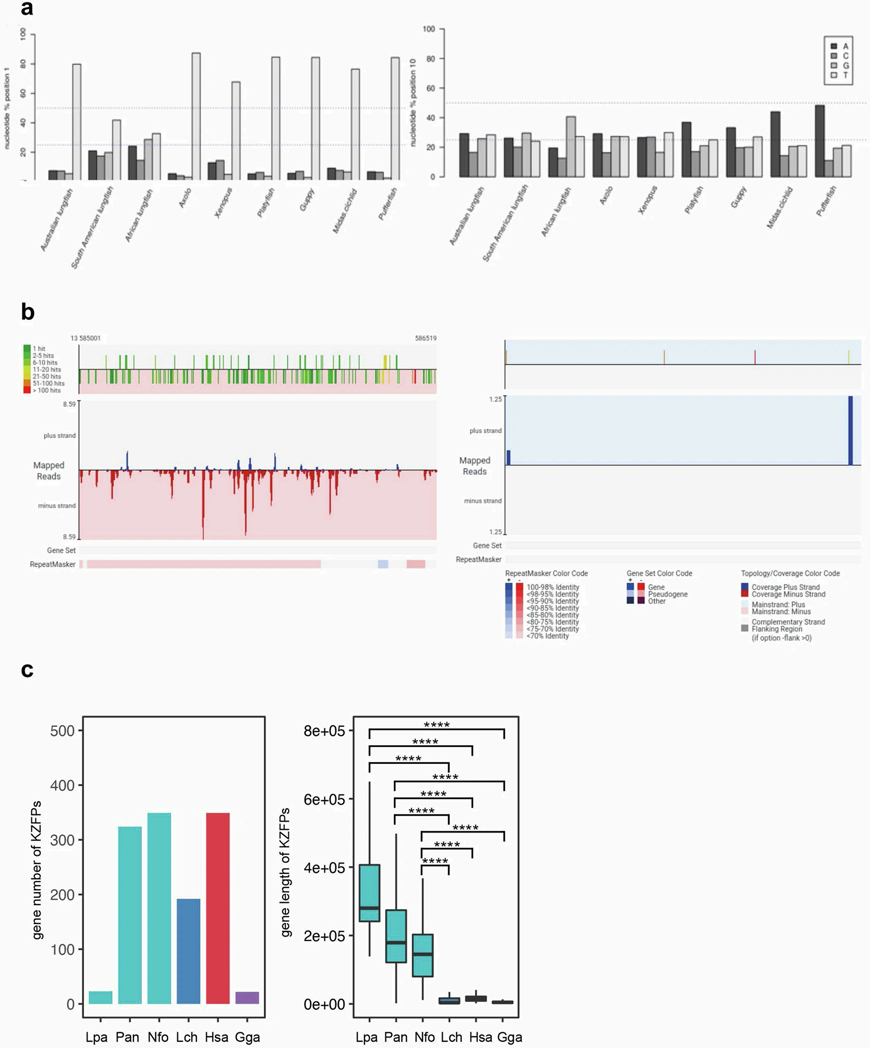
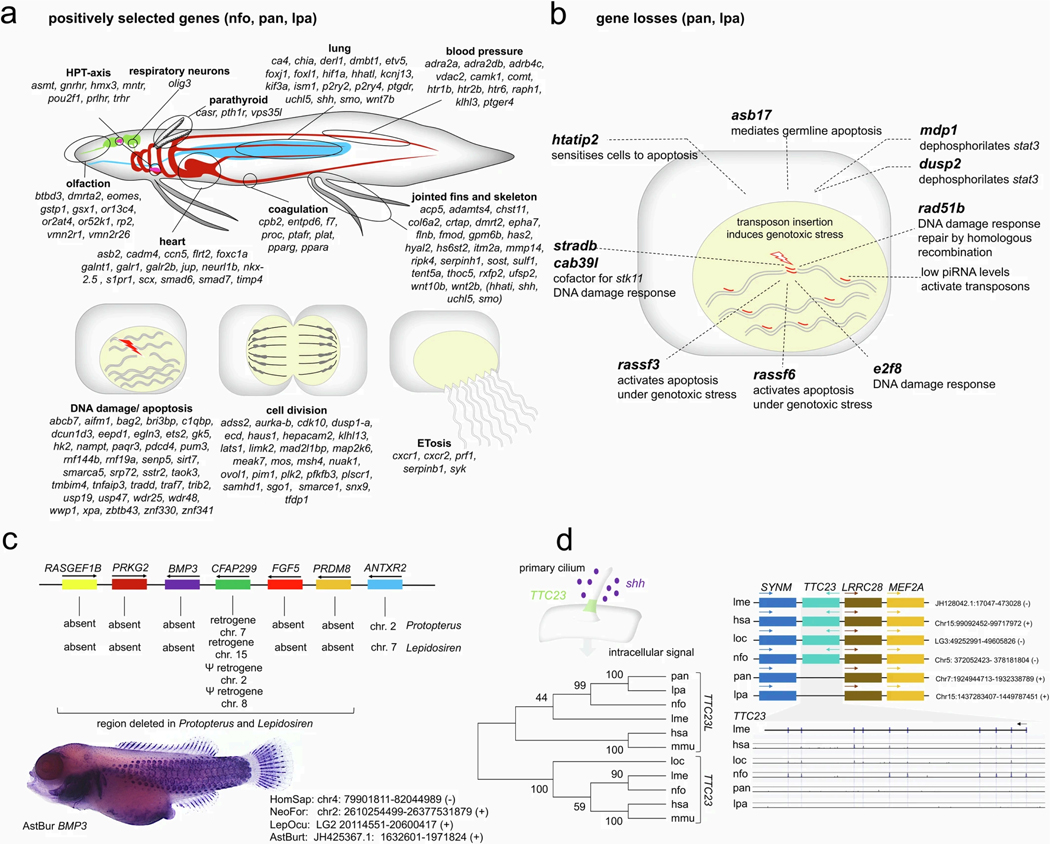
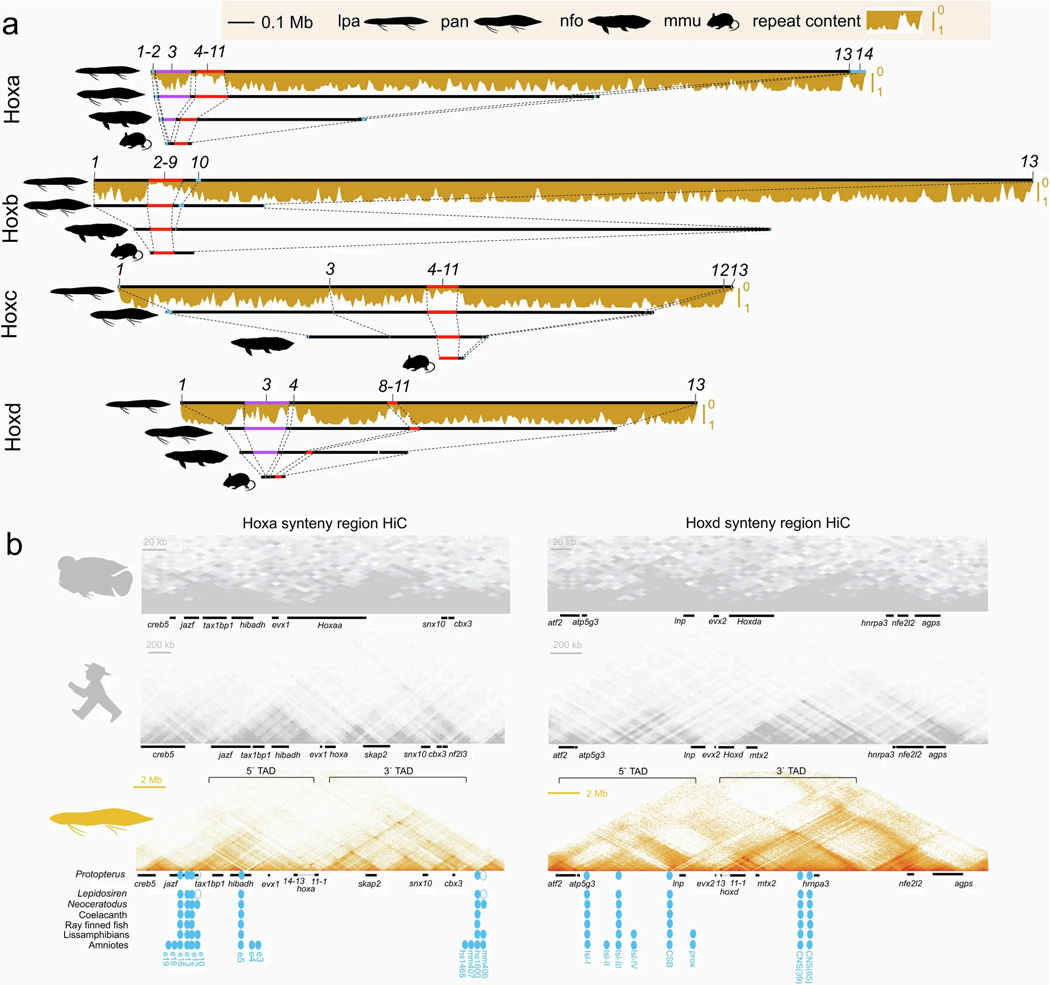
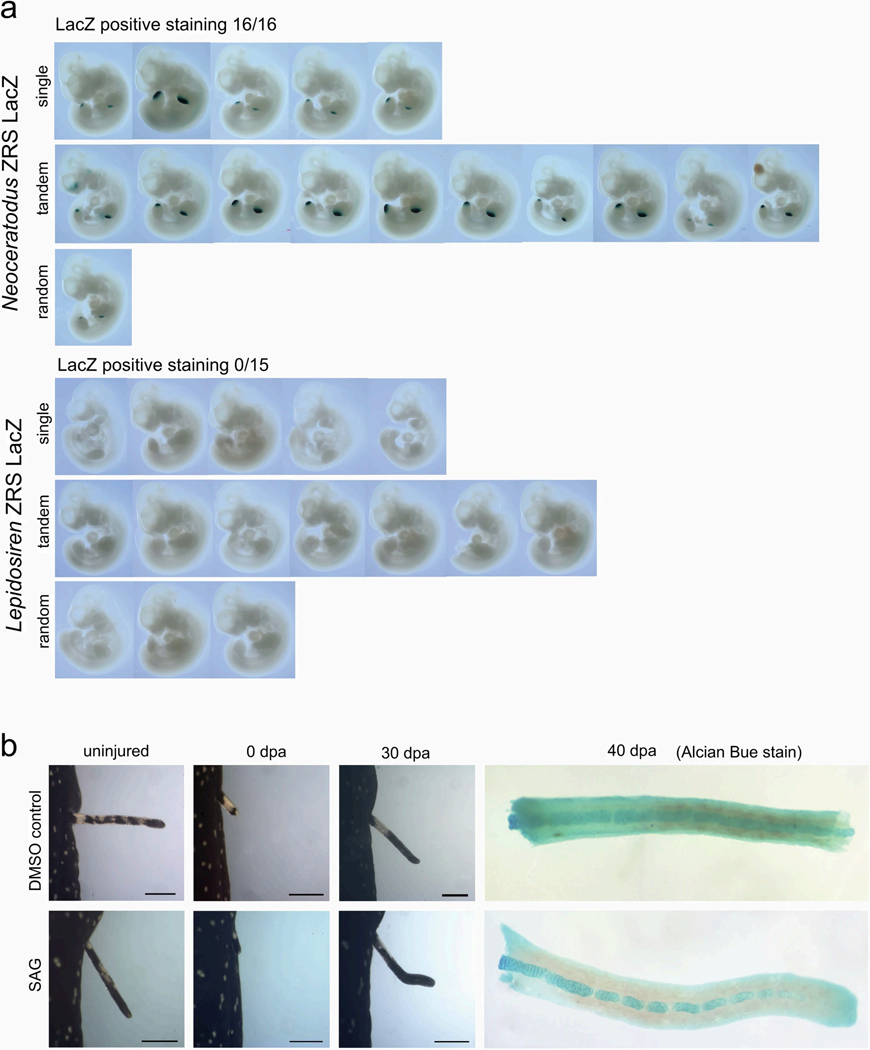
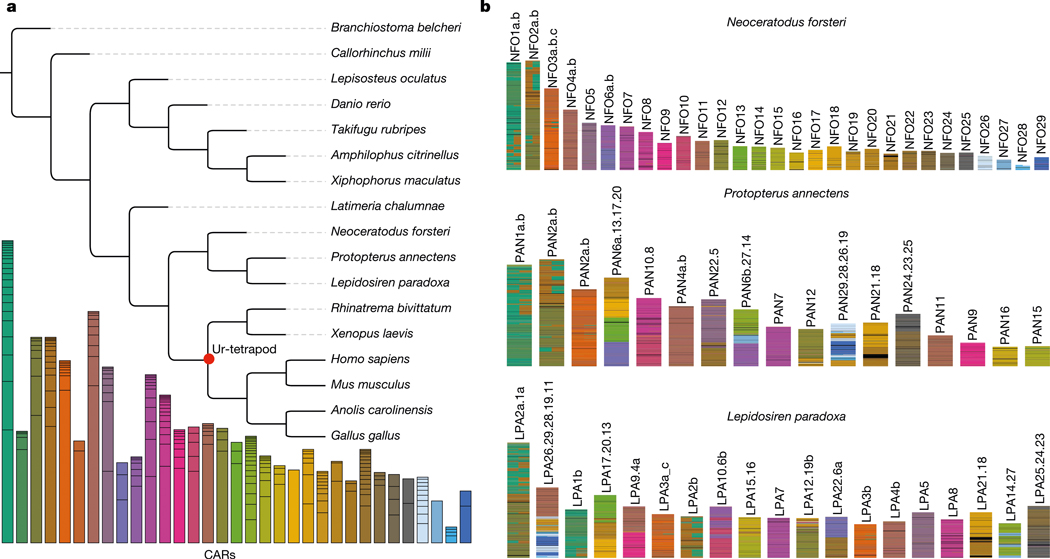
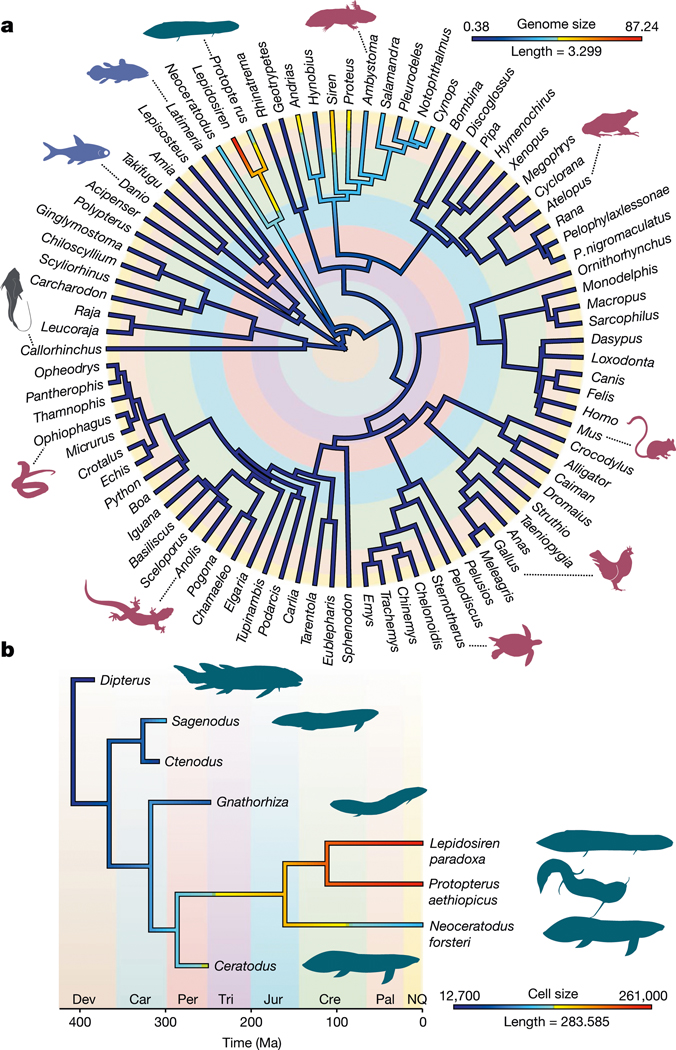
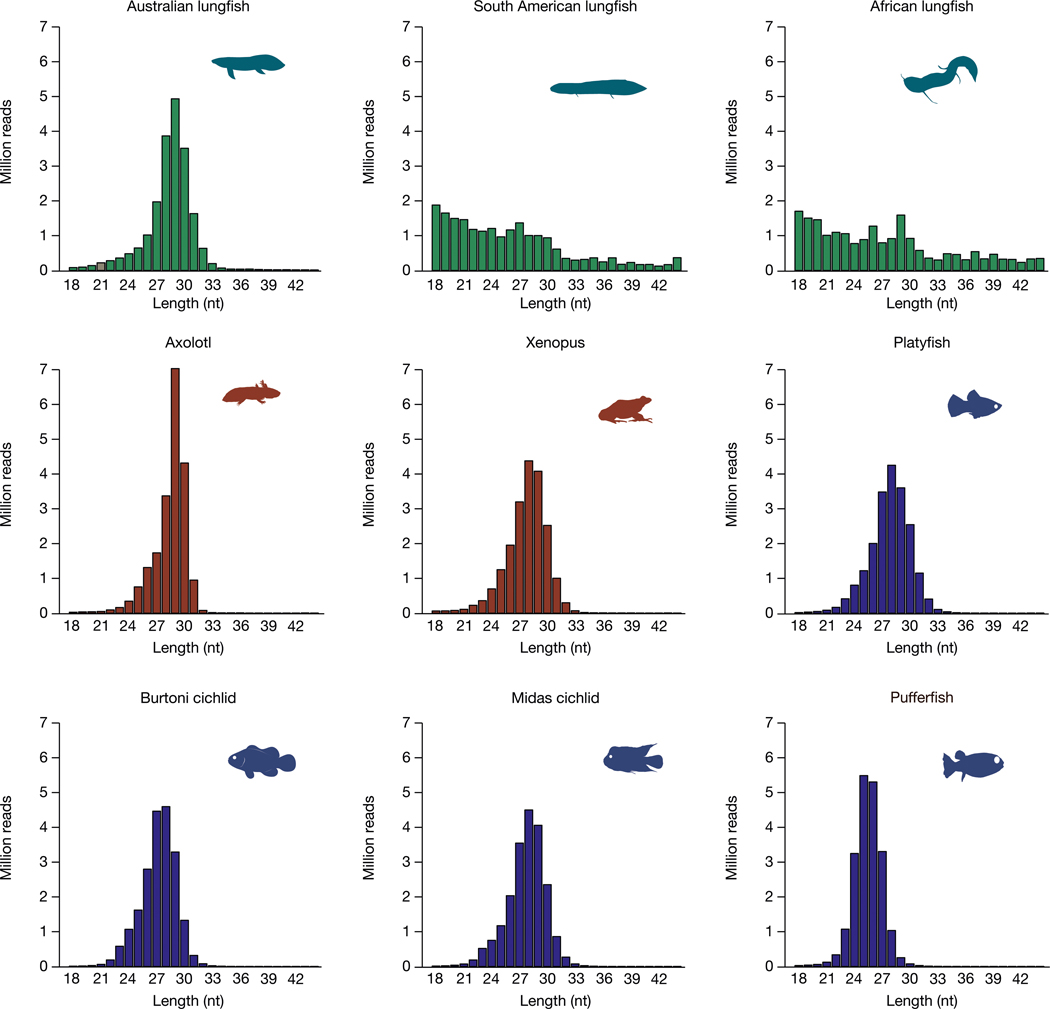
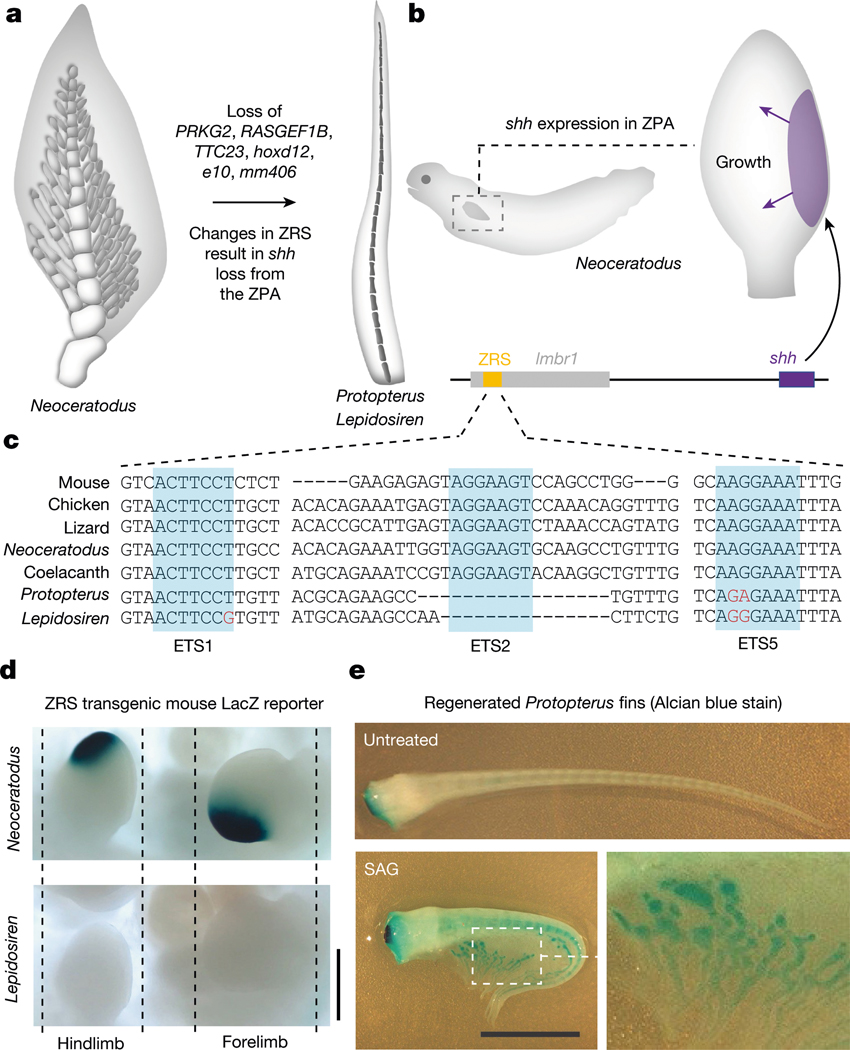
The genomes of living lungfishes can inform on the molecular-developmental basis of the Devonian sarcopterygian fish-tetrapod transition. We de novo sequenced the genomes of the African (Protopterus annectens) and South American lungfishes (Lepidosiren paradoxa). The Lepidosiren genome (about 91 Gb, roughly 30 times the human genome) is the largest animal genome sequenced so far and more than twice the size of the Australian (Neoceratodus forsteri)1 and African2 lungfishes owing to enlarged intergenic regions and introns with high repeat content (about 90%). All lungfish genomes continue to expand as some transposable elements (TEs) are still active today. In particular, Lepidosiren's genome grew extremely fast during the past 100 million years (Myr), adding the equivalent of one human genome every 10 Myr. This massive genome expansion seems to be related to a reduction of PIWI-interacting RNAs and C2H2 zinc-finger and Krüppel-associated box (KRAB)-domain protein genes that suppress TE expansions. Although TE abundance facilitates chromosomal rearrangements, lungfish chromosomes still conservatively reflect the ur-tetrapod karyotype. Neoceratodus' limb-like fins still resemble those of their extinct relatives and remained phenotypically static for about 100 Myr. We show that the secondary loss of limb-like appendages in the Lepidosiren-Protopterus ancestor was probably due to loss of sonic hedgehog limb-specific enhancers.


Conflict of interest statement

Competing interests The authors declare no competing interests.

Figures

Extended Data Fig. 1:
Extended Data Fig. 1:. Phylogenomics of lungfish.
a, Loci selection for phylogenomics. Graphs show different properties (root-to-tip variance, level of saturation, average patristic distance, compositional heterogeneity, proportion of variable sites, average bootstrap support, Robinson-Foulds similarity) for the 8,339 loci as inferred by genesortR. The graph of gene-wise log-likelihood differences shows support of each locus for two relevant alternative hypotheses (see Supplementary Information 2). b, Bayesian phylogram showing the evolutionary relationships and relative rates of the three lungfish genomes within the context of vertebrate phylogeny. The phylogeny was reconstructed as the consensus of 100 Markov chains (MCMC) from 100 independent gene jackknife replicates analyzed by PhyloBayes-MPI under the CAT mixture model (indicated with numbers on the internal edges, 1 = 100 replicates). The scale bar is the expected amino acid replacements per site. c. Bayesian time-calibrated phylogeny inferred from the set of 8,323 orthologs. Posterior probability distributions of estimated ages of common ancestors are plotted on tree nodes. X axis is in million years and major geological periods are indicated (O. Ordovician, S. Silurian, De. Devonian, Ca. Carboniferous, P. Permian, Tr. Triassic, Ju. Jurassic, Cr. Cretaceous, P. Paleogene, N. Neogene).
Extended Data Fig. 2:
Extended Data Fig. 2:. High retention of ancestral linkage groups lungfish genomes.
a-d, Species-to-species dotplots showing high degree of retained collinearity in the African and South American lungfish genomes, despite their genome size. b-d, Oxford dotplots representing orthologous genes shared on the previously reported ancestral linkage groups (ALGs). Chromosome numbering corresponds to the homologous lungfish linkage groups which have independently fused in individual lineages. Neoceratodus with its 27 chromosomes represented the most ancestral (unfused) state. e, Retention rates of lungfish chromosomes. Often only one alpha copy is present in lungfishes, e.g. descendants of several chromosomal elements have two alpha chromosomes in gar and Australian lungfish but only one clear alpha chromosome remains in South American and African lungfish (with the alpha copies having lost genes). Retention rates were computed as the percentage of the retained (present) ohnologs of gene families that comprise a given ancestral linkage group. Total number of gene families per chromosome was counted and their position was not taken into account. Only chromosomes with at least 5% ancestral linkage group retention were counted. Lower plots show retention on individual chromosomes (represented by dots) grouped by their ancestral linkage group in different lungfishes and gar.
Extended Data Fig. 3:
Extended Data Fig. 3:. Genomic composition of repetitive elements.
a, Overall composition of repetitive elements from unmasked assemblies (two rounds of transposable element annotation) for the three lungfish (Lpa=Lepidosiren paradoxa, Pan=Protopterus annectens, Nfo=Neoceratodus forsteri), axolotl (Ame=Ambystoma mexicanum), and coelacanth (Lch=Latimeria chalumnae). The total TE coverage for each species is shown under each pie chart. RC, rolling-circle transposon; SINE, short interspersed element; LINE, long interspersed element; LTR, long terminal repeat; DNA, cut-and-paste DNA transposons. Total repeat coverage of other species analyzed in this study: Xenopus ~25%; Platyfish ~23%; Burtoni and Midas cichlids ~30%; and Pufferfish ~8%. b, Different repeat superfamilies expanded in lungfish genomes. Heatmap shows the repeat superfamily content of coelacanth (Lch=Latimeria chalumnae), axolotl (Ame=Ambystoma mexicanum) and three lungfish (Lpa=Lepidosiren paradoxa, Pan=Protopterus annectens, Nfo=Neoceratodus forsteri). The color is scaled to the genomic content across repeat superfamilies.
Extended Data Fig. 4:
Extended Data Fig. 4:. Expression of transposable element families.
a, b, Expression estimated for each transposable element family from poly (A)-enriched RNA-seq data. In all tissues, SINEs are more highly expressed than any other subclass in the African lungfish, while both LINEs and SINEs are slightly more expressed than any other subclass in the South American lungfish. n = 2029 (African lungfish) and 1897 (South American lungfish) transposable element families. Wilcoxon Signed Ranks Test (one-sided) was applied with * indicating p-value < 0.05, ** p-value < 0.005, *** p-value < 0.0005 and **** p-value < 0.00005. The box bounds the interquartile range divided by the median value, with the whiskers extending to a maximum of 1.5 times the interquartile range beyond the box. c, d, Higher expression of young transposable element families. When transposable element families are divided into young or old copies based on Kimura 2-parameter distance to consensus values (0–10% is young, >10% is old), young TEs are significantly higher expressed than old ones, suggesting that several types of TEs remain active and contribute to the ongoing expansion of the lungfish genomes. Out of the 13 SINE families of Protopterus annectens, only copies from the SINE/t-RNA-V-RTE are considered as young. e, f, | Correlation between expression of transposable element families and copy number. Expression was estimated for each transposable element family using poly (A)-enriched RNA-seq data. For all tissues and transposable element classes, a positive correlation is observed between expression level and copy number. When a transposable element family is highly expressed, this family tends to have more copies. All analyzed correlations are significantly positive (p-values < 0.001). A linear model estimated trend line and calculated 95% confidence interval around the trend (gray fill) are plotted (two-sided). Lpa, Lepidosiren paradoxa; Pan, Protopterus annectens.
Extended Data Fig. 5:
Extended Data Fig. 5:. Age estimation and comparison of full-length TEs across lungfish genomes.
a, Landscape of subclasses of transposable elements. Kimura substitution level (%) for each copy against its consensus sequence used as proxy for expansion history of the transposable elements. Older copies accumulated more nucleotide substitutions and show higher distance to the consensus sequences. The phylogeny depicts the estimation of divergence times among the five studied species. RC, rolling-circle transposon; SINE, short interspersed element; LINE, long interspersed element; LTR, long terminal repeat. b, Copy numbers of full-length TEs within orders. c, Copy numbers of full-length TEs within superfamilies, color scaled to copy number. d, Percentage of transcribed TEs. e. Example of synteny to show one full-length copy from LINE/CR1 exclusively present in our Protopterus genome and absent in the other individual’s genome. f, Comparison of expression between full-length and fragmented TEs. n = 122, 832, 031 (South American lungfish), 66, 736, 976 (African lungfish) and 58, 296, 831 transposable elements. Wilcoxon Signed Ranks Test (one-sided) was applied with **** indicating p-value < 0.00005. The box bounds the interquartile range divided by the median value, with the whiskers extending to a maximum of 1.5 times the interquartile range beyond the box and the middle dots indicate mean values. Lpa=Lepidosiren paradoxa, South American lungfish; Pan=Protoperus annectens, African lungfish; Nfo=Neoceratodus fosteri; Australian lungfish.
Extended Data Fig. 6:
Extended Data Fig. 6:. Size distribution and correlation between piRNA content and genome size.
a, Size distribution of clean reads of unoxidized small second distinct peak at the expected size range of piRNAs. b, Spearman rank RNA libraries of the same individuals as used for the piRNA analysis, with the correlation between genome size (log scale) and %RNA of clean tag) from the position of the peaks for miRNA and piRNA marked with dotted lines. In contrast oxidized testis small RNAs (silhouettes as in a). to the oxidized samples African and South American lungfish have a clear peak at the expected size range of miRNAs (~24 nts), but unlike the other species no second distinct peak at the expected size range of piRNAs. b, Spearman rank correlation between genome size (log scale) and %RNA of clean tag) from the oxidized testis small RNAs (silhouettes as in a).
Extended Data Fig. 7:
Extended Data Fig. 7:. Signature nucleotides of piRNAs, piRNA cluster structure and KZFP genes.
a, Proportion of nucleotides of the small RNA reads at the first position (left) and the tenth position (right) of the three lungfish, amphibian and fish samples. b, Graphical proTRAC output of a representative piRNA cluster for the pufferfish (left panel) and the South American lungfish (right panel). The top part visualizes the number of genomic hits produced by the query piRNA sequence. Dark green indicating that there is only one sequence hit in the genome, dark red indicating more than 1000 hits. Below is the sequence read coverage plot (blue: reads on the plus strand, red: reads on the minus strand). The RepeatMasker bar shows TEs annotated by RepeatMasker in this region. Lungfish clusters tend to have lower diversity and a higher read count. c, C2H2 zinc-finger and KRAB domain protein (KZFP) gene counts and genomic organization in sarcopterygians. Left, number of KZFP genes in indicated genomes. Right, gene length of KZFP genes in indicated species. n = 1168 KZFPs. Wilcoxon Signed Ranks Test (one-sided) was applied with **** indicating p-value < 0.00005. The box bounds the interquartile range divided by the median value, with the whiskers extending to a maximum of 1.5 times the interquartile range beyond the box. Lpa=Lepidosiren paradoxa; Pan=Protopterus annectens; Nfo=Neoceratodus forsteri; Lch=Latimeria chalumnae; Hsa=Homo sapiens; Gga=Gallus gallus.
Extended Data Fig. 8:
Extended Data Fig. 8:. Positively selected genes and gene losses.
a, Positively selected genes in all three lungfishes related to lungfish biology. b, Numerous gene losses in Lepidosiren paradoxa and Protopterus annectens indicate a cellular milieu that is permissive of transposon spreading due to a reduction in the DNA damage response and apoptosis. Due to low piRNA levels (through an as of yet unidentified mechanism) high activity of transposable elements is present in the germline resulting in frequent insertions and high levels of genotoxic stress due to double stranded DNA breaks which tend to result in G1 arrest and apoptosis as part of the DNA damage response which provides a mechanism for somatic selection against compromised cells. These gene losses are expected to reduce the levels of such selection and create a permissive environment for DNA transposition and helps explain the rapid expansion of the lungfishes’ genomes. c, The synteny block spanning RASGEF1B to ANTXR2 is widely preserved across vertebrates. The region containing RASGEF1B to PRDM8 has been deleted in Lepidosiren paradoxa and Protopterus annectens. The ciliary CFAP299 gene is still present in both species as an intronless retrogene. Loss of BMP3 can be linked to the reduced squamation of the derived Lepidoserenidae, while loss of PRKG2 and RASGEF1B can be linked to their derived fins. In the ray finned fish Astatotilapia burtoni, BMP3 is strongly expressed in the developing scales at 12 dpf. d, TTC23 is a component of the primary cilia and involved in the cellular perception of the shh signal transduction pathway. TTC23 is located in a highly conserved gene block which is also preserved in Lepidosiren paradoxa and Protopterus annectens, however without an identifiable TTC23 gene present. This “ghost locus” was further analyzed using Lagan Vista. Paired Lagan using the translated anchoring option and the Coelacanth sequence as baseline identifies the TTC23 exons in human, spotted gar and Neoceratodus forsteri, but not in Lepidosiren. paradoxa and Protopterus annectens.
Extended Data Fig. 9:
Extended Data Fig. 9:. Expanded hox clusters preserve regulatory landscape architecture.
a, In spite of a dramatic expansion of the lungfish Hox clusters whereby the Lepidosiren paradoxa clusters are approximately 20-fold enlarged compared to mouse, which is lower than the proportional difference in genome size. Consistent with this observation is that all four clusters preserve a conserved core subcluster (indicated in red) that has expanded relatively little and is low in repeat content. These regions are hoxa4-a11, hoxb2-b9, hoxc4-c11 and hoxd8-d11 indicating topological constraints on the expansion of these regions. In addition, hoxa3 and hoxd3 (purple) show expansion of their intronic region, which is similar to the expansion of the hoxa3 intron in the expanded axolotl Hoxa cluster. An interesting difference is that the hoxa11-hoxa13 intergenic shows a tendency for expansion in lungfishes but not in axolotl, potentially related to additional constraints induced by the fin to limb transition. Furthermore, signatures of repeat insertion in the anterior Hoxc and posterior Hoxb clusters mirror those observed in anolis lizards. b, HiC analysis for Midas cichlid, human and Protopterus annectens Hoxa and Hoxd clusters. Despite the approximate 70 times size difference between these species there is a remarkable conservation of the flanking regulatory landscapes whereby both clusters are present on the intersection of a 3’ and 5’ TAD. Known fin and limb enhancers (blue ovals) are conserved in an expected fashion (open ovals for Lepidosirenidae mm406 and e10 indicate secondary loss), altogether suggesting that long range regulatory landscapes remain preserved under conditions of genome expansion. Synteny regions shown encompass the following sizes: HoxA; Pan 3.2 Mb, Hsa 3.1 Mb Aci 0.31 Mb, Hoxd; Pan 28 Mb, Hsa 2.8 Mb, Aci 0.41 Mb. Species name abbreviations are the same as in the other figures.
Extended Data Fig. 10:
Extended Data Fig. 10:. Functional analysis of lungfishes ZRS and SAG treatment of Lepidosiren paradoxa regenerating fins.
a, Mouse transgenesis and LacZ staining for the Neoceratodus forsteri and Lepidosiren paradoxa ZRS sequences. Genotyping indicates whether insertion was either in a single or double copy at the targeted locus, or randomly integrated in the genome. Neoceratodus forsteri ZRS gives ZPA staining in 16/16 embryos, whereas the Lepidosiren paradoxa ZRS does not give staining in 15/15 embryos. b, Regeneration of pectoral fins in presence of the shh agonist SAG does not result in radial growth in Lepidosiren paradoxa (n = 3 for SAG treated animals, n = 3 for DMSO-treated animals; representative images of one animal per treatment are shown).
Fig. 1 |
Fig. 1 |. Lungfish chromosomes help reconstruct the ur-tetrapod/vertebrate syntenic units.
a, AGORA reconstruction of CARs for different nodes on the vertebrate tree. The CARs of the ur-tetrapod are shown below the tree; each CAR represents one ALG or parts of ALGs. Individual CARs are grouped by Neoceratodus chromosomal homologies (Extended Data Fig. 2), showing that most of Neoceratodus chromosomes are often dominated by a single dominant reconstructed ur-tetrapod CAR, with other CARs likely to be part of the same ancestral ur-tetrapod chromosome. Black horizontal lines separate individual CARs that belong to an ur-tetrapod chromosome. b, Ancestral ‘ur-tetrapod’ CARs can be further traced in lungfish genomes, suggesting their additional mixing in Protopterus and Lepidosiren.
Fig. 2 |
Fig. 2 |. Genome and cell size evolution.
a, Maximum likelihood reconstructions of the evolution of genome size in jawed vertebrates. Genome size evolution used a new Bayesian time-calibrated phylogeny and genome size values obtained from assembled genomes or the Genome Size Database (http://www.genomesize.com/search.php). b, Maximum likelihood reconstruction of cell size evolution in lungfish. Cell size reconstruction used the tip-dated phylogeny of ref. , including extinct lungfishes and cell size data from ref. . Branch lengths are in million years and colours denote genome size (in Gb) or cell volume (μl3). Major geological periods are highlighted with colours. Dev, Devonian; Car, Carboniferous; Per, Permian; Tri, Triassic; Jur, Jurassic; Cre, Cretaceous; Pal, Paleogene; NQ, Neogene–Quaternary.
Fig. 3 |
Fig. 3 |. Size distribution of clean reads of oxidized small RNA libraries from the three lungfish, amphibians and fish.
Except for the African and South American lungfish, all species have a clear peak at the expected size range of piRNAs.
Fig. 4 |
Fig. 4 |. Fin reduction in the Lepidosirenidae.
a, In comparison with the fins of the Australian lungfish, South American and African lungfish fins have absent or strongly reduced distal radials and gracile central radials, potentially related to loss of PRKG2, RASGEF1B, TTC23, hoxd12, e10 and mm406 and modification of the shh pathway. b, In the Australian lungfish, shh is expressed in a conserved posterior fin domain, the ZPA, which is driven by the ultraconserved long-range ZRS enhancer located in the LMBR1 gene. c, Genomic analysis of the ZRS enhancer indicates that South American and African lungfishes have modified and lost ETS transcription factor binding sites. d, Transgenic analysis in mouse limbs shows that the Australian lungfish ZRS drives the expected expression in the ZPA (16/16 embryos), whereas the South American lungfish ZRS does not show such activity (15/15 embryos). e, Stimulating regenerating African lungfish fins with the Shh agonist SAG results in the elaboration of post-axial radials (arrowheads) and partially rescues the ancestral phenotype (SAG-treated, n = 7; untreated, n = 7; representative image of one animal is shown). Scale bars, 0.5 cm (d), 1 cm (e).

References

    1. Meyer A et al. Giant lungfish genome elucidates the conquest of land by vertebrates. Nature 590, 284–289 (2021). - PMC - PubMed
    1. Wang K et al. African lungfish genome sheds light on the vertebrate water-to-land transition. Cell 184, 1362–1376.e1318 (2021). - PubMed
    1. Irisarri I et al. Phylotranscriptomic consolidation of the jawed vertebrate timetree. Nat. Ecol. Evol 1, 1370–1378 (2017). - PMC - PubMed
    1. Krefft JLG Description of a gigantic amphibian allied to the genus Lepidosiren from the Wide-Bay district, Queensland. Proc. Zool. Soc. Lond 1870, 221–224 (1870).
    1. Meyer A & Dolven SI Molecules, fossils, and the origin of tetrapods. J. Mol. Evol 35, 102–113 (1992). - PubMed

MeSH terms

LinkOut - more resources