. 2024 Aug;632(8027):1082-1091.
doi: 10.1038/s41586-024-07807-0. Epub 2024 Aug 14.

The genomic basis of childhood T-lineage acute lymphoblastic leukaemia

Affiliations

The genomic basis of childhood T-lineage acute lymphoblastic leukaemia

Petri Pölönen et al. Nature. 2024 Aug.

Abstract

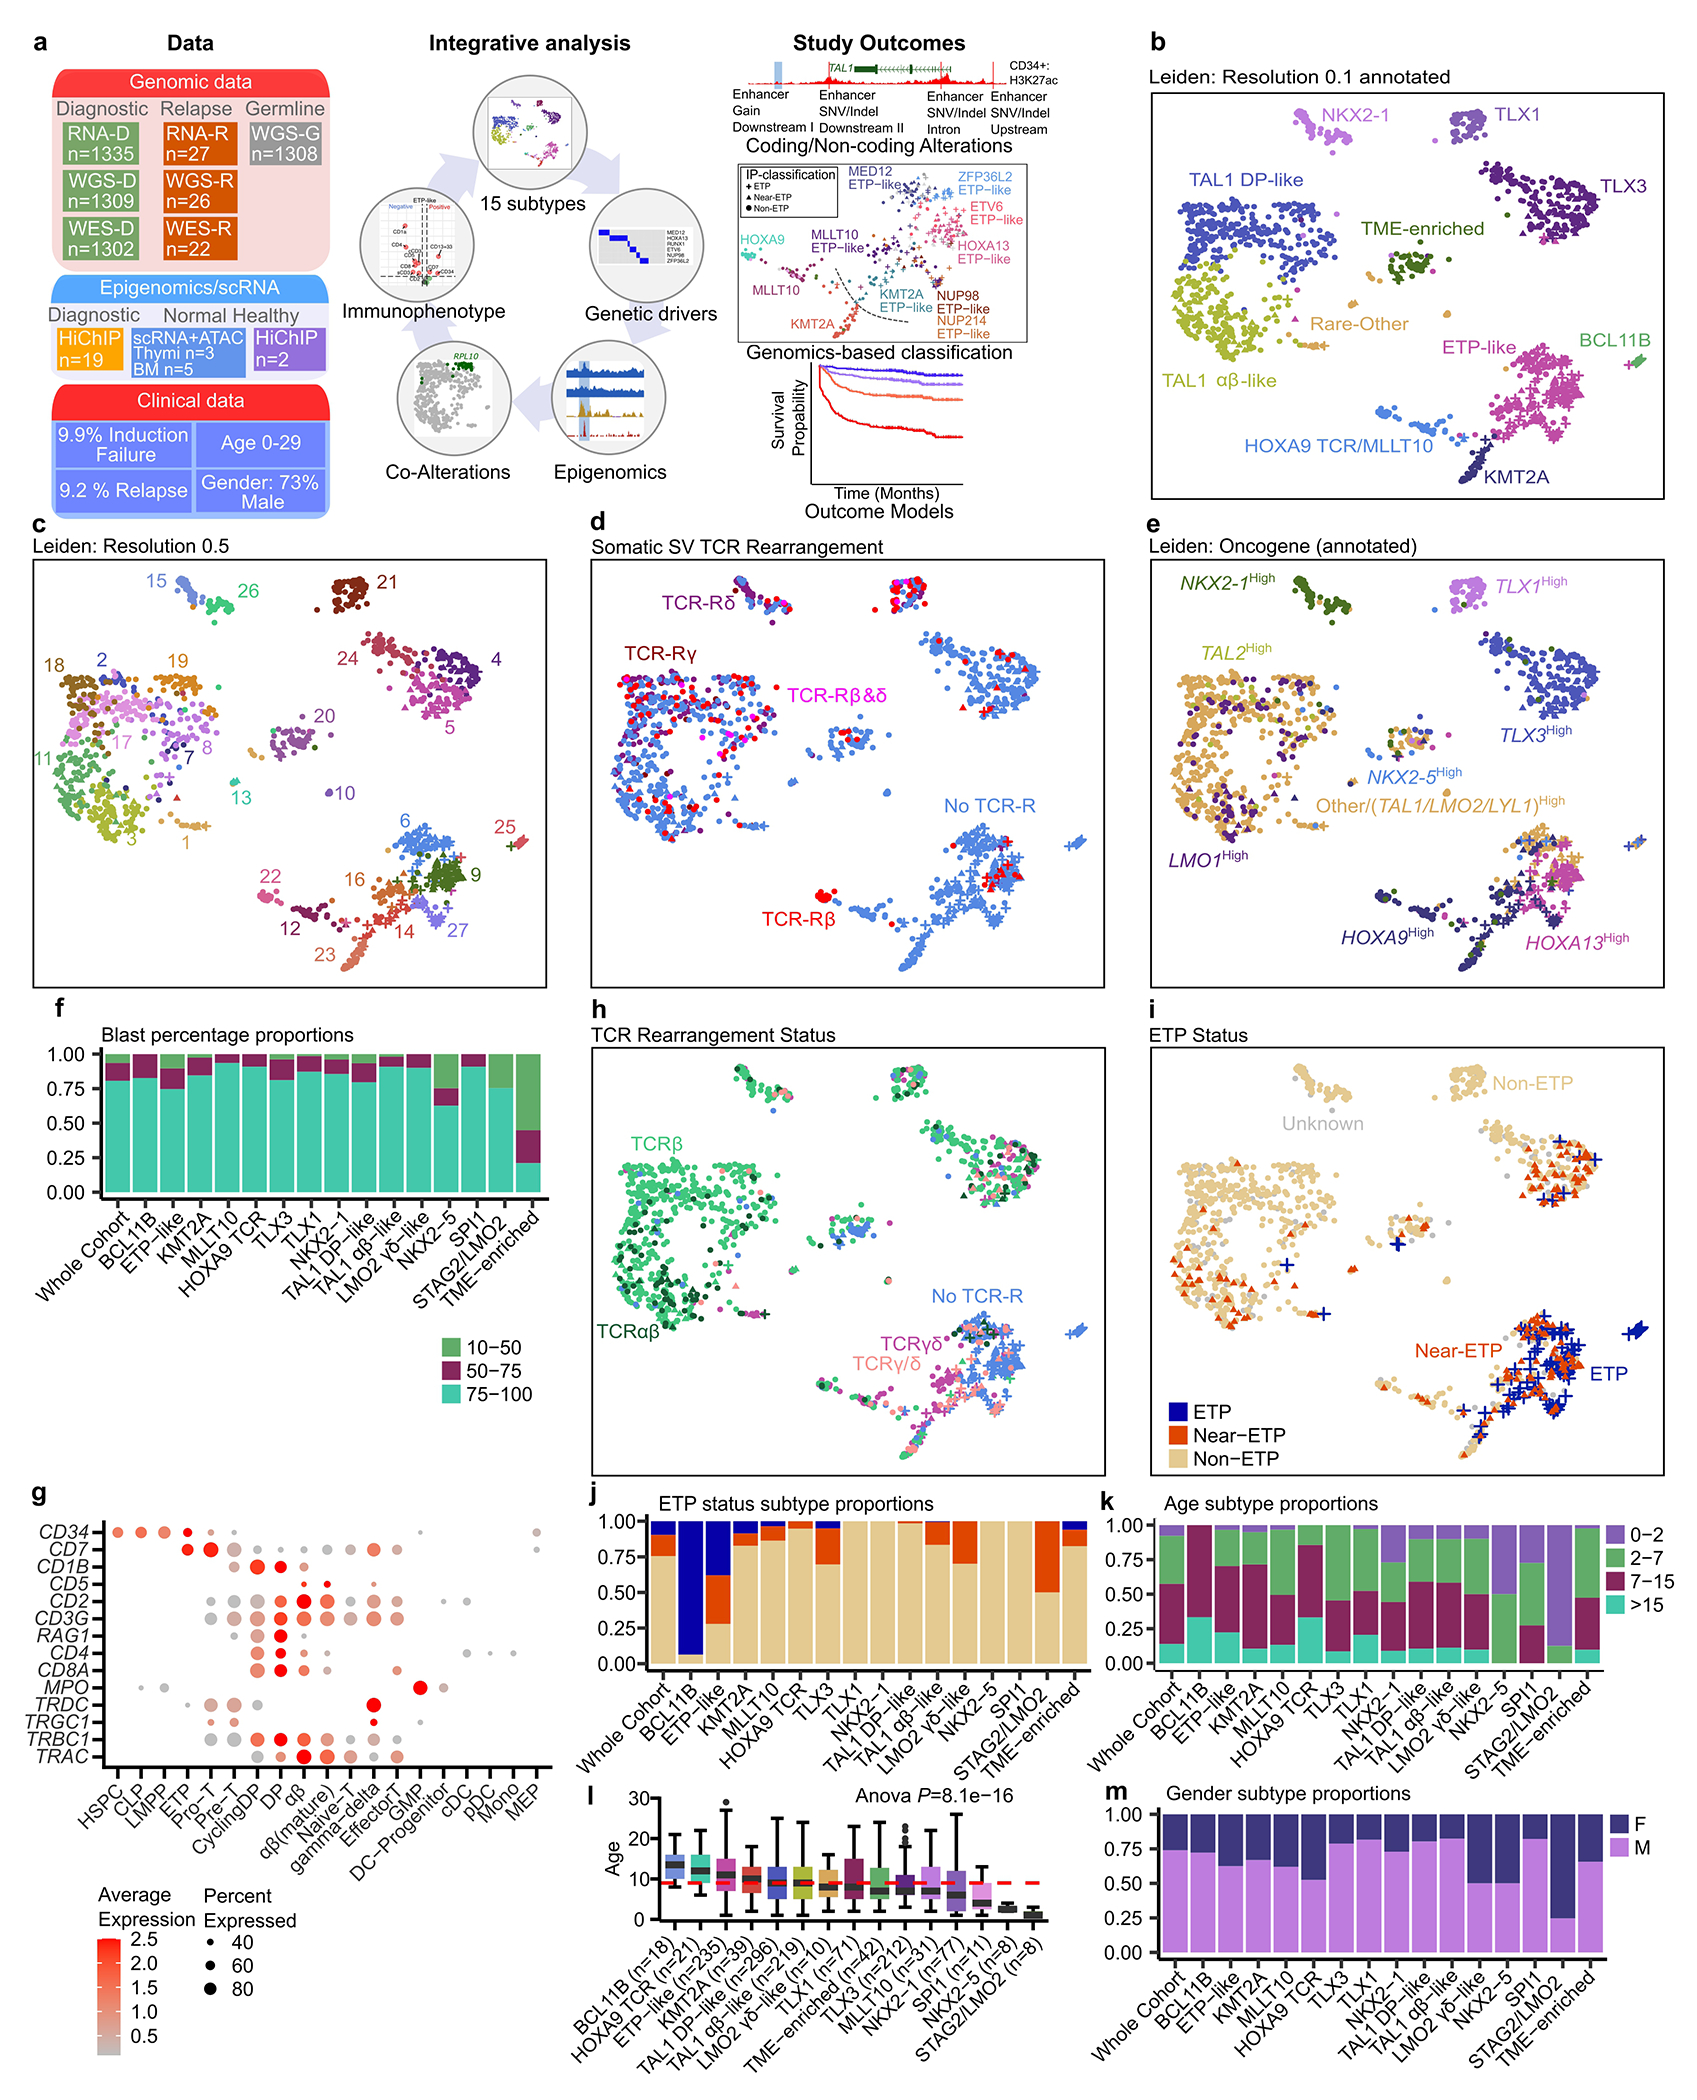
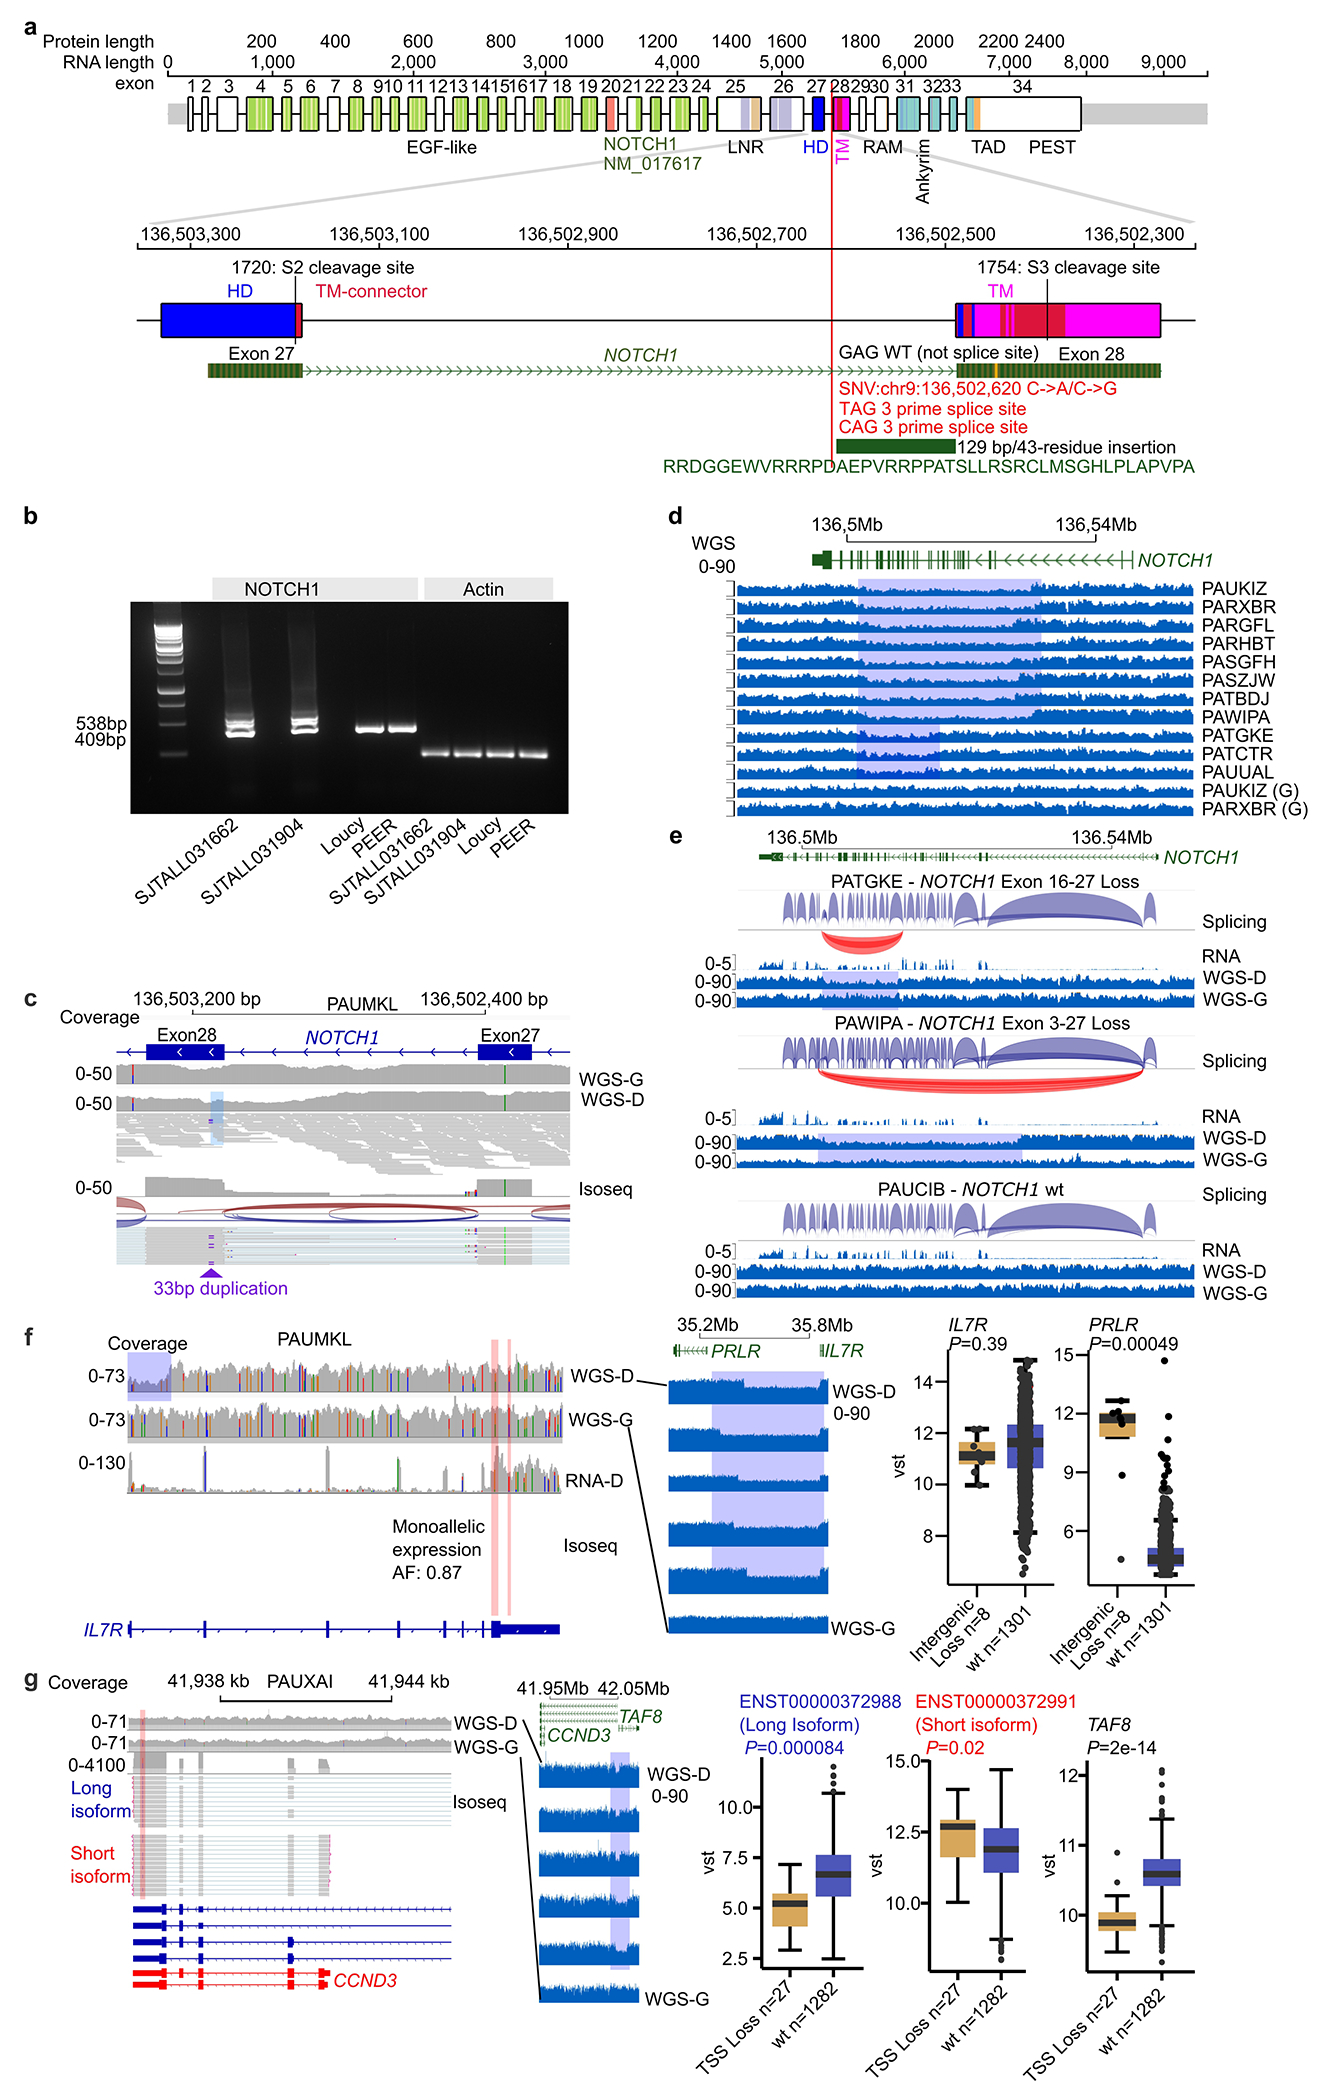
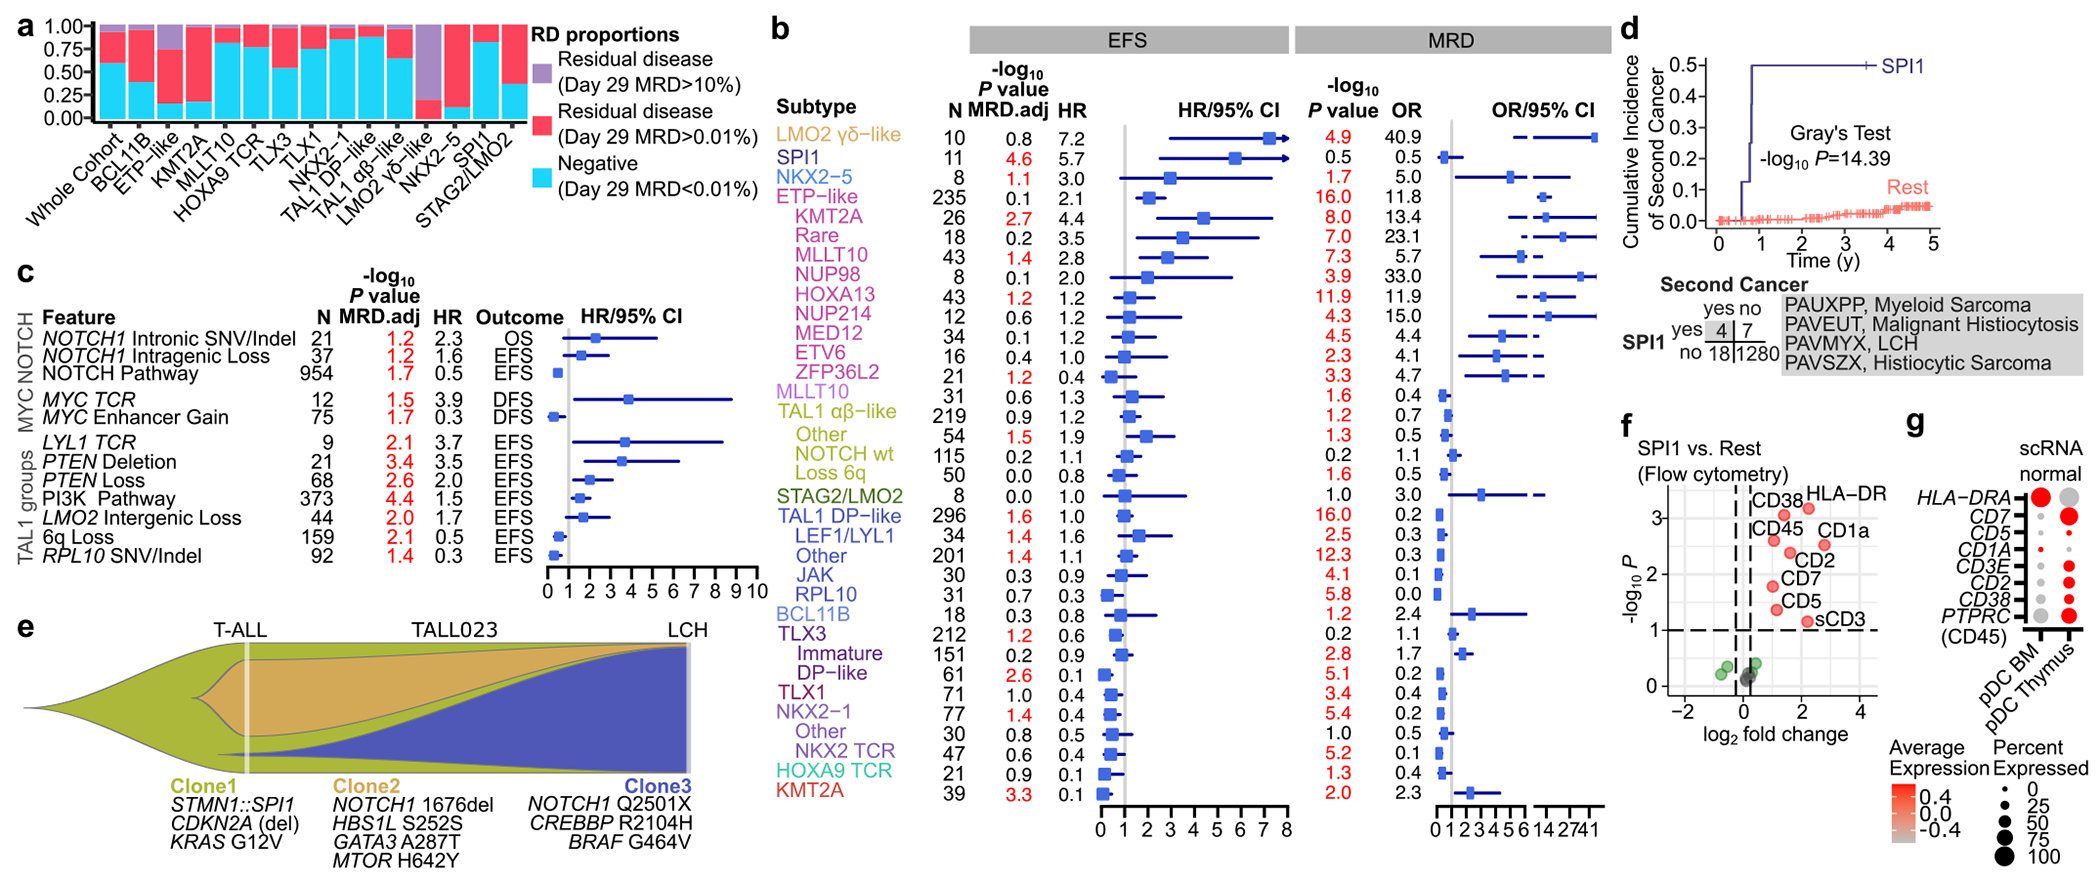
T-lineage acute lymphoblastic leukaemia (T-ALL) is a high-risk tumour1 that has eluded comprehensive genomic characterization, which is partly due to the high frequency of noncoding genomic alterations that result in oncogene deregulation2,3. Here we report an integrated analysis of genome and transcriptome sequencing of tumour and remission samples from more than 1,300 uniformly treated children with T-ALL, coupled with epigenomic and single-cell analyses of malignant and normal T cell precursors. This approach identified 15 subtypes with distinct genomic drivers, gene expression patterns, developmental states and outcomes. Analyses of chromatin topology revealed multiple mechanisms of enhancer deregulation that involve enhancers and genes in a subtype-specific manner, thereby demonstrating widespread involvement of the noncoding genome. We show that the immunophenotypically described, high-risk entity of early T cell precursor ALL is superseded by a broader category of 'early T cell precursor-like' leukaemia. This category has a variable immunophenotype and diverse genomic alterations of a core set of genes that encode regulators of hematopoietic stem cell development. Using multivariable outcome models, we show that genetic subtypes, driver and concomitant genetic alterations independently predict treatment failure and survival. These findings provide a roadmap for the classification, risk stratification and mechanistic understanding of this disease.


Conflict of interest statement

D.T.T. received research funding from BEAM Therapeutics, NeoImmune Tech and serves on advisory boards for BEAM Therapeutics, Janssen, Servier, Sobi, and Jazz. D.T.T. has multiple patents pending on CAR-T. C.G.M. serves on the scientific advisory board and honoraria for Illumina, and received research funding from Pfizer, equity from Amgen and royalties from Cyrus. E.R Institutional research funding from Pfizer and serving on a Data and Safety Monitoring Board for Bristol Myers Squibb. I.I. Travel and accommodation expenses reimbursed by Mission Bio. I.I and P.P Consultancy fee by Arima Genomics. K.M.B research funding from Syndax.

Figures

Extended Data Figure 1.
Extended Data Figure 1.. T-ALL cohort composition and subtyping.
a, Schematic depiction of the cohort composition, analysis framework, and study outcomes; b, UMAP scatter plots illustrating Leiden algorithm clusters at 0.1 resolution, annotated by subtype; c, Leiden algorithm clusters at 0.5 resolution, further delineating distinct groups; d. UMAP plot showing types of TCR loci involved in structural variants (SV) that lead to oncogene activation by enhancer hijacking; e, Leiden algorithm clusters showing oncogene expression patterns; f, Bar plot presenting blast percentage distribution proportions, categorized by subtypes; g, Dot plot of marker genes from Fig.2 in normal cell scRNA data, depicting average (mean) expression (dot color) and detection percentage (dot size); h, UMAP plot showing the identification of clonal TCR rearrangements in cancer cells; i, UMAP plot of ETP status; j, Bar plot of ETP status proportions for cases with known immunophenotype, categorized by subtypes, see panel i for legend (two-tailed Chi-square test P=3.25e-104, see N for each subtype from l, whole cohort N=1309).; k, Bar plot showing age distribution proportions, categorized by subtypes and ordered by median age; l, Box plot, as defined in Fig.3d legend, presenting age distributions per subtypes, with P value from one-way ANOVA. (two-sided pairwise t-test Holm-adjusted P for significant pairs using TAL1 DP-like as comparison group: BCL11B P=0.0053, ETP-like P=0.00016, HOXA TCR P=0.019, NKX2-1 P=0.0092, NKX2-5 P=0.0014, SPI1 P=0.049, STAG2/LMO2 P=0.00023). Median age in the cohort is shown as red dotted line; m, Bar plot depicting gender distribution proportions, categorized by subtypes (two-tailed Chi-square test P=0.000000417, see N for each subtype from l, whole cohort N=1309).
Extended Data Figure 2.
Extended Data Figure 2.. Alterations in T-ALL and subtype-associated genetic changes.
a, Stacked bar plot depicting proportions of alteration types for significantly altered genes (q<0.05 and altered in >1% of cases). Left: frequency of alteration types. Right: alteration frequencies; b, Dot plot illustrating altered genes, broad CNVs, and pathways significantly associated with subtypes, displaying odds ratio as dot color and −log10 FDR as dot size. Odds ratios and −log10 FDR were truncated at 20. Genes/lesions are ordered by significance within each subtype.
Extended Data Figure 3.
Extended Data Figure 3.. Genomic characterization of enhancer hijacking events.
a, Complex chromosome 7 rearrangements: Depiction of H3K27ac HiChIP, H3K27ac coverage, diagnostic sample, and germline WGS coverage in a T-ALL patient, showing interactions between HOXA13 and TCRβ loci after chromosome 7 rearrangements. Arcs represent interactions between genomic loci, with color coding denoting interaction strength at 500 kb resolution. Breakpoints are annotated by orange lines. Left: Boxplot, as defined in Fig.3d legend, of HOXA13 gene expression and P value for TCR::HOXA13 mutated (mut) vs HOXA13 unaltered wild type (wt) samples (two-tailed Student t-test, P values were not adjusted for multiple comparison), with PAVHBC sample labeled in cyan. The intensity of each arc represents contacts at 5kb resolution between a pair of loci. Maximum intensity is indicated in the color scale; b, TCR::HOXA9 Inversion: Similar representation as a; c, TCR:: LMO3 translocation: similar representation as a; d, BCL11B::LMO2 translocation: Similar representation as a; e, HOXA13 BCL11B translocation: similar representation as a; f, NKX2-1 Chromosome 14 chromothripsis and BCL11B locus rearrangement: similar representation as a; g, BCL11B::HOXB13 translocation: similar representation as a; h, LINC00592::TLX1 enhancer hijacking by 10Mb intergenic loss. WGS and RNA coverage for the representative cases, normal double positive and CD34+ HSPCs H3K27ac and CTCF coverage is shown, with putative enhancers highlighted in blue. Top: Heatmap showing normal double positive and CD34+ HSPCs H3K27ac HiChIP raw interactions as heatmaps, with topologically associated domains annotated by black dotted triangles. Left: boxplot as in a; i, NFKBIA::NKX2-1 enhancer hijacking: similar representation as a; j, MIR2117HG::LMO2 translocation: Similar representation as a; k, DHX9::TAL1 inversion: Similar representation as a; l, CELF1::LMO2 intergenic loss: Similar representation as a; m, CAPRIN1::LMO2 enhancer hijacking is shown as in h, with additional highlight of CTCF boundary by blue rectangle; n, MIR181A1HG::HOXA13 Translocation: similar representation as a; o, MIR181A1HG::LMO2 translocation: similar representation as a; Abbreviations: diagnostic and germline/remission sample WGS (WGS-D, WGS-G). Nucleosome-free and nucleosome cut fragments (ATAC-free, ATAC-nuc).
Extended Data Figure 4.
Extended Data Figure 4.. Genomic characterization of enhancer and promoter alterations.
a, H3K27ac HiChIP, H3K27ac coverage, cancer (WGS-D) and remission/germline (WGS-G) coverages in T-ALL patient, showing interactions between MYC and the amplified N-me enhancer. Color scale bar showing interaction strength at 5kb resolution. The intensity of each arc represents contacts at 5kb resolution between a pair of loci. Maximum intensity is indicated in the color scale; b, WGS coverage tracks showing recurrent LINC00649 losses in T-ALL patients. H3K27ac HiChIP, H3K27ac and CTCF coverage shown as in a. LINC00649 is a putative regulatory region for RUNX1 in CD34+ cells; c, Illustration of representative cases featuring WGS coverage tracks in FTO/IRX loci, along with two WGS germline control samples. Color scale bar showing interaction strength at 5kb resolution. Boxplots, as defined in Fig.3d legend, showing IRX3 and IRX5 gene expression comparing FTO/IRX loci deletions and wild type (wt) (two-tailed Student t-test, not adjusted for multiple comparisons). Allelic expression denoted by red dots. Top: H3K27ac HiChIP, H3K27ac and CTCF coverage in CD34+ cells, showing interactions between FTO enhancers and IRX3 and IRX5. Arcs represent interactions between genomic loci, with color coding denoting strength of interaction; d, Similar representation as c for ZNF219 loci with annotation of TCRδ loci; e, WGS, H3K27ac HiChIP, H3K27ac and CTCF coverage in CD34+ cells, showing interactions between the HNRNPC promoter and enhancers and ZNF219 loci. Below, WGS and RNA coverage showing copy number loss at ZNF219 loci and revealing RNA coverage match with breakpoint location (red) and reads clip with HNRNPC promoter (not shown); f, Gene expression boxplot by LMO2 variant type with samples with monoallelic expression annotated as red dots; g, WGS, H3K27ac HiChIP, ATAC seq, WTS coverage tracks are shown for T-ALL patient PASPLG with 6bp enhancer deletion (light blue line) and PAWGYX 85bp intronic gain (red line), revealing high levels of H3K27ac marking neoenhancer formation for PASPLG and neomorphic promoter generation for PAWGYX; h, RNA coverage tracks for samples with LMO2 intronic gains (red), intronic SNV/indel (blue) and intergenic SNV/indels (light blue), showing generation of alternative transcript start site for intronic gains and intronic SNV/indel, but not intergenic SNV/indels. Top: junction reads for representative case PARMMV are shown; i, WGS coverage tracks for TAL1 enhancer gains (cyan line) are shown in 9 patient samples and one germline control (PATSIL_G) sample; j, WGS coverage for T-ALL patient and remission/germline samples are shown with four RNA isoform sequencing reads visualized in IGV, capturing the 89 bp gain of the TAL1 enhancer. Orange rectangle: highlight of the increased WGS coverage matching 89 bp gain/insert sequence size. Right: boxplot as in c of TAL1 gene expression comparing TAL1 enhancer gains with TAL1 wt samples with PASXMF sample labeled in cyan.
Extended Data Figure 5.
Extended Data Figure 5.. Enhancer hijacking is associated with differentiation stage.
a, H3K27ac HiChIP, H3K27ac, WGS and ATAC-seq coverages in T-ALL sample PASLPH showing CD1E::TAL1 intergenic inversion. Arcs depict interaction between genomic loci, with colors indicating interaction strength. The intensity of each arc represents contacts at 5kb resolution between a pair of loci. Maximum intensity is indicated in the color scale. Left: boxplot, as defined in Fig.3d legend, of TAL1 gene expression for CD1E::TAL1 and TAL1 wild type (wt) samples, with the PASLPH sample labeled in cyan. Right: heatmap showing H3K27ac HiChIP interactions for normal double positive (DP) and CD34+ HSPCs as heatmaps, with H3K27ac coverage shown below. Lesion breakpoints are shown as black lines; hijacked enhancers color coded; topologically associated domains annotated by black dotted triangles; b, H3K27ac coverage tracks of CD1E::TAL1 enhancer hijacking (marked by cyan line) is shown in different thymic T-cells and in CD34+ cells. Top: heatmap showing H3K27ac HiChIP raw interactions for normal double positive and CD34+ HSPCs; c, same as b for RAG2::LMO2 enhancer hijacking; d, same as b for SOX4/CASC15::HOXA13 enhancer hijacking; e, same as b for MIR181A1::HOXA13 enhancer hijacking; f, Expression of enhancer hijacking-driven leukemia gene expression signatures in normal BM/thymic scRNA data: Dot plots depict mean gene set score of each gene expression signature by normal cell type (color) and mean gene set detection percentage (dot size). Left: subtype annotation for each alteration. Top: RAG1, RAG2 gene expression is shown, with mean expression (dot color) and detection percentage (dot size). Right: RAG1/RAG2 gene expression log2 fold change (FC) of for each alteration (altered vs. wild type) is shown as a heatmap. Right to the heatmap, horizontal bar plots show the percentage of each enhancer hijacking structural variant (SV) event predicted to be RAG mediated. Bonferroni adjusted −log10 P value is shown (one-tailed Fisher’s exact test, comparing RAG mediated breakpoints compared to non-RAG mediated breakpoints for each lesion category).
Extended Data Figure 6.
Extended Data Figure 6.. Intragenic and intergenic non-coding alterations.
a, NOTCH1 amino acid position, mRNA bp position, exon number, and previously described protein domains are shown. Heterodimerization domain (HD) and transmembrane (TM), TM-connector domains are color coded and locations of the proteolytic cleavage sites (S2 and S3) that lead to intracellular domain release from the membrane are shown as black lines. Below, exons 27-28 are shown, with NOTCH1 intronic SNV location marked by a red line, with mutation position and types (forward strand C-A or C-G), resulting 3’ splice site sequences (TAG and CAG mutated splice site, GAG wild type (wt)) are shown. The mutated splice site results in 129 bp or 43 amino acid insertion (green rectangle) at exon 28 and the insert sequence is shown below; b, NOTCH1 intergenic SNV validation by RT-PCR. Two patient samples, SJTALL031662 and SJTALL031904, have longer 538bp transcript due to the intronic SNV, compared to NOTCH1 wt 409bp transcript for PEER and LOUCY cell lines, primers at Exon 26 (9:136504848-9:136504827), Exon 28 (9:136502426-9:136502405). This experiment was not repeated, but variant was confirmed using Sanger sequencing; c, NOTCH1 exon 28 33 bp duplication sites are shown using cancer patient sample (D) and matched germline/remission sample (G) WGS and LR isoform sequencing. Duplicated site sequence match with increased DNA coverage, highlighted in blue; d, NOTCH1 locus showing WGS coverage tracks and intragenic deletions between exon 16-27 and 3-27 in 11 representative cases and matched non-tumor sample controls; e, NOTCH1 splicing plots for T-ALL patients with exon 16-27 and 3-27 deletions, compared to wt control, are visualized. Atypical splicing reads are highlighted in red; f, Top: Coverage tracks for IL7R diagnostic and matched non-tumor WGS and WTS coverage, along with SNPs. Below: Isoform sequencing reads, indicating the loss of one allele due to TSS loss. Right: IL7R and PRLR loci deletion is shown for representative cases, accompanied by IL7R and PRLR gene expression and P value (two-tailed, Student t-test); g, Similar representation as f for CCND3: showing the loss of the long isoform (red) of CCND3 and TAF8 allele, while both alleles of short isoforms (blue) are expressed; WGS-D, whole genome sequencing of diagnosis sample, WGS-G, matched non-tumor sample. Nucleosome-free (ATAC-free) and nucleosome cut fragments (ATAC-nuc).
Extended Data Figure 7.
Extended Data Figure 7.. Effect of CCND3/TAF8 TSS deletion and SNV/indels on protein structure.
a, the distribution of detected isoforms, showing that ENST00000372991 (short isoform of CCND3) is predominantly expressed; b, boxplots, as defined in Fig.3d legend, depict the gene expression comparisons of CCND3, TAF8, short isoform (ENST00000372991), and long isoforms (ENST00000372988, ENST00000415497), with P value (two-tailed Student t-test) shown for comparison between CCND3/TAF8 TSS loss (N=27) and CCND3 wild type (wt, N=1193). Additional control groups were samples with CCND3 SNV/indel (N=79), and CCND3 wt TAL1 DP-like (N=253), and TAL1 αβ-like (N=206) subtypes (these subtypes are enriched for CCND3/TAF8 TSS loss). CCND3/TAF8 TSS loss is associated with decreased long isoform expression while total CCND3 expression remains constant due to high short isoform expression; c, Exon composition, CDD/PFAM protein domains, and amino acid residue positions of CCND3 SNV/indel for different isoforms; d, AlphaFold2 model of the long (blue) and short (yellow) isoforms of CCND3 superimposed onto the crystal structure of the CDK4/CCND3 (PDB code 3G-33); e, Detailed views of the contacts between α1 and α2 of CCND3 showing that the long isoform of CCND3 lacks the first two α-helices of the short isoform protein and α1 and α2 engage in essential hydrophobic contacts within the core of CCND3. FoldX predicted that the long isoform of CCDN3’s protein is unstable, with an estimated destabilization of 100 kcal/mol, likely leading to an unfolded protein; f, SNV/indel at the C-terminus of CCND3 is unlikely to affect the interaction with CDK4. Mutations at the C-terminus may affect CCND3 stability by interfering with CCND3 protein homeostasis; there is a conserved TPTDV motif at the C-terminus of CCND3 that recruits the E3 ligase AMBRA1. The TPTDV is maintained in both the K268R and 264_274del mutants, but not in the R217fs variant.
Extended Data Figure 8.
Extended Data Figure 8.. Subtyping and genomic analysis of TLX3 and NKX2-1 subgroups.
a, Oncoprint showing alterations that are significantly different in frequency between TLX3 DP-like and Immature subgroups. Left: −Log10 FDR (two-tailed Fisher’s exact test); TCR and ETP status are shown above lesions; b, UMAP plots representing TLX3 DP-like and Immature subgroups; c, UMAP plot displaying TCR rearrangement status for TLX3 cases; d, UMAP plot illustrating ETP status for TLX3 cases; e, Oncoprint of NUP214::ABL1 fusion and JAK/STAT or RAS pathway genes. Gene expression of differentially expressed (FDR<0.01) surface markers and kinase genes are shown above; f, Dot plot depicting significantly altered genes, broad CNVs, and pathways associated with TLX3 DP-like and Immature subgroups. Dot color represents odds ratio, and dot size reflects −log10 FDR values. Odds ratio values are values are truncated at a maximum of 10. Genes are ordered by significance within each subtype; g, UMAP plots showing selected gene and lesion alterations (green) for TLX3 samples; h, Dot plot visualizing expression of TLX3 DP-like and Immature gene expression signatures in normal BM/thymic single cell RNA data. Detection percentage is represented by dot size, while mean signature enrichment by normal cell type is indicated by color. The TLX3 subgroup is further divided based on ETP status and TCR rearrangement status; i, Similar to a, showing significantly different lesions between NKX2-1 TCR and Other subgroups; j, UMAP plot illustrating labels for NKX2-1 TCR and Other subgroups; k, WGS coverage tracks in chromosome 14 showing chromothripsis and annotation for the NKX2-1 locus; l, similar as g, Dot plot depicting significantly altered co-lesion genes, broad CNVs, and pathways associated with NKX2-1 TCR and Other subgroups; m, UMAP plots displaying selected gene and lesion alterations (green) for NKX2-1 samples.
Extended Data Figure 9.
Extended Data Figure 9.. Subtyping and genomic analysis of TAL1/LMO2 genomic subgroups.
a, Oncoprint representing driver alteration prevalence between TAL1 DP-like and αβ-like subtypes. Left: −log10 FDR significance levels are shown (Two-tailed Fisher’s exact test); b, Oncoprint of co-lesion prevalence as in a; c, Heatmap showing mutually exclusive and co-occurring lesions within the TAL1 DP-like and αβ-like subtypes. Color represents log2 odds ratio. Significant pairs are indicated by stars (one-sided Fisher’s exact test, *** = FDR<0.001, ** = FDR<0.01, * = FDR<0.05); d, UMAP plots representing the alterations associated with the TAL1 groups; e, Oncoprint of genetic subgroup-associated alterations categorized by genes, lesions, and pathways. The subdivisions are based on subtypes and further divided by genetic subgroup. Oncogene gene expression and expression of MYC, MYB and MYCN are represented as Z scores; f, UMAP plots illustrating the distribution of TAL1 genetic subgroups and LMO2 γδ-like and STAG2/LMO2 subgroups. TCR rearrangement status and ETP status are indicated on the right; g, Volcano plot depicting differential flow cytometry markers between TAL1 αβ-like and DP-like subtypes (TAL1 αβ-like upregulated markers log2 fold change positive and downregulated negative); Significantly altered markers (two-tailed Wilcoxon rank-sum test) are labeled by protein name, with P value (0.1) and log2 fold change cutoffs (0.25) are shown as black dotted lines; h, As in g, volcano plot comparing LMO2 γδ-like samples to the rest of the samples, showing differential flow cytometry markers. i, As in g, Volcano plot showing differential flow cytometry markers between LMO2 γδ-like and TAL1 αβ-like subtypes; j, Similar to g, volcano plot comparing flow cytometry markers between LMO2 γδ-like and TAL1 DP-like subtypes; k, Similar to g, differential flow cytometry markers in STAG2/LMO2 group; l, Similar to g, differential flow cytometry markers between STAG2/LMO2 and TAL1 DP-like subtypes.
Extended Data Figure 10:
Extended Data Figure 10:. ETP/ETP-like genomics, immunophenotype and clinical associations.
a, UMAP plot revealing distinct MLLT10 and KMT2A fusion partners; b, Dot plot showing significant gene, CNV (gain/amplification/loss/deletion), and pathway alterations linked with ETP-like genetic subtypes, with dot color indicating odds ratio and dot size reflecting −log10 FDR. Odds ratio values are truncated at a maximum of 10, with genes/lesions ordered by significance within each subtype; c, Location of MED12 SNV/indel amino acid position in T-ALL; d, Western blot of MED12 in knockout in PER117 and LOUCY cell line. These uncropped images were obtained from LI-COR odyssey by defining the area to be scanned. Assay was repeated three times with consistent results; e, Dot plot displaying GSEA enrichment result for significant pathways in MED12KO vs. wild type (wt) and ETP-like MED12 subgroup, where dot size is −log10 FDR and dot color is Normalized Enrichment Score (NES); f, Volcano plot illustrating significantly differentially expressed genes (two-tailed Wald test) between LOUCY MED12 knockout (KO) and wt samples (LOUCY MED12 KO upregulated markers log2 fold change positive and downregulated negative). The analysis is restricted to genes that exhibited differential expression in ETP-like MED12 subgroup; g, Dot plot visualizing the gene set detection percentage (dot size) and mean gene set enrichment by normal cell type (color) for MED12 knockout and MED12 subtype upregulated (N=60) and downregulated (N=104) genes in normal BM/thymic scRNA data. Below is a dot plot of select significantly differentially expressed genes (as in Fig. 4b) in normal cell scRNA, depicting mean expression (dot color) and detection percentage (dot size); h, Heatmap of HOXA gene expression, samples ordered by distance to HOXA9 TSS, and driver/alteration type annotations on top; i, Oncoprint of ETP-like group altered drivers and pathways, divided by ETP status, with day 29 MRD bar plot, clinical characteristics, morphological response, relapse, and TCR rearrangement status annotations. FDR between ETP categories and genomics indicated on the left; j, Volcano plot depicting differential expression of cell surface markers detected by flow cytometry between ETP-like cases without TCR rearrangement (no TCR-R) versus those with TCR γδ rearrangement (ETP-like TCRγδ) upregulated markers log2 fold change positive and downregulated negative, with P value (0.1) and log2 fold change (0.25) cutoffs shown as black dotted lines), with significantly altered (from two-tailed Wilcoxon rank-sum test) markers labeled by protein names; k, Similar to j, this plot compares flow cytometry markers between ETP-like MLLT10 cases and other MLLT10 cases.
Extended Data Figure 11.
Extended Data Figure 11.. T-ALL genomic risk factors and clinical outcomes considering MRD, DFS and OS.
a, Proportions of induction failure and residual disease cases by genetic subgroup; b, Oncoprint of variants significantly associated with MRD. Day 29 MRD displayed as a bar plot on top with other clinical annotations. Genomic data was divided to residual disease (day 29 MRD≥0.01%), and negative groups (day 29 MRD<0.01%). Left: number of present (N) vs. absent lesions, −log10 q value from Firth penalized logistic regression, log odds ratios (OR) and then forest plot with center box presenting log OR and error bars indicating 95% confidence intervals (CI); c, Forest plot showing hazard ratios (HR) and 95% CI comparing cases with subtype or genetic subtype present (N) vs. absent, considering DFS and OS as outcomes. Significant associations (two-tailed, Firth-penalized Cox models that also adjusted for MRD (MRD.adj), P<0.1) are highlighted in red. These P values were not adjusted for multiple comparisons.
Extended Data Figure 12.
Extended Data Figure 12.. Genomic risk factors and cumulative incidence of relapse in T-ALL.
a, Left: number of present vs. absent (N) lesions, −log10 P value, hazard ratios (HR). Right: forest plot with center box presenting HR and error bars indicating 95% confidence intervals (CI) for variants that were present vs. absent considering EFS, DFS, and OS as outcomes. Significant associations (two-tailed, Firth-penalized Cox models that also adjusted for MRD, P<0.1) are highlighted in red. These P values were not adjusted for multiple comparisons; b, The Kaplan-Meier curve of NOTCH pathway mutated vs. not mutated cases, stratified by MRD percentage (%), with P value from two-tailed Log-rank test; c, Cumulative incidence of relapse plot, revealing distinct risk between PI3K (NOTCH wild type (wt)) and NOTCH (PI3K wt) pathway alterations, with P value from two-tailed Holm-adjusted Gray’s test; d, as in c, Comparison of PTEN deletions to other PTEN alterations in terms of cumulative relapse incidence; e, as in c Comparison of NOTCH1 intragenic loss to other NOTCH1 alterations regarding cumulative relapse incidence; f, as in c, Comparison of TCR:: MYC alterations to other MYC alterations in relation to cumulative relapse incidence; g, as in c, Comparison of LMO2 intergenic loss to other LMO2 alterations with respect to cumulative relapse incidence; h, as in c, Comparison of TAL1 upstream enhancer Indel to other TAL1 alterations in terms of cumulative relapse incidence; i, Comparison of TAL1 genetic subtypes in relation to cumulative relapse incidence with P value from two-sided global Gray’s test; j, Contingency table comparing TAL1 upstream enhancer Indel and LMO1 TCR to induction failure, demonstrating no association (P=0.91 and P=0.92, one-tailed Fisher’s exact test); k, Scatter plot of variant allele frequency (VAF) of all alterations in TALL0223 case, with T-ALL shown on the y axis and Langerhans cell histiocytosis (LCH) in the x axis with annotations for T-ALL driver mutations and clusters denoting three distinct clones; l, analysis of differentially expressed genes (two-tailed Wald test) between the T-ALL SPI1 subtype (N=11) and the TALL023 Langerhans cell histiocytosis (LCH) case (N=1) reveals the downregulation of T-cell genes and the upregulation of the LCH marker CD207; m, A heatmap showcases select SPI1 subtype markers (HLA-D, CD7, CD5, CD1A, CD3E, CD2, PTPRC/CD38), LCH markers (CD207), dendritic cell progenitor marker (IRF8), T-cell markers (ZAP70, LCK, GATA3, RAG1, CD4, CD8A, TRDC, TRGC1, TRBC1, TRAC), and myeloid markers (CD33, CD14) for the SPI1 subtype and the TALL023 T-ALL and LCH cases. Right: same markers are shown in a normal cell scRNA, showing mean expression (dot color) and detection percentage (dot size).
Extended Data Figure 13.
Extended Data Figure 13.. Multivariable outcome model evaluation.
a, The mean validation concordance and associated 95% confidence intervals (CI) are shown, derived from 100 random splits (70% training, N=915, 30% validation, N=394) of the data for three distinct survival models. These models were fitted using different data types, with binary Day 29 MRD (≥0.1%) employed as the baseline, shown as red line. The baseline concordance results are denoted by grey rectangles, where binary MRD, numeric MRD, and a combination of clinical features (MRD, sex, WBC, CNS) and NOTCH1/FBXW7/RAS/PTEN classifier are shown. The blue rectangle represents models fitted using single data types, including numeric MRD, Sex, WBC, and CNS as predictors. The pink rectangles denote combinations of genomic and clinical features. Model coefficient numbers are shown on top of the figure as bar plots for penalized Cox regression and survival Trees. Model concordance is shown on top of the best performing model for each algorithm and highest concordance annotated as blue line. Select subtype denotes data where the main subtype is further divided into genetic subtypes when available; b, The stacked bar plot portrays a four-node survival tree that was generated from 1000 bootstrap resamples. The proportion of bootstrap samples in which each subtype was classified into various risk groups is shown; c, The Kaplan-Meier curve illustrates the risk score (divided into four quartiles) derived from a penalized Cox regression multivariable model, limited to ETP cases, showing models ability to risk-stratify patients within ETP group. Log-rank test P value is shown; d, Same as c, for Near-ETP cases; e, Same as c, for ETP and Near-ETP cases; f, Same as c, for Non-ETP cases; g, The Kaplan-Meier curve dividing ETP-like group by ETP status, revealing no difference in outcomes; h, Same as c, for ETP-like subtype ETP cases; i, Same as c, for ETP-like subtype ETP and Near-ETP cases; j, Same as c, for ETP-like subtype Non-ETP cases; k, Dot plot illustrating altered pathways and pathway genes significantly associated with subtypes, displaying odds ratio as dot color and −log10 FDR as dot size. Odds ratio and −log10 FDR were truncated at maximum of 20.
Figure 1.
Figure 1.. Classifying drivers and gene expression define 15 T-ALL subtypes.
a, UMAP scatterplot depicting T-ALL subtypes and ETP status: Each subtype indicated by color and immunophenotype by shape; b, Bar plot illustrating percentages of classifying driver alterations and proportion of coding/intergenic alteration per driver with “Unknown” cases Shown in blue; “Rare” category includes all drivers with <0.8% frequency; c, Bar plot of driver alteration type percentages: differentiating coding and non-coding/intergenic alterations; d, Gene set score of subtype gene expression signatures in normal BM/thymic scRNA data: the dot plot depict signature detection percentage (dot size) and mean gene set score by normal cell type (color).
Figure 2:
Figure 2:. Oncoprint of classifying drivers.
Drivers are grouped by subtype and ordered by mutual exclusivity, with dark red row labels denoting non-coding drivers. Above the oncoprint, oncogene and differentiation markers gene expression Z-scores, TCR rearrangements and ETP status are shown.
Figure 3:
Figure 3:. Diverse mechanisms of oncogene and enhancer driver alterations in T-ALL.
a, Bar plot of non-coding inter-/intragenic alterations. Right: recurrently targeted genes (frequency in brackets, >0.5% shown) with monoallelic expression −log10 q value (one-tailed Fisher’s exact test); b, TAL1 enhancer alterations, CD34+ HSPC and DP T-cell H3K27ac and CTCF coverage; c, Diagnostic (D) and germline (G) WGS, H3K27ac, Nucleosome-free and ATAC-seq nucleosome cut fragments (ATAC-free, ATAC-nuc) coverage for the sample exhibiting TAL1 enhancer gain; d, H3K27ac HiChIP, WGS and ATAC-seq in PAVHBC with RAG2::LMO2 intergenic loss. Arcs represent interaction strength at 5kb resolution. Left: Boxplot of LMO2 expression and P value for altered and wild type (wt) samples (two-tailed Student t-test), PAVHBC in cyan. The box includes the median, hinges mark the 25th and 75th percentiles, and whiskers extend 1.5 times the interquartile range; Right: heatmaps showing double positive (DP) and CD34+ HSPCs H3K27ac HiChIP interactions with color scale bar showing interaction strength at 5kb resolution, with H3K27ac coverage below. Lesion breakpoints are shown as black lines; hijacked enhancers color coded. The intensity of each arc/heatmap represents contacts at 5kb resolution between a pair of loci. Maximum intensity is indicated in the color scale; e, Same as d for SOX4::HOXA13 enhancer hijacking, by chr7-chr6 and chr7-chr17 translocations; f, Splice junction reads and coverage for NOTCH1 exon 28-29 intronic SNV are shown for mutated patient sample (red) and wt controls; g, AlphaFold2 models showing the structural difference between the wt (grey) and NOTCH1 intronic SNV mutant (blue). The mutation results in a 43-residue insertion (magenta), as compared to wt connector (green), between the heterodimerization (HD) and the transmembrane (TM) domains; h, Relative luciferase activity for NOTCH1 intronic SNV, HD/PEST domain mutations and controls are shown (N=3 each), with black line denoting the median and two-tailed Student t-test P values shown on top. Assay was repeated three times with consistent results.
Figure 4:
Figure 4:. Genomic classification of ETP/ETP-like ALL.
a, UMAP plot displaying the distribution of ETP-like genetic subgroups along with HOXA9, MLLT10, and KMT2A groups, separated from the ETP-like subtype by the dotted curved line. Right: HOXA9 and HOXA13 gene expression Z-scores, with dotted curved lines separating the samples with high HOXA9 or HOXA13 expression; b, Heatmap of select differentially expressed genes between MED12wt and MED12KO LOUCY cells, with FDR shown on the left; c, H3K27ac HiChIP raw interactions and H3K27ac and CTCF coverage in normal CD34+ HSPCs showing different TADs for HOXA9 and HOXA13 with CTCF boundaries marked in yellow and topologically associated domains annotated by black dotted triangles; d, UMAP plot depicting the distribution of ETP status and TCR rearrangement status among the ETP-like samples; e, Dot plot visualizing the gene set detection percentage (dot size) and mean gene set enrichment by normal cell type (color) for ETP-like genetic subtype and MLLT10, KMT2A, HOXA9 subtypes in BM/thymic scRNA data. Signatures were generated by dividing ETP-like by ETP status, TCR rearrangement status, or genetic subtypes; f, Heatmap displaying the expression of immunophenotypic cell surface markers as positive cell percentages for ETP-like cases, and KMT2A, MLLT10, and HOXA9 subtypes. ETP status and TCR rearrangement status are indicated on top of the heatmap; g, Volcano plot representing differential flow cytometry markers between ETP-like cases compared to the rest of the samples (ETP-like upregulated markers log2 fold change positive and downregulated negative). Significantly altered markers (from two-tailed Wilcoxon rank-sum test) are labeled with their respective protein names and log2 fold change (0.25) and P value cutoffs (0.1) are denoted by dotted lines; h, Similar to g, differential markers between Non-ETP vs ETP cases within ETP-like subtype are shown; i, Similar to g, differential markers between ETP-like Non-ETP cases compared to all other Non-ETP cases.
Figure 5:
Figure 5:. T-ALL genomic risk factors and clinical outcomes.
a, Residual disease category proportions per subtype; b, Forest plot displaying hazard ratios as box (HR) and error bars indicate 95% confidence intervals (CI) comparing cases with subtype or genetic subtype present (N) vs. absent, considering EFS and MRD as outcomes. Significant associations are highlighted in red for EFS (P<0.1, two-tailed, Firth-penalized Cox regression that also adjusted for MRD (MRD.adj)) and for MRD (P<0.1, two-tailed, Firth-penalized logistic regression). P values were not adjusted for multiple comparisons; c, Similar to b, Forest plot of select variants significantly associated with outcomes (EFS, DFS, OS, two-tailed Firth-penalized Cox regression); d, Cumulative incidence plot of SPI1 fusions and second cancer, with contingency table and malignant type shown below and P value from two-tailed Gray’s Test; e, Clonal evolution of T-ALL to Langerhans cell histiocytosis (LCH) for case TALL023, with T-ALL driver alterations shown for each clone; f, Volcano plot depicting differential flow cytometry markers between SPI1 subtype cases and other samples, with significantly altered markers (from two-tailed Wilcoxon rank-sum test) labeled by protein names (SPI1 upregulated markers log2 fold change positive and downregulated negative, and log2 fold change (0.25) and P value (0.1) cutoffs are denoted by dotted lines); g, Dot plot showing immunophenotype markers from f in bone marrow and thymic dendritic cells.
Figure 6.
Figure 6.. Multivariable outcome models.
a, The Kaplan-Meier plots illustrate the risk score (divided into quartiles) derived from a penalized Cox regression multivariable model fitted using features from b; b, The oncoprint displays the genomic or clinical features selected by the penalized Cox regression model (N=1299, excluding samples with missing data). Genomic data are stratified according to risk score quartiles, while day 29 MRD (percentage of leukemic cells after induction) is shown as bar plots. Binary genomic features are categorized by data type, with corresponding model coefficients presented on the left ordered by association (>0 adverse, <0 favorable). EFS events are depicted at the bottom of the figure to illustrate the association between risk score quantiles and EFS events; c, This illustration depicts the fitted survival tree (N=1287, excluding samples with missing data), initially categorized into four groups based on subtype or genetic subtype (superscript), and subsequently subdivided according to day 29 MRD (≥0.1% for MRD positive, <0.1% negative). Bottom: Kaplan-Meier curves show the survival relationship within each of these divisions.

References

    1. Summers RJ & Teachey DT SOHO State of the Art Updates and Next Questions | Novel Approaches to Pediatric T-cell ALL and T-Lymphoblastic Lymphoma. Clin Lymphoma Myeloma Leuk 22, 718–725 (2022). - PMC - PubMed
    1. Mansour MR et al. Oncogene regulation. An oncogenic super-enhancer formed through somatic mutation of a noncoding intergenic element. Science 346, 1373–1377 (2014). - PMC - PubMed
    1. Liu Y et al. The genomic landscape of pediatric and young adult T-lineage acute lymphoblastic leukemia. Nat Genet 49, 1211–1218 (2017). - PMC - PubMed
    1. Roberts KG et al. Targetable kinase-activating lesions in Ph-like acute lymphoblastic leukemia. N Engl J Med 371, 1005–1015 (2014). - PMC - PubMed
    1. Brady SW et al. The genomic landscape of pediatric acute lymphoblastic leukemia. Nat Genet 54, 1376–1389 (2022). - PMC - PubMed