. 2024 Oct;43(19):4324-4355.
doi: 10.1038/s44318-024-00194-2. Epub 2024 Aug 14.

Spatial control of the APC/C ensures the rapid degradation of cyclin B1

Affiliations

Spatial control of the APC/C ensures the rapid degradation of cyclin B1

Luca Cirillo et al. EMBO J. 2024 Oct.

Abstract

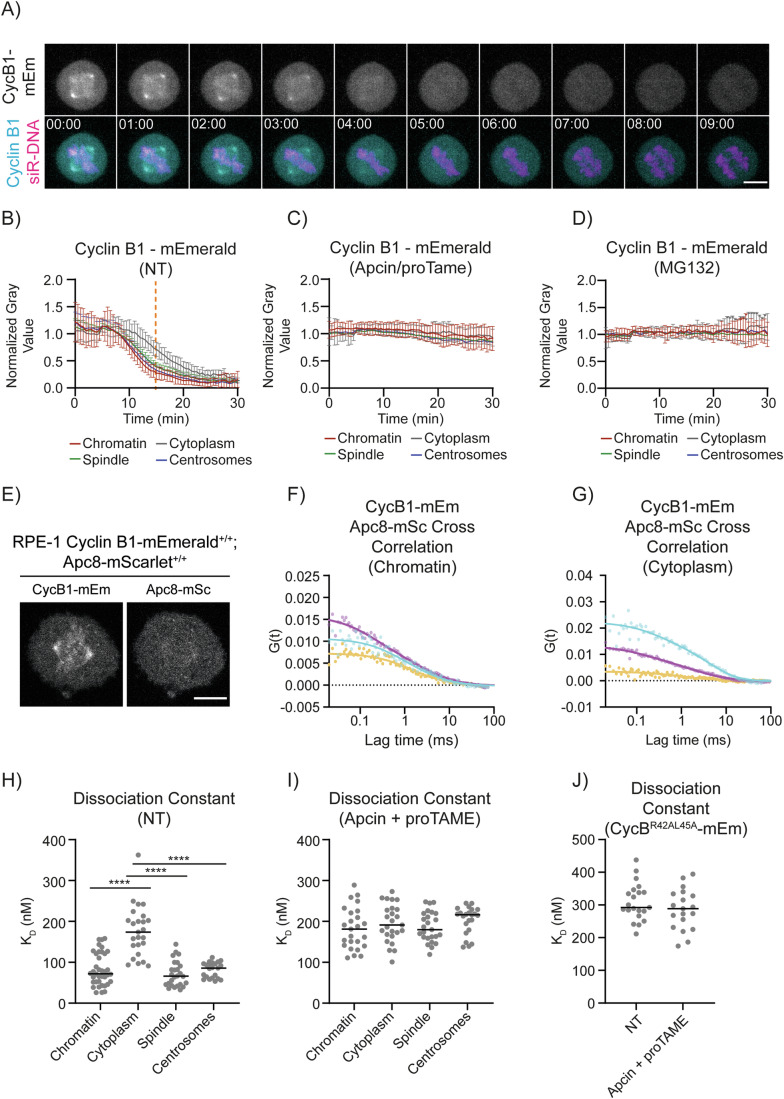
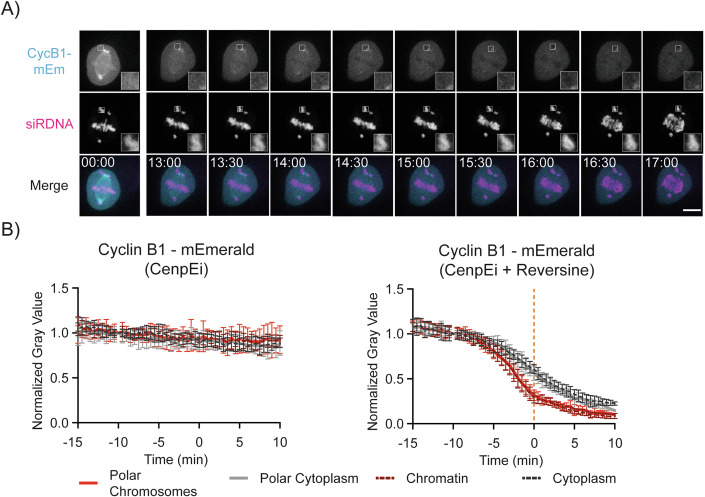
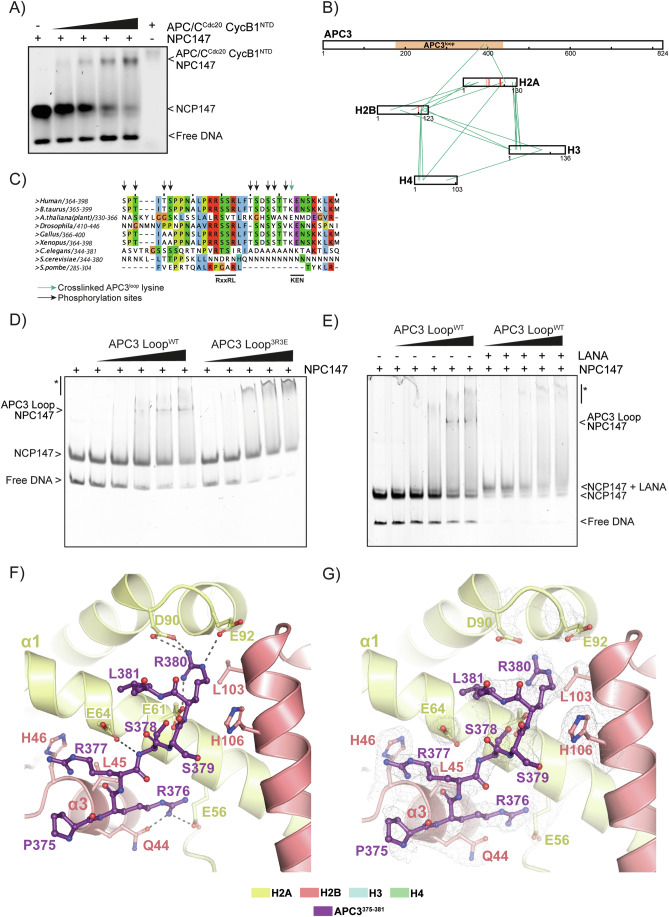
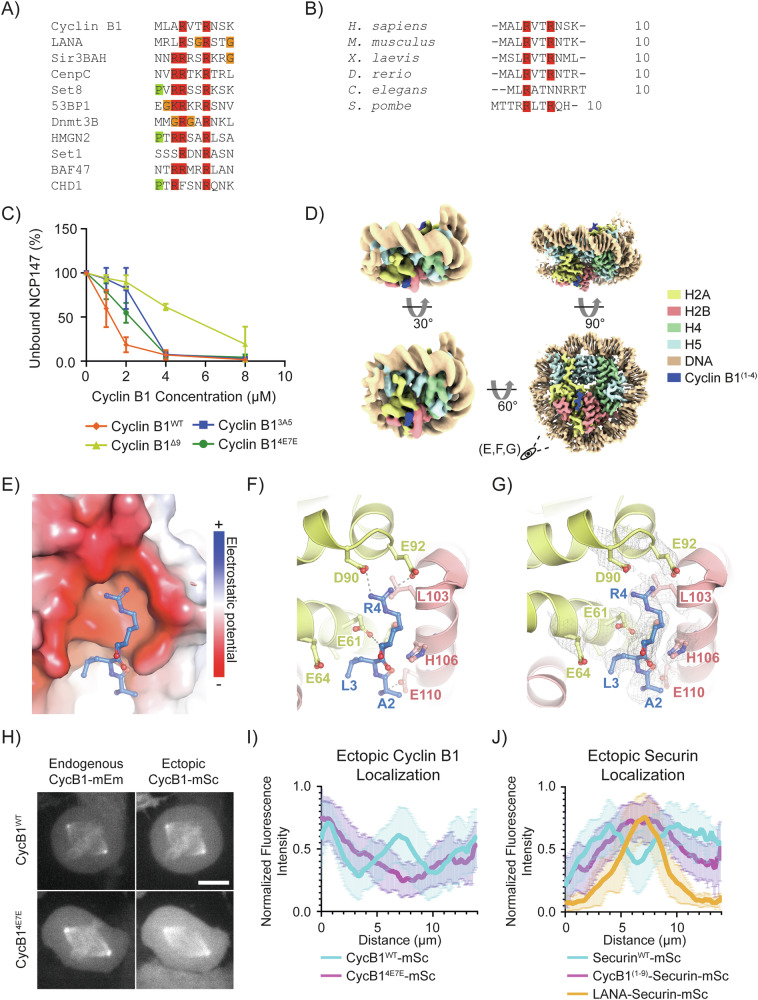
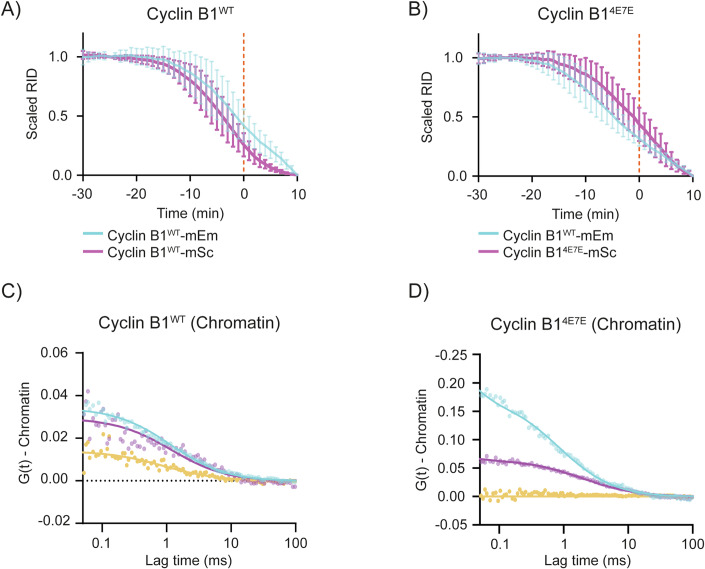
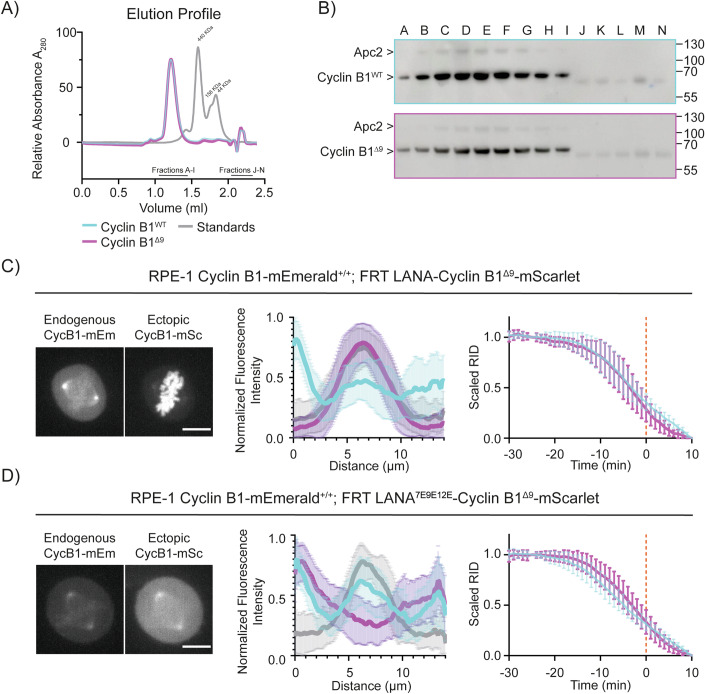
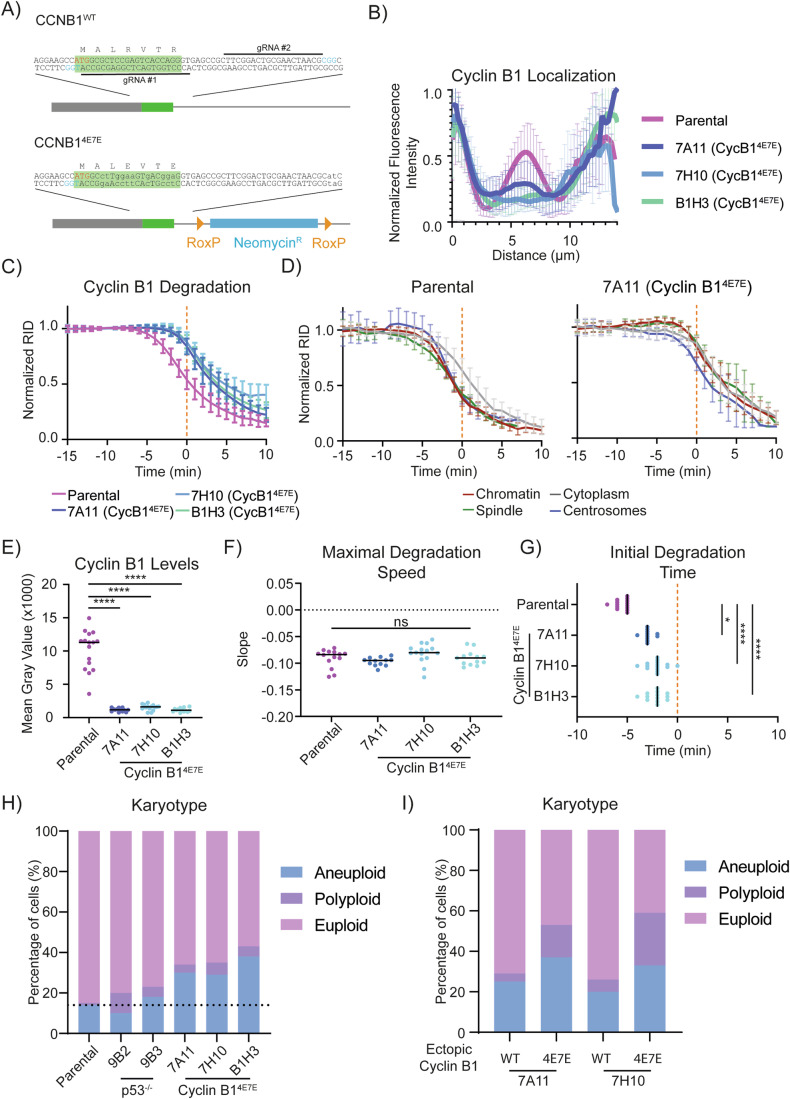
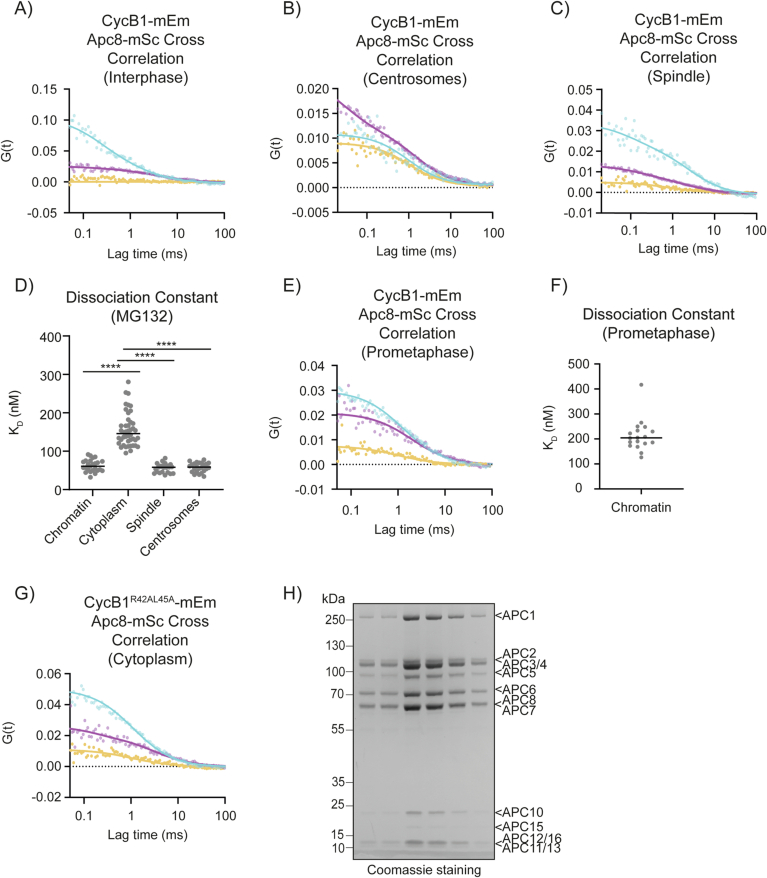
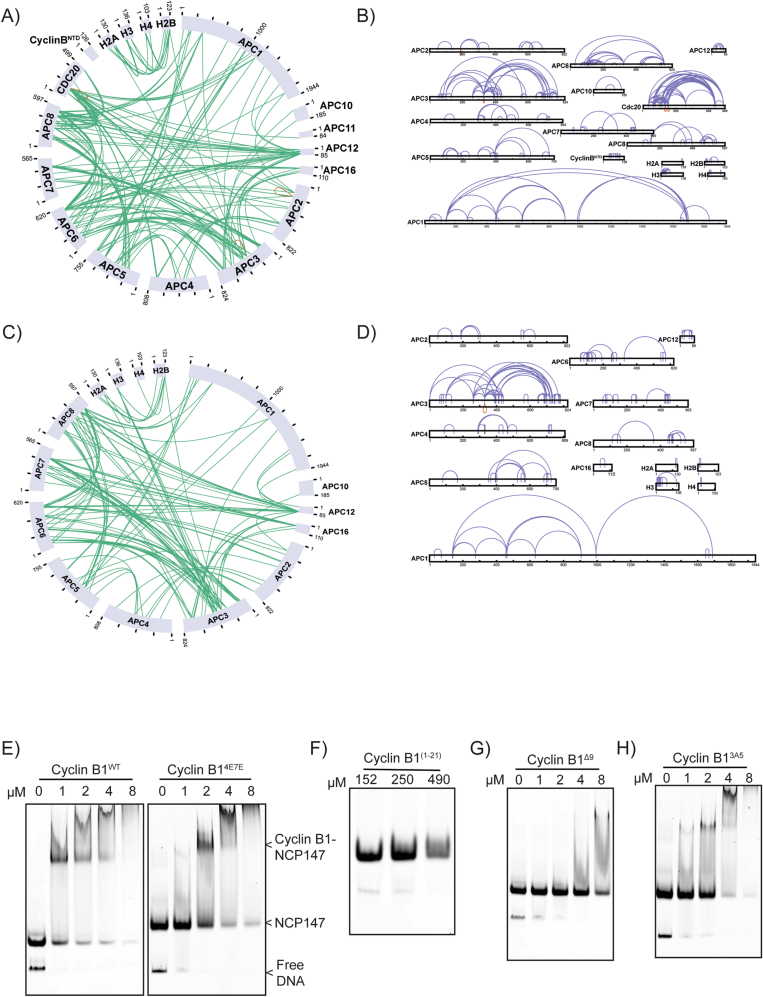
The proper control of mitosis depends on the ubiquitin-mediated degradation of the right mitotic regulator at the right time. This is effected by the Anaphase Promoting Complex/Cyclosome (APC/C) ubiquitin ligase that is regulated by the Spindle Assembly Checkpoint (SAC). The SAC prevents the APC/C from recognising Cyclin B1, the essential anaphase and cytokinesis inhibitor, until all chromosomes are attached to the spindle. Once chromosomes are attached, Cyclin B1 is rapidly degraded to enable chromosome segregation and cytokinesis. We have a good understanding of how the SAC inhibits the APC/C, but relatively little is known about how the APC/C recognises Cyclin B1 as soon as the SAC is turned off. Here, by combining live-cell imaging, in vitro reconstitution biochemistry, and structural analysis by cryo-electron microscopy, we provide evidence that the rapid recognition of Cyclin B1 in metaphase requires spatial regulation of the APC/C. Using fluorescence cross-correlation spectroscopy, we find that Cyclin B1 and the APC/C primarily interact at the mitotic apparatus. We show that this is because Cyclin B1, like the APC/C, binds to nucleosomes, and identify an 'arginine-anchor' in the N-terminus as necessary and sufficient for binding to the nucleosome. Mutating the arginine anchor on Cyclin B1 reduces its interaction with the APC/C and delays its degradation: cells with the mutant, non-nucleosome-binding Cyclin B1 become aneuploid, demonstrating the physiological relevance of our findings. Together, our data demonstrate that mitotic chromosomes promote the efficient interaction between Cyclin B1 and the APC/C to ensure the timely degradation of Cyclin B1 and genomic stability.

Keywords: Cell Cycle; Chromosome; Mitosis; Nucleosome; Ubiquitin.


Conflict of interest statement

The authors declare no competing interests.

Figures

Figure 1
Figure 1. Cyclin B1 degradation is spatially regulated.
(A) Representative maximum projections of fluorescence confocal images over time of an RPE-1 Cyclin B1-mEmerald+/+ cell progressing through mitosis. Time is expressed as mm:ss. The scale bar corresponds to 10 μm. (BD) Quantification of Cyclin B1 fluorescence levels (normalised raw integrated density, RID) over time in RPE-1 Cyclin B1-mEmerald+/+ cells: n ≥ 18 cells per condition, N = 3 independent experiments. Mean ± standard deviation are plotted. (E) Representative fluorescence confocal images of RPE-1 Cyclin B1-mEmerald+/+; APC8-mScarlet+/+ cells. The scale bar corresponds to 10 μm. (F, G) Representative graph of the autocorrelation of Cyclin B1-mEmerald and APC8-mScarlet and the cross-correlation between the two at the chromatin (F) and in the cytoplasm (G). In this and all following FCCS graphs, dots = data, lines = fit; Cyan = Cyclin B1-mEmerald, magenta = APC8-mScarlet, yellow = cross-correlation between cyclin B1-mEmerald and APC8-mScarlet. (HJ) Dot plots representing the KD between endogenous Cyclin B1-mEmerald and APC8-mScarlet in the indicated conditions: n ≥ 21 cells per condition, N = 3 independent experiments. In this and all following KD dot plots, each dot corresponds to a single measurement, horizontal black lines represent median values. In this and all following figures, the orange dotted line indicates anaphase (panel B), the dotted horizontal line indicates 0 (panels F, G), CycB1 Cyclin B1, mEm mEmerald, mSc mScarlet, see Appendix Table S2 for statistical tests and p values. ns not significant, p > 0.05; ∗p < 0.05, ∗∗p < 0.01, ∗∗∗p < 0.001, ∗∗∗∗p < 0.0001 for all figures. Source data are available online for this figure.
Figure 2
Figure 2. Chromatin is a major site for Cyclin B1 disappearance in RPE-1 cells.
(A) Representative fluorescence confocal images over time of an RPE-1 Cyclin B1-mEmerald+/+ cell progressing through mitosis after treatment with CenpEi and Reversine. Time is expressed as mm:ss. The scale bar corresponds to 10 μm. (B) Quantification of normalised Cyclin B1 fluorescence levels over time in RPE-1 Cyclin B1-mEmerald+/+ cells after treatment with CenpEi inhibitor (left) or a combination of CenpEi and Reversine (Right): n = 11 cells per condition, N = 3 independent experiments. Mean ± standard deviation are plotted. Source data are available online for this figure.
Figure 3
Figure 3. The APC3 loop of APC/C binds the nucleosome acidic patch.
(A) EMSA of the APC/C-CDC20-Cyclin B1NTD and NCP147. N = 3 independent experiments. (B) Representation of the heteromeric crosslinks found between the APC3 loop and the acidic patch of the NCP. (C) A sequence alignment of the C-terminus of the human APC3 loop with homologous sequences in other species. APC3 K390, which crosslinks with the acidic patch, is marked with a green arrow. Previously identified phosphorylation sites are marked with black arrows. (D) EMSA of the APC3 loop WT and charge-substitution 3R3E mutant with the NCP147. N = 3 independent experiments. Bands corresponding to free nucleosome and to the APC3:nucleosome complex are marked. Non-specific binding events are indicated with an asterisk. (E) EMSA of the APC3 loop WT including LANA peptide. N = 3 independent experiments. (F) A close-up view of the APC3 loop RRSSR motif bound to the acidic patch of the NCP. The APC3 loop is shown as balls and sticks in dark purple, residues 375–381 can be seen. H2A and H2B are shown in the cartoon representation. Dashed lines indicate hydrogen bonds between the APC3 loop and the acidic patch and surrounding residues. R380 establishes hydrogen bonds with E61, D90, and E92 of the acidic patch, and R376 with E56. (G) Cryo-EM density of the APC3 loop and surrounding H2A/H2B residues. Source data are available online for this figure.
Figure 4
Figure 4. Cyclin B1 N-terminus mediates nucleosome binding.
(A) Protein alignment of the N-terminus of human Cyclin B1 with known arginine anchors of other nucleosome interacting proteins. (B) Protein alignment of the N-terminus of Cyclin B1 orthologues. (C) Quantification of EMSAs of full-length Cyclin B1WT and the indicated Cyclin B1 variants. N = 3 independent experiments. Mean ± standard deviation are plotted. (D) Cryo-EM structure of the NCP in complex with Cyclin B N-terminus (NCPCbNT). On the left, the cryo-EM density is low-pass filtered to 7 Å to show the nucleosome particle in its entirety (including the less rigid entry and exit DNA). On the right, the same structure is shown at full power (2.5 Å resolution). (E) A close-up view of D, residues 2–4 of Cyclin B1 interact with the acidic patch of NCP147. Cyclin B1 is shown as a ball and stick, histones H2A and H2B are shown as electrostatic surface potentials (−/+5.000). (F) Same structure as in (E), however, H2A and H2B histones are shown as ribbon models. Interacting side chains are depicted. Dashed lines indicate hydrogen bonds between R4 of Cyclin B1 and acidic patch residues D90 and E92. Cyclin B1 peptide backbone at A2 interacts with E110 of H2B. (G) Cryo-EM density on the side chains shown in (F). (H) Maximum projections of confocal images representative of RPE-1 Cyclin B1-mEmerald+/+ cells ectopically expressing the indicated variant of Cyclin B1-mScarlet. The scale bar represents 10 μm. (I) Line-profile graph representing the pixel-by-pixel fluorescence intensity over a line drawn from centrosome to centrosome of RPE-1 Cyclin B1-mEmerald+/+ cells ectopically expressing the indicated Cyclin B1 variant: n = 18 cells per condition, N = 3 independent experiments. Mean ± standard deviation are plotted. (J) Line-profile graph representing the pixel-by-pixel fluorescence intensity over a line drawn from centrosome to centrosome of RPE-1 Cyclin B1-mEmerald+/+ cells ectopically expressing the indicated Securin variant: n ≥ 16 cells per condition, N = 3 independent experiments. Mean ± standard deviation are plotted. Source data are available online for this figure.
Figure 5
Figure 5. Cyclin B1 nucleosome localisation determines its timely degradation.
(A, B). Plot of the fluorescence intensity of Cyclin B1 over time: n ≥ 17 cells per condition, N ≥ 3 independent experiments. In this and the following Cyclin B1 degradation graphs: Cyan -endogenous Cyclin B1-mEmerald; Magenta - ectopically expressed Cyclin B1-mScarlet, unless otherwise specified. Mean ± standard deviation are plotted. (C, D) Representative graphs of the autocorrelation of APC8-mScarlet (magenta) and ectopically expressed Cyclin B1-mEmerald (cyan) variant and the cross-correlation (yellow) between the two. Source data are available online for this figure.
Figure 6
Figure 6. Restoring Cyclin B1Δ9 chromatin localisation rescues its degradation timing.
(A) The elution profile of APC/CCDC20 with Cyclin B1WT (cyan) or Cyclin B1Δ9 (magenta) on size-exclusion chromatography. Graph representative of N = 3 independent experiments. (B) Representative immunoblot of the size-exclusion chromatography is shown in (A). (C, D) Left: Maximum projections of confocal images representative of RPE-1 Cyclin B1-mEmerald+/+ cells ectopically expressing the indicated variant of Cyclin B1-mScarlet. The scale bar corresponds to 10 μm. Middle: Graphs representing the pixel-by-pixel fluorescence intensity over a line going from centrosome to centrosome of RPE-1 Cyclin B1-mEmerald+/+ (Cyan) cells ectopically expressing the indicated variant of Cyclin B1-mScarlet (Magenta). Grey indicates siR-DNA staining: n ≥ 38 cells per condition, N ≥ 3 independent experiments. Mean ± standard deviation are plotted. Right: Cyclin B1 degradation graph representing the fluorescence intensity of Cyclin B1 over time of RPE-1 Cyclin B1-mEmerald+/+ (Cyan) cells ectopically expressing the indicated variant of Cyclin B1-mScarlet (Magenta): n ≥ 15 cells per condition, N ≥ 3 independent experiments. Mean ± standard deviation are plotted. Source data are available online for this figure.
Figure 7
Figure 7. Endogenous Cyclin 4E7E recapitulates ectopic Cyclin 4E7E and increases genomic instability.
(A) Schematic representation of the CRISPR strategy used to introduce the 4E7E mutation. The green box indicates CyclinB1’s first exon, the blue box is a neomycin resistance cassette, grey box indicates the 5’UTR of CyclinB1. Yellow triangles indicate RoxP sites. The red text refers to CyclinB1’s ATG, blue text refers to PAM sites. (B) Graphs representing the pixel-by-pixel fluorescence intensity over a line going from centrosome to centrosome of RPE-1 Cyclin B1-mEmerald+/+ compared to Cyclin B14E7E clones. For (panels BG): n ≥ 12 cells per condition, N = 3 independent experiments. Mean ± standard deviation are plotted. (C, D) Cyclin B1 degradation graph representing the fluorescence intensity of Cyclin B1 over time of RPE-1 Cyclin B1-mEmerald+/+ compared to Cyclin B14E7E clones. Mean ± standard deviation are plotted. (E) Dot plots representing the quantification of the mean fluorescence intensity of Cyclin B1 during metaphase in RPE-1 Cyclin B1-mEmerald+/+ compared to Cyclin B14E7E clones. (F, G) Dot plots representing the maximal degradation speed (E) or the initial degradation time (F) of RPE-1 Cyclin B1-mEmerald+/+ compared to Cyclin B14E7E clones. (H) Bar graph representing the karyotype classification from metaphase chromosome spreads of RPE-1 Cyclin B1-mEmerald+/+ compared to p53−/− clones and Cyclin B14E7E clones. The dotted line represents the level of aneuploidy in parental cells. N = 3 independent experiments. (I) Bar graph representing the karyotype classification from metaphase chromosome spreads of the indicated RPE-1 Cyclin B14E7E-mEmerald+/+ clones following 3 weeks of ectopic expression of either Cyclin B1WT-mScarlet or Cyclin B14E7E-mScarlet. N = 2 independent experiments. Source data are available online for this figure.
Figure EV1
Figure EV1. Characterisation of RPE-1 CyclinB1-mEmerald+/+ and APC8-mScarlet+/+ cells.
(A) Representative fluorescence confocal image of RPE-1 CyclinB1-mEmerald+/+; APC8+/+ cells in interphase. The scale bar corresponds to 20 μm. (B) Representative fluorescence confocal images over time of a CyclinB1-mEmerald+/+; APC8+/+ cell progressing through mitosis. Time is expressed as mm:ss. The scale bar corresponds to 10 μm. (C) Dot plots of the mitotic timing of parental RPE-1, RPE-1 APC8-mScarlet+/+, RPE-1 CyclinB1-mEmerald+/+ and APC8-mScarlet+/+ cells, untreated (left) or treated with 100 nM paclitaxel (right). Each small dot represents one cell and large dots represent the median of independent experiments: n ≥ 83 cells per condition, N = 3 independent experiments. Numbers on the graphs indicate the percentage of cells completing mitosis during the time of observation. Clones marked in red are the ones selected for all following experiments. (D) Top, growth curve of RPE-1 (black), RPE-1 APC8-mScarlet+/+(orange), RPE-1 CyclinB1-mEmerald+/+ and APC8-mScarlet+/+(red), N = 3 experiment. Mean ± standard deviation are plotted. Bottom, dot plot of the chromosome number of parental RPE-1, RPE-1 APC8-mScarlet+/+, RPE-1 CyclinB1-mEmerald+/+ and APC8-mScarlet+/+ cells. Each dot represents one chromosome spread: n ≥ 34 spreads per condition, N = 2. (E) Representative anti-APC8, anti-APC4 and β-Tubulin immunoblot of cell lysates from parental RPE-1, RPE-1 APC8-mScarlet+/+, RPE-1 CyclinB1-mEmerald+/+ and APC8-mScarlet+/+ cells before and after immunodepleting APC4, compared with control immunodepletion with IgG. (F) Bar graphs representing the quantification of the immunoblot in (panel E). N = 2 independent experiments. Mean ± standard deviation are plotted. (G) Graph representing the autocorrelation function of APC8-mScarlet over time in the nucleus. (H) Quantification of normalised Cyclin B1 fluorescence levels over time measured by spinning-disk fluorescence microscopy in RPE-1 CyclinB1-mEmerald+/+ cells compared to RPE-1 CyclinB1-mEmerald+/+; RPE-1 APC8-mScarlet+/+, RPE-1 CyclinB1-mEmerald+/+ cells. n ≥ 9 cells per condition, N = 3 independent experiments. Mean ± standard deviation are plotted. Figure EV1 – Supplementary text to determine whether APC8-mScarlet is properly incorporated into the APC/C, we reasoned that immunoprecipitating an APC/C subunit would result in a depletion of APC8 levels in the lysate. Measuring the levels of APC8 immunodepletion following immunoprecipitation of APC4 revealed no significant cgq RPE-1, RPE APC8-mScarlet+/+, and RPE APC8-mScarlet+/+; Cyclin B1-mEmerald+/+ cells, indicating that mScarlet does not interfere with APC8 incorporation into the APC/C.
Figure EV2
Figure EV2. FCCS of Cyclin B1-mEmerald and APC8-mScarlet.
(AC, E, G) Representative graphs of the autocorrelation function of mEmerald and mScarlet and the cross-correlation function between the two in RPE-1 CyclinB1-mEmerald+/+; APC8-mScarlet+/+ (AC, E), and in RPE-1 APC8-mScarlet+/+ cells ectopically expressing Cyclin B1R45AL45A-mEmerald (G). (D, F) Dot plots representing the KD between endogenous Cyclin B1-mEmerald and APC8-mScarlet in metaphase cells following MG132 treatment (D) or in untreated prometaphase cells (F). n ≥ 18 cells per condition, N = 3 independent experiments. (H) Fractions from a ResourceQ elution of the APC/C purification. Run on a 4–12% Bis-Tris SDS-PAGE gel.
Figure EV3
Figure EV3. Cyclin B1 binding to nucleosomes.
(A) Representation of heteromeric crosslinks of the APC/C-CDC20-Cyclin B1NTD complex with the NCP. (B) Representation of the self-crosslinks of individual APC/C subunits, CDC20, Cyclin B1NTD and the four histones. (C) Representation of heteromeric crosslinks of the APC/C with the NCP. (D) Representation of self-crosslinks of individual APC/C subunits and histones. (EH). EMSA of NCP147 with the indicated variant of Cyclin B1. N = 3 independent experiments.
Figure EV4
Figure EV4. Cryo-EM analysis of the nucleosome core particle in complex with APC3 loop177-446.
(AC) Workflow showing a representative micrograph, the cryo-EM data collection parameters (A) and the single-particle analysis pipeline for the nucleosome core particle with the APC3 loop177-446 (B, C). N. of particles at each classification step is indicated. (D) Fourier shell correlation (FSC) curves, angular distribution plot and plot of the directional FSC that represent a measure of directional resolution anisotropy for all the reconstructions are shown. Directional FSC and sphericity determination was performed with the 3DFSC software (Tan et al, 2017).
Figure EV5
Figure EV5. Cryo-EM analysis of the nucleosome core particle in complex with Cyclin B1 N-terminus.
(AC) Workflow showing a representative micrograph, the cryo-EM data collection parameters (A) and the single-particle analysis pipeline for the nucleosome core particle in complex with Cyclin B N-terminus (NCPCbNT) (B, C). N. of particles at each classification step is indicated. (D) Fourier shell correlation (FSC) curves, angular distribution plot and plot of the directional FSC that represent a measure of directional resolution anisotropy for all the reconstructions are shown. Directional FSC and sphericity determination was performed with the 3DFSC software.

References

    1. Acquaviva C, Pines J (2006) The anaphase-promoting complex/cyclosome: APC/C. J Cell Sci 119:2401–2404 - PubMed
    1. Afonine PV, Poon BK, Read RJ, Sobolev OV, Terwilliger TC, Urzhumtsev A, Adams PD (2018) Real-space refinement in PHENIX for cryo-EM and crystallography. Acta Crystallogr Sect Struct Biol 74:531–544 - PMC - PubMed
    1. Alfieri C, Chang L, Zhang Z, Yang J, Maslen S, Skehel M, Barford D (2016) Molecular basis of APC/C regulation by the spindle assembly checkpoint. Nature 536:431–436 - PMC - PubMed
    1. Alfieri C, Tischer T, Barford D (2020) A unique binding mode of Nek2A to the APC/C allows its ubiquitination during prometaphase. EMBO Rep 21:e49831 - PMC - PubMed
    1. Alfieri C, Zhang S, Barford D (2017) Visualizing the complex functions and mechanisms of the anaphase promoting complex/cyclosome (APC/C). Open Biol 7:170204 - PMC - PubMed

LinkOut - more resources