. 2024 Sep;4(9):1263-1278.
doi: 10.1038/s43587-024-00682-4. Epub 2024 Aug 14.

Proteomics identifies potential immunological drivers of postinfection brain atrophy and cognitive decline

Affiliations

Proteomics identifies potential immunological drivers of postinfection brain atrophy and cognitive decline

Michael R Duggan et al. Nat Aging. 2024 Sep.

Abstract

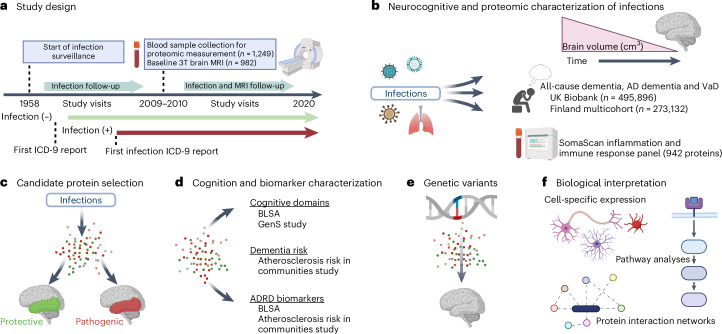
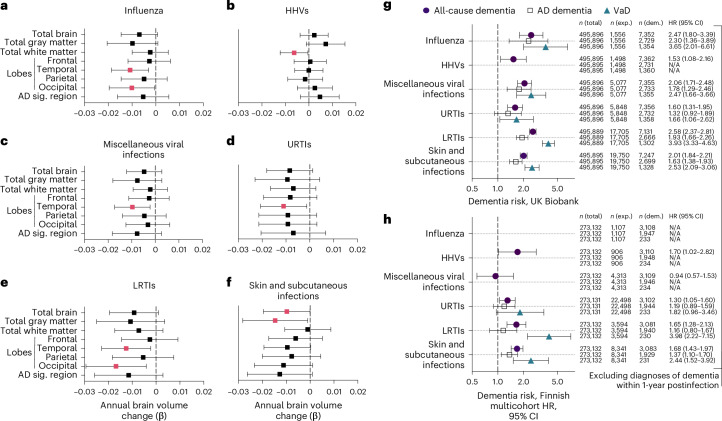
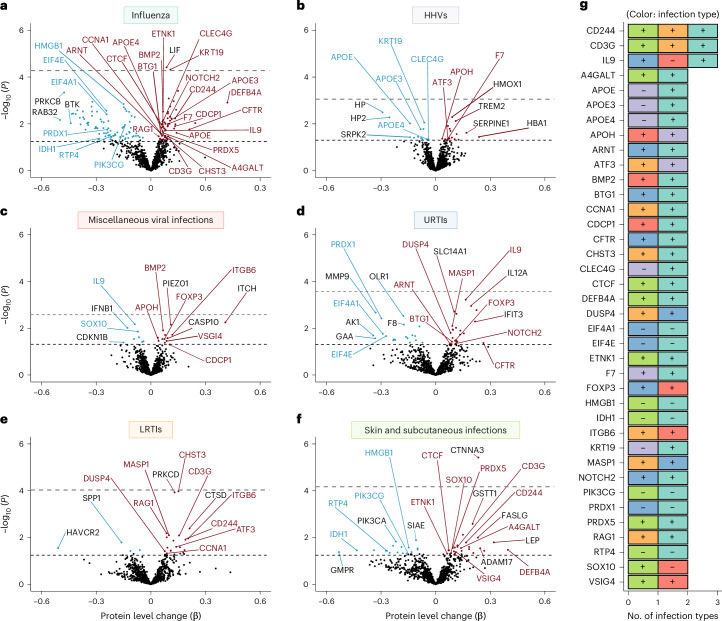
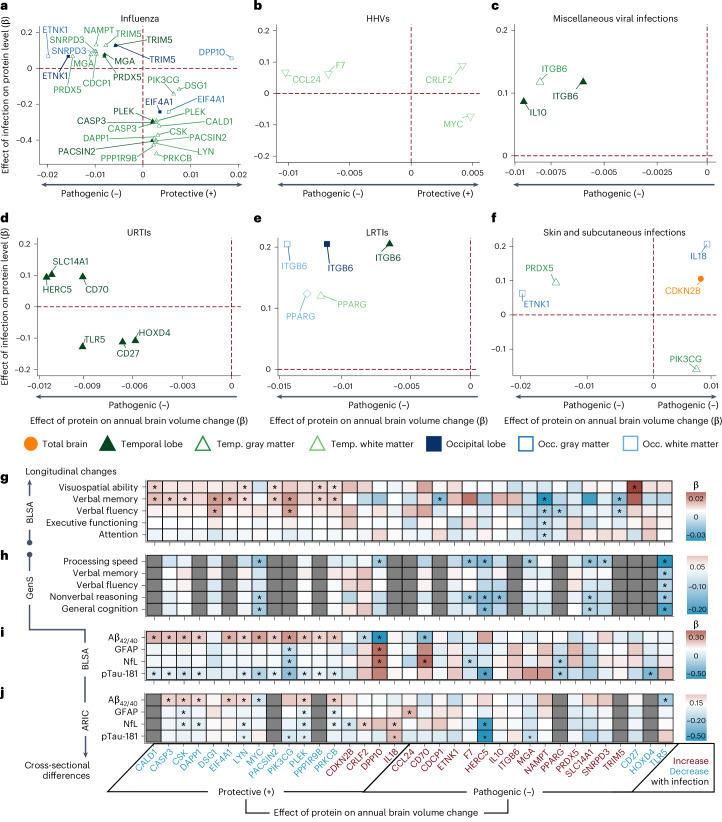
Infections have been associated with the incidence of Alzheimer disease and related dementias, but the mechanisms responsible for these associations remain unclear. Using a multicohort approach, we found that influenza, viral, respiratory, and skin and subcutaneous infections were associated with increased long-term dementia risk. These infections were also associated with region-specific brain volume loss, most commonly in the temporal lobe. We identified 260 out of 942 immunologically relevant proteins in plasma that were differentially expressed in individuals with an infection history. Of the infection-related proteins, 35 predicted volumetric changes in brain regions vulnerable to infection-specific atrophy. Several of these proteins, including PIK3CG, PACSIN2, and PRKCB, were related to cognitive decline and plasma biomarkers of dementia (Aβ42/40, GFAP, NfL, pTau-181). Genetic variants that influenced expression of immunologically relevant infection-related proteins, including ITGB6 and TLR5, predicted brain volume loss. Our findings support the role of infections in dementia risk and identify molecular mediators by which infections may contribute to neurodegeneration.


Conflict of interest statement

M.A.N. and C.X.A.’s participation in this project was part of a competitive contract awarded to DataTecnica LLC by the NIH to support open science research. M.A.N. also currently serves on the scientific advisory board for Character Bio Inc. and Neuron23 Inc. The remaining authors declare no competing interests.

Figures

Fig. 1
Fig. 1. Study design.
a, BLSA participants were classified according to the presence or absence of infection diagnoses using ICD-9 codes collected at study visits as early as 1958. Repeated 3T MRI scans were initiated in 2009–2010. Blood samples were collected at the initial 3T MRI scan and, for a subset of participants, at the time of a first PET scan as part of a separate study. b, Analyses examined how infection diagnoses are associated with brain volume changes over time and an immunological plasma proteome in the BLSA, as well as risk of all-cause dementia, AD dementia and VaD in the UK Biobank and a Finnish multicohort sample (the FPS study, the HeSSup study, and the STW study). c, Candidate proteins were selected if they were associated with an infection and related to changes in brain regions vulnerable to infection-specific atrophy, and were defined as protective or pathogenic, depending on whether they predicted preserved or reduced longitudinal brain volumes, respectively. d, Candidate proteins were related to longitudinal performance across five cognitive domains (the BLSA), cross-sectional performance across five cognitive domains (the GenS study), dementia risk (the ARIC study), and ADRD biomarkers (Aβ42/40, GFAP, NfL, pTau-181; the BLSA and the ARIC study). e, Genetic variants that influenced candidate protein levels were associated with changes in brain volumes in the BLSA and an external cohort (the ENIGMA consortium). f, The biological implications and functional relevance of candidate proteins were assessed using a variety of complementary analytical tools and open-source databases. All panels were created with BioRender.
Fig. 2
Fig. 2. Annual changes in brain volumes and dementia risk associated with infections.
af, Forest plots showing the associations of brain volume loss over time with influenza (a), HHVs (b), miscellaneous viral infections (c), URTIs (d), LRTIs, (e) and skin and subcutaneous infections (f) in the BLSA. Adjusted differences in annual changes of standardized brain volumes associated with a history of a given infection (β) were derived from linear mixed-effect models (n = 982) adjusted for intracranial volume, baseline age, sex, race, education, APOEε4, a comorbidity index (that is, obesity, hypertension, diabetes, cancer, ischemic heart disease, chronic heart failure, chronic kidney disease and chronic obstructive pulmonary disease) and two-way interactions of covariates with time. Pink squares reflect statistically significant associations. The AD signature region was the combined volume of the hippocampus, parahippocampal gyrus, entorhinal cortex, posterior cingulate gyrus, precuneus and cuneus. g,h, Additional forest plots showing the associations of infections with risk of all-cause dementia, AD dementia and VaD in the UK Biobank (g) and the Finnish multicohort sample (h; the FPS study, the HeSSup study and the STW study) after excluding dementia cases documented within 1 year postinfection. Columns report frequencies of the total sample, individuals exposed to a given infection and individuals diagnosed with dementia. Filled-in shapes reflect statistically significant associations. Data are presented as hazard ratios (HRs) and 95% confidence intervals (CIs). N/A indicates insufficient sample size to assess dementia risk. Adjusted differences in dementia risk associated with history of a given infection were derived from Cox proportional hazards regression models adjusted for age, sex and socioeconomic status. All-cause dementia included participants with a diagnosis of AD dementia, VaD, Parkinson’s disease dementia, frontotemporal dementia and other, less common dementia diagnoses (for example, unspecified dementia). Statistical significance was defined at a two-sided P < 0.05 without adjustment for multiple comparisons. The exact P values are presented in the source data files of Supplementary Tables 4, 7 and 9. AD sig, AD signature; exp., exposed; dem, dementia.
Fig. 3
Fig. 3. Differences in immunological plasma proteins (942 proteins; SomaScan Inflammation and Immune Response Panel) associated with infections in the BLSA.
af, Volcano plots showing the differences in protein levels associated with influenza (a), HHVs (b), miscellaneous viral infections (c), URTIs (d), LRTIs, (e) and skin and subcutaneous infections (f). Adjusted differences in log2(protein levels) associated with history of a given infection (β) were derived from multiple linear regression models (n = 1,184) adjusted for age, sex, race, education, APOEε4, eGFR-creatinine, and a comorbidity index (that is, obesity, hypertension, diabetes, cancer, ischemic heart disease, chronic heart failure, chronic kidney disease, and chronic obstructive pulmonary disease). Proteins above the dashed horizontal black line were statistically significant (uncorrected P < 0.05), with red and blue dots indicating positive and negative associations, respectively. The FDR-corrected P-value threshold is indicated by the dashed gray line. Red and blue labels represent proteins associated with two or more infections, whereas black labels indicate proteins uniquely associated with a given infection. g, A clustered bar graph showing proteins associated with two or more infections. Adjusted differences in log2(protein levels) associated with history of a given infection were derived from multiple linear regression models adjusted for the aforementioned covariates. The (+) and (−) indicate that higher or lower protein levels were associated with a given infection. Statistical significance was defined at two-sided P < 0.05 without adjustment for multiple comparisons. The exact P values are presented in the source data files of Supplementary Table 13.
Fig. 4
Fig. 4. Candidate proteins relate to changes in brain regions vulnerable to infection-specific atrophy, longitudinal cognitive performance, plasma biomarkers and cognitive performance.
af, Scatterplots showing how differences in protein levels associated with specific infections (y axis) relate to a given protein’s longitudinal effect on brain regions vulnerable to infection-specific atrophy (x axis) in the BLSA, specifically for influenza (a), HHVs (b), miscellaneous viral infections (c), URTIs (d), LRTIs, (e) and skin and subcutaneous infections (f). Candidate proteins were defined as protective or pathogenic, depending on their associations with preserved or reduced longitudinal brain volumes. Differences in protein levels associated with infections (y axis, β) were derived from linear regression models (n = 1,184) adjusted for the aforementioned covariates, and differences in brain volumes changes related to protein levels (x axis, β) were derived from linear mixed-effect models (n = 977) adjusted for similar covariates plus intracranial volume and two-way interactions with time. All displayed associations are statistically significant. g, Heatmap showing associations of candidate proteins with longitudinal cognitive performance in the BLSA. Differences in annual changes of cognitive scores related to protein levels (β) were derived from linear mixed-effect models (n = 1,233) adjusted for the aforementioned covariates. h, Heatmap showing associations of candidate proteins with cognitive performance in the GenS cohort. Differences in cognitive scores related to protein levels (β) were derived from linear mixed-effect models (n = 1,065) corrected for relatedness across individuals, age, sex, depression, study site, and storage time. i, Heatmap showing associations of candidate proteins with plasma biomarkers in the BLSA. Differences in biomarkers related to protein levels (β) were derived from linear regression models (Aβ42/40, GFAP and NfL, n = 757; pTau-181, n = 674) adjusted for the aforementioned BLSA covariates plus eGFR-creatinine. j, Heatmap showing associations of candidate proteins with plasma biomarkers in the ARIC study. Differences in biomarkers related to protein levels (β) were derived from linear regression models (n = 1,419) adjusted for age, sex, race center, education, APOEε4, eGFR-creatinine, and cardiovascular risk factors. *Statistically significant (uncorrected P < 0.05). Statistical significance was defined at two-sided P < 0.05 without adjustment for multiple comparisons. The exact P values are presented in the source data files of Supplementary Tables 13, 16, 19, 20, 24 and 26. Temp. Temporal; Occ., Occipital.
Fig. 5
Fig. 5. Genetic variants that influence expression of candidate proteins also relate to brain volume loss in the BLSA and an independent cohort, the ENIGMA consortium.
a, A boxplot showing plasma levels of ITGB6 stratified by the rs8099840 genotype. b, A scatterplot showing the associations of plasma ITGB6 protein levels with rates of temporal gray matter (TEMGM) volume loss over time stratified by rs8099840 alleles. c, A boxplot of TLR5 plasma levels stratified by the rs75118229 genotype. d, A scatterplot showing the associations of plasma TLR5 protein levels with rates of total brain (TB) volume loss over time stratified by rs75118229 alleles. Adjusted differences in log2(protein levels) associated with a given SNP were derived from multiple linear regression models (n = 469) adjusted for covariates used in the pQTL discovery cohort, namely baseline age and sex. Adjusted differences in annual changes of standardized brain volumes associated with a given SNP were derived from linear mixed-effect models (n = 469) adjusted for similar covariates, along with intracranial volume and two-way interactions with time. Individual specific rates of brain volume loss (random effect of time) are displayed. Associations displayed in b and d reflect statistically significant relationships. *Statistically significant (uncorrected P < 0.05); **statistically significant (uncorrected P < 0.01). Box plots: median, 25–75th quartiles; whiskers: 1.5× the IQR. The pQTLs were obtained from deCODE Genetics and SNPs in the BLSA were used for analyses. e, A forest plot displaying the results of Mendelian randomization analyses that assessed the relationship between genetically determined plasma protein levels and changes in MRI-derived TB volumes. The results were derived from inverse variance-weighted or Wald’s ratio estimates. Plasma pQTLs were obtained from deCODE Genetics (n = 35,559). Longitudinal TB volume summary statistics were obtained from an ENIGMA consortium GWAS (n = 15,640). Data are presented as β coefficients and 95% CIs. Red triangles indicate statistically significant associations (uncorrected P < 0.05). Statistical significance was defined at two-sided P < 0.05 without adjustment for multiple comparisons. The exact P values are presented in the source data files of Supplementary Tables 29 and 30. Misc., miscellaneous; r.f.u., relative fluorescence units.
Fig. 6
Fig. 6. Pathway analysis and summary of evidence.
a, A canonical pathway plot showing the top six biological pathways enriched for candidate proteins. Values in the nodes correspond to −log(Benjamini-Hochberg corrected) P values derived from Fisher’s exact tests. Values in between nodes correspond to frequencies of overlapping candidate proteins across respective biological pathways, with color coding used to improve interpretability. The results are derived from ingenuity pathway analysis (IPA). b, A radial plot showing resiquimod, an antiviral medication and the top upstream regulator of candidate proteins, as well as its predicted effects on specific candidate proteins. Shapes correspond to protein type (cytokine, enzyme, transmembrane, kinase). Results were derived from Fisher’s exact tests in IPA. c, An upset plot summarizing evidence for candidate proteins, including empirical results obtained from the current analyses, as well as protein–protein interaction networks (STRING; predicted protein conformations are depicted in each circular node), cell-specific expression patterns (Human Protein Atlas), expression levels (RNA, protein) in postmortem AD brain tissue (AMP-AD), nominated therapeutic targets (AMP-AD), and targets of known medications (Open Targets). d, Proposed model by which infections may contribute to increased risk for neurodegeneration. A history of specific infections is linked to increased levels of proteins that exert deleterious effects on brain volumes over time (pathogenic) and decreased levels of proteins associated with stable brain volumes (protective), which are indicated in corresponding circles for each infection type. Protective proteins may exert their effects through alterations to amyloidogenic pathways, as indicated by changes in plasma Aβ42/40 ratio and pTau-181, whereas pathogenic proteins may exert their effects through other mechanisms that require further elucidation. Modulation of the plasma immune proteome among individuals with a prior infection and subsequent changes in rates of brain atrophy over time may ultimately increase risk for cognitive decline and dementia. The exact P values are presented in the source data files of Supplementary Tables 32–39. Diff., differential; RAR, retinoic acid receptor. Panel d was created with BioRender.
Extended Data Fig. 1
Extended Data Fig. 1. Annual changes in lobar white and gray matter volumes associated with infections.
Forest plots show the associations of brain volume loss over time with a influenza b human herpes viruses c miscellaneous viral infections d upper respiratory tract infections e lower respiratory tract infections and F skin/subcutaneous infections in the Baltimore Longitudinal Study of Aging. Data are presented as beta coefficients and 95% confidence intervals. Pink squares reflect statistically significant associations. Adjusted differences in annual changes of standardized brain volumes associated with history of a given infection (β) were derived from linear mixed-effects models (n = 982) adjusted for intracranial volume, baseline age, sex, race, education, APOEε4, a comorbidity index (that is, obesity, hypertension, diabetes, cancer, ischemic heart disease, chronic heart failure, chronic kidney disease, and chronic obstructive pulmonary disease), and two-way interactions of covariates with time. Statistical significance was defined at two-sided p < 0.05 without adjustment for multiple comparisons. The exact p-values are presented in the source data files, Supplementary Table 4.
Extended Data Fig. 2
Extended Data Fig. 2. Dementia risk associated with infections.
Forest plots show the associations of infections with risk of all-cause, Alzheimer’s disease, and vascular dementias in the UK Biobank after excluding dementia cases documented within a 5-yr and b 10-yr post-infection. Additional forest plots show the associations of infections with risk of all-cause, Alzheimer’s disease, and vascular dementias in the Finnish multicohort sample (the Finnish Public Sector study, the Health, and Social Support study, and the Still Working study) after excluding dementia cases documented within c 5-yr and d 10-yr post-infection. Columns report frequencies of the total sample, individuals exposed to a given infection, and individuals diagnosed with dementia. Data are presented as hazard ratios and 95% confidence intervals. NA indicates insufficient sample size to assess dementia risk. Filled in shapes reflect statistically significant associations. Adjusted differences in dementia risk associated with history of a given infection (hazard ratios) were derived from Cox proportional hazards regression models adjusted for age, sex, and socioeconomic status. All-cause dementia included participants with a diagnosis of Alzheimer’s disease dementia, vascular dementia, Parkinson’s disease dementia, frontotemporal dementia, and other, less commonly specified dementia diagnoses (for example, unspecified dementia). Statistical significance was defined at two-sided p < 0.05 without adjustment for multiple comparisons. The exact p-values are presented in the source data files, Supplementary Tables 7, 9.
Extended Data Fig. 3
Extended Data Fig. 3. Annual changes in brain volumes associated with candidate proteins as a function of infection.
Line graphs display annual changes in temporal gray matter volumes associated with PRDX5 levels as a function of a influenza and b skin/subcutaneous infections in the Baltimore Longitudinal Study of Aging. To improve interpretation, the effects of PRDX5 are displayed based on lower/upper PRDX5 quartiles (continuous PRDX5 levels were used in analyses). Adjusted differences in annual changes of standardized brain volumes associated with history of a given infection were derived from linear mixed-effects models (n = 1,184) adjusted for intracranial volume, baseline age, sex, race, education, APOEε4, a comorbidity index (that is, obesity, hypertension, diabetes, cancer, ischemic heart disease, chronic heart failure, chronic kidney disease, and chronic obstructive pulmonary disease), and two-way interactions of covariates with time, as well as two-way and three-way interaction terms (infection*protein, infection*protein*time) to examine whether an infection diagnosis modified the association of protein level with longitudinal brain volume change. The displayed associations reflect statistically significant relationships. Statistical significance was defined at two-sided p < 0.05 without adjustment for multiple comparisons. The exact p-values are presented in the source data files, Supplementary Table 17.
Extended Data Fig. 4
Extended Data Fig. 4. Dementia risk in the Atherosclerosis Risk in Communities (ARIC) study.
A forest plot shows odds ratio of pre-existing all-cause dementia associated with candidate proteins. Adjusted odds of dementia risk were derived from binary logistic regression models (n = 4,743) adjusted for age, sex, race-center, education, APOEε4, eGFR-creatinine, and cardiovascular risk factors (BMI, diabetes, hypertension, and current smoking status). Pink circles reflect statistically significant associations. Data are presented as odds ratios and 95% confidence intervals. Statistical significance was defined at two-sided p < 0.05 without adjustment for multiple comparisons. The exact p-values are presented in the source data files, Supplementary Table 22.
Extended Data Fig. 5
Extended Data Fig. 5. Annual changes in brain volumes associated with genetic variants.
Forest plots show the associations of brain volume loss over time with a the rs8099840 C allele (which significantly influenced levels of ITGB6) and b the rs75118229 C allele (which significantly influenced levels of TLR5) in the Baltimore Longitudinal Study of Aging. Adjusted differences in annual changes of standardized brain volumes associated with a given SNP were derived from linear mixed-effects models (n = 469) adjusted for covariates used in the pQTL discovery cohort (deCODE Genetics), namely intracranial volume, baseline age and sex and two-way interactions of age and sex with time. Pink triangles reflect statistically significant associations (uncorrected p < 0.05). Data are presented as beta coefficients and 95% confidence intervals. Statistical significance was defined at two-sided p < 0.05 without adjustment for multiple comparisons. Key: TB, Total brain; vCSF, Ventricle; GM, Gray matter; WM, White matter; Frontal, Frontal lobe; Temporal, Temporal lobe; Parietal, Parietal lobe; Occipital, Occipital lobe; FRNGM, Frontal gray matter; TEMGM, Temporal gray matter; PARGM, Parietal gray matter; OCCGM, Occipital gray matter; FRNWM, Frontal white matter; TEMWM, Temporal white matter; PARWM, Parietal white matter; OCCWM, Occipital white matter; SFG, Superior frontal gyrus; MFG, Middle frontal gyrus; IFG, Inferior frontal gyrus; MFC, Medial frontal cortex; OFC, Orbitofrontal gyrus; PrG, Precentral gyrus; PoG, Postcentral gyrus; SPL, Superior parietal lobe; SMG, Supramarginal gyrus; AnG, Angular gyrus; PCu, Precuneus; STG, Superior temporal gyrus; MTG, Middle temporal gyrus; ITG, Inferior temporal gyrus; HIP, Hippocampus; PHG, Parahippocampal gyrus; ERC, Entorhinal cortex; Amy, Amygdala; Fus, Fusiform gyrus; SOG, Superior occipital gyrus; MOG, Middle occipital gyrus; IOG, Inferior occipital gyrus; OCP, Occipital pole; Cun, Cuneus; ACgG, Anterior cingulate gyrus; PCgG, Posterior cingulate gyrus; MCgG, Middle cingulate gyrus; CN, Caudate; GP, Global pallidum; Put, Putamen; Thal, Thalamus. The AD-signature region volume was the combined volume of hippocampus, parahippocampal gyrus, entorhinal cortex, posterior cingulate gyrus, precuneus, and cuneus. The exact p-values are presented in the source data files, Supplementary Table 29.
Extended Data Fig. 6
Extended Data Fig. 6. Expression in all cell types.
Heatmap shows expression levels of genes encoding candidate proteins (cognate genes) across 76 available cell types based on single cell transcriptomics data sourced from the Human Protein Atlas. *Gene encoding candidate protein was highly expressed in at least one CNS cell type. Dendrograms reflect hierarchical clustering using Euclidean distances calculated from normalized Transcripts per Million. Key: nTPM, normalized Transcripts per Million. The exact p-values are presented in the source data files, Supplementary Table 35.
Extended Data Fig. 7
Extended Data Fig. 7. Expression in CNS cell types.
Heatmap shows expression levels of genes encoding candidate proteins (cognate genes) across CNS cell types based on single cell transcriptomics data sourced from the Human Protein Atlas. *Gene encoding candidate protein was highly expressed in at least one CNS cell type. Dendrograms reflect hierarchical clustering using Euclidean distances calculated from normalized Transcripts per Million. Key: nTPM, normalized Transcripts per Million. The exact p-values are presented in the source data files, Supplementary Table 35.
Extended Data Fig. 8
Extended Data Fig. 8. Expression in neurovascular cell types.
A bar graph shows the frequency of genes encoding candidate proteins (cognate genes) differentially expressed in AD brains across 18 different neurovascular cell types. Results derived from Welch’s t-test that compared expression levels between AD and control participants. Key: AD, Alzheimer’s disease. The exact p-values are presented in the source data files, Supplementary Table 38.

References

    1. Cocoros, N. M. et al. Long-term risk of Parkinson disease following influenza and other infections. JAMA Neurol.78, 1461–1470 (2021). - PMC - PubMed
    1. Sipilä, P. N. et al. Hospital-treated infectious diseases and the risk of dementia: a large, multicohort, observational study with a replication cohort. Lancet Infect. Dis.21, 1557–1567 (2021). - PMC - PubMed
    1. Sun, J. et al. Hospital-treated infections in early- and mid-life and risk of Alzheimer’s disease, Parkinson’s disease, and amyotrophic lateral sclerosis: a nationwide nested case-control study in Sweden. PLoS Med.19, e1004092 (2022). - PMC - PubMed
    1. Muzambi, R. et al. Assessment of common infections and incident dementia using UK primary and secondary care data: a historical cohort study. Lancet Healthy Longevity2, e426–e435 (2021). - PMC - PubMed
    1. Levine, K. et al. Virus exposure and neurodegenerative disease risk across national biobanks. Neuron111, 1086–1093.e2. (2023). - PMC - PubMed

Grants and funding