. 2024 Aug 14;7(1):989.
doi: 10.1038/s42003-024-06649-w.

The proteomic landscape of in vitro cultured endothelial cells across vascular beds

Affiliations

The proteomic landscape of in vitro cultured endothelial cells across vascular beds

Stijn A Groten et al. Commun Biol. .

Abstract

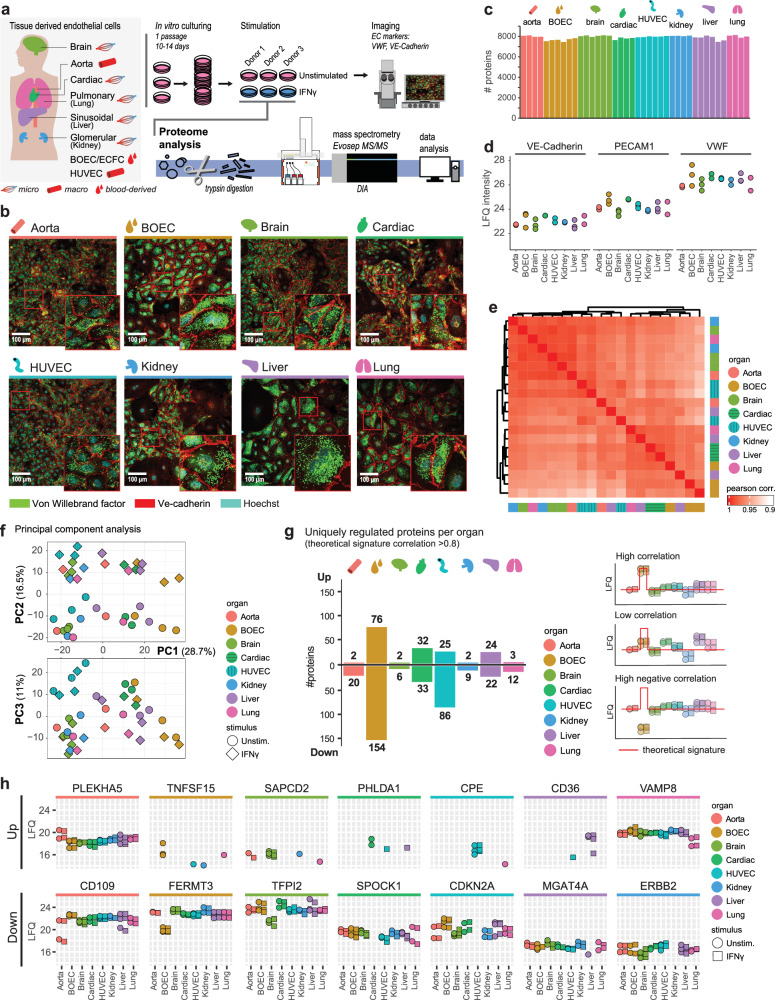
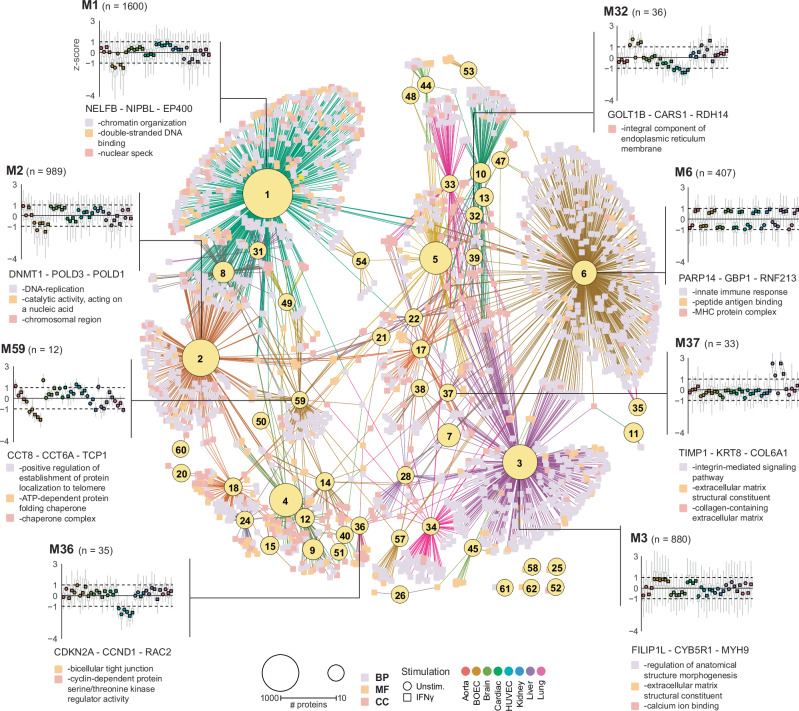
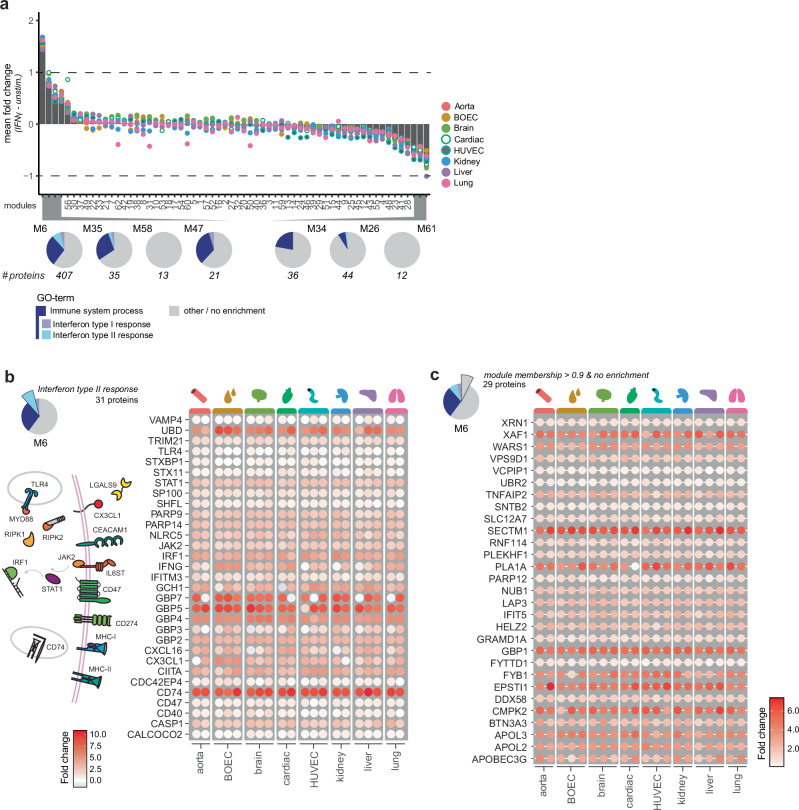
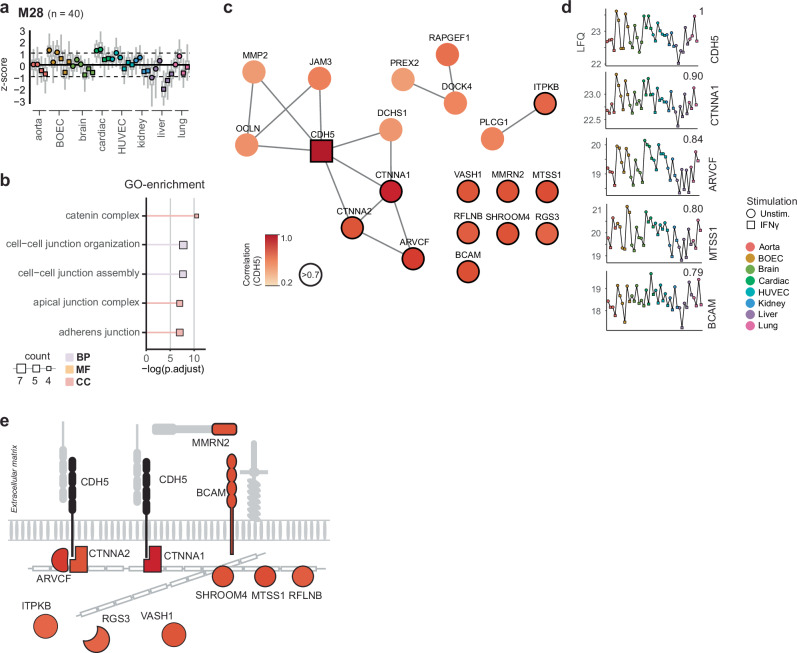
Blood vessel endothelial cells (EC) display heterogeneity across vascular beds, which is anticipated to drive site-specific vascular pathology. This heterogeneity is assessed using transcriptomics in vivo, and functional assays in vitro, but how proteomes compare across human in vitro cultured ECs remains incompletely characterized. We generated an in-depth human EC proteomic landscape (>8000 proteins) across six organs and two in vitro models in steady-state and upon IFNγ-induced inflammation. EC proteomes displayed a high similarity and organ-specific proteins were limited. Variation between ECs was mainly based on proliferation and differentiation processes in which Blood outgrowth endothelial cells (BOEC) and Human umbilical vein cells (HUVEC) represented the extremes of proteomic phenotypes. The IFNγ response was highly conserved across all samples. Harnessing dynamics in protein abundances we delineated VWF and VE-Cadherin correlation networks. This EC landscape provides an extensive proteomic addition in studying EC biology and heterogeneity from an in vitro perspective.


Conflict of interest statement

The authors declare no competing interests.

Figures

Fig. 1
Fig. 1. Proteomic signatures of ECs are dependent on organ-source and donor variations.
a Schematic overview of experimental workflow. Mass spectrometry acquisition was performed in one combined analysis with cells derived from three different donors per organ. b Confocal images per EC-type of VWF (green) and VE-Cadherin (red) immunostaining in unstimulated ECs, Hoechst staining in cyan. Representative experiment shown (n = 2 biologically independent experiments). Upper limit of the display range were adjusted equally across images for visualization purposes. c Number of quantified proteins across samples. d LFQ intensities of EC markers across unstimulated ECs. e Heatmap showing Pearson correlation between unstimulated samples. Color gradient (white to red) indicates Pearson correlation (0.9–1.0). f Principal component analysis (PCA) of proteomes across PC1, PC2 and PC3. Colors indicate EC-type. Unstimulated (circles) and IFNγ stimulated (diamonds) conditions are indicated. g Number of proteins with a unique down- or upregulation per EC-type (absolute correlation to theoretical signature >0.8). Examples of high, low and high negative correlation to one EC-type theoretical signature (red line) are shown. h LFQ intensities of top high and high negative correlating proteins shown per organ. Unstimulated (circles) and IFNγ stimulated (squares) are indicated. EC-types are indicated per color in all panels as follows: Aorta (red), BOEC (brown), Brain (light green), Cardiac (dark green), HUVEC (cyan), Kidney (blue), Liver (purple) and Lung (pink).
Fig. 2
Fig. 2. Interaction network shows varied trends in regulation of biological processes across EC-types.
Interaction network of WGCNA analysis modules and enriched GO-enrichment terms. Yellow nodes indicate modules, size shows number of proteins in the respective module. Squares indicate enriched GO-terms, Biological process (BP, blue), Molecular function (MF, yellow), Cellular component (CC, red). Edge colors indicate connected module. Examples of node regulation are shown as z-score means of LFQ intensities of the proteins in the module across EC-types and stimulation. Unstimulated (circles) and IFNγ stimulated (squares) are indicated. Mean z-score per sample per EC-type are indicated per color as follows: Aorta (red), BOEC (brown), Brain (light green), Cardiac (dark green), HUVEC (cyan), Kidney (blue), Liver (purple) and Lung (pink). Upper and lower parts of boxplots indicate the 25th and 75th percentiles of all protein z-scores per sample, outliers are not shown. Per module example, the top three highest correlating protein to respective modules, and top enriched GO-term per type are shown.
Fig. 3
Fig. 3. The IFNγ response is highly conserved.
a Bar graph of mean LFQ difference between unstimulated and stimulated proteins per module. Circles indicate mean LFQ difference per EC-type. EC-types are indicated per color as follows: Aorta (red), BOEC (brown), Brian (light green), Cardiac (dark green), HUVEC (cyan), Kidney (blue), Liver (purple) and Lung (pink). Pie charts of modules (mean LFC > 0.5) show relative enrichment of proteins per module of GO-terms “Immune system process” (blue), “Interferon type I response” (purple), “Interferon type II response” (cyan) and other/no enrichment (gray). Number of proteins per module are indicated. Heatmaps showing LFC change between unstimulated and stimulated per sample of proteins enriching for (b) “Interferon type II response” and (c) non-enriching proteins highly correlating to module 6 (Membership score >0.9). Color gradient (white to red) indicates LFC per sample (0–10 or 0–7 respectively). Schematic overview of “Interferon type II response” proteins is shown.
Fig. 4
Fig. 4. Protein dynamics reveal VWF correlation network.
a Module protein dynamics is shown as means of z-scores of LFQ intensities across EC-types and stimulation. Upper and lower parts of boxplots indicate the 25th and 75th percentiles of all protein z-scores per sample, outliers are not shown. b Top five significantly enriched GO-terms are shown (p < 0.05). Node size indicates number of enriched proteins per GO-term. Color indicates GO-term type, Biological process (BP, blue), Molecular function (MF, yellow), Cellular component (CC, red). c STRING-DB protein-protein interaction network of proteins with a reported interaction (confidence interactions score >0.4) and proteins with a high correlation to VWF (Pearson correlation >0.7, black border). Color gradient (white to red) indicates Pearson correlation (0.2–1.0). d LFQ intensities of top 4 VWF correlating proteins shown per organ. Pearson correlation is shown in top right per protein. e Line plots of mean LFQ intensities per organ and stimulation of known WPB cargo or interactors (black). Pearson correlation to VWF is shown in top right and mean VWF LFQ intensity is shown per protein (gray) For all panels: unstimulated (circles) and IFNγ stimulated (squares) are indicated. EC-types are indicated per color as follows: Aorta (red), BOEC (brown), Brain (light green), Cardiac (dark green), HUVEC (cyan), Kidney (blue), Liver (purple) and Lung (pink).
Fig. 5
Fig. 5. The VE-Cadherin complex network.
a Module protein dynamics is shown as means of z-scores of LFQ intensities across EC-types and stimulation. Upper and lower parts of boxplots indicate the 25th and 75th percentiles of all protein z-scores per sample, outliers are not shown. b Top five significantly enriched GO-terms are shown (p < 0.05). Node size indicates number of enriched proteins per GO-term. Color indicates GO-term type, Biological process (BP, blue), Molecular function (MF, yellow), Cellular component (CC, red). c STRING-DB protein-protein interaction network of proteins with a reported interaction (confidence interactions score >0.4) and proteins with a high correlation to VE-Cadherin (Pearson correlation >0.7, black border). Color gradient (white to red) indicates Pearson correlation (0.2–1.0). d LFQ intensities of top VE-Cadherin correlating proteins shown per organ. Pearson correlation is shown in top right per protein. e Schematic overview of VE-Cadherin (black) and highly correlating proteins (Pearson correlation >0.7). Color gradient (white to red) indicates Pearson correlation (0.2–1.0). For all panels: unstimulated (circles) and IFNγ stimulated (squares) are indicated. EC-types are indicated per color as follows: Aorta (red), BOEC (brown), Brain (light green), Cardiac (dark green), HUVEC (cyan), Kidney (blue), Liver (purple) and Lung (pink).

References

    1. Yau, J. W., Teoh, H. & Verma, S. Endothelial cell control of thrombosis. BMC Cardiovasc. Disord.15, 130 (2015). 10.1186/s12872-015-0124-z - DOI - PMC - PubMed
    1. Galley, H. F. & Webster, N. R. Physiology of the endothelium. Br. J. Anaesth.93, 105–113 (2004). 10.1093/bja/aeh163 - DOI - PubMed
    1. Pober, J. S. & Sessa, W. C. Evolving functions of endothelial cells in inflammation. Nat. Rev. Immunol.7, 803–815 (2007). 10.1038/nri2171 - DOI - PubMed
    1. Ashina, K. et al. Histamine induces vascular hyperpermeability by increasing blood flow and endothelial barrier disruption in vivo. PLoS ONE10, e0132367 (2015). - PMC - PubMed
    1. Aird, W. C. Phenotypic heterogeneity of the endothelium. Circ. Res.100, 158–173 (2007). 10.1161/01.RES.0000255691.76142.4a - DOI - PubMed

Publication types

MeSH terms

LinkOut - more resources