

Development of deep learning-based novel auto-segmentation for the prostatic urethra on planning CT images for prostate cancer radiotherapy
- PMID: 39143386
- PMCID: PMC11579160
- DOI: 10.1007/s12194-024-00832-8
Development of deep learning-based novel auto-segmentation for the prostatic urethra on planning CT images for prostate cancer radiotherapy
Abstract
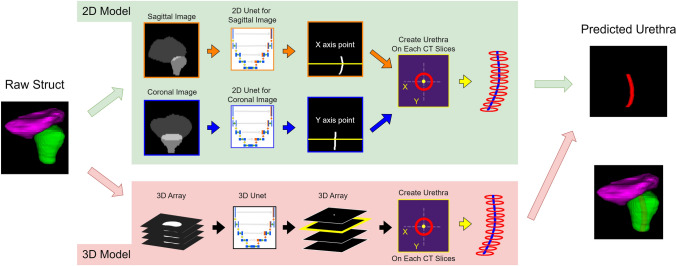
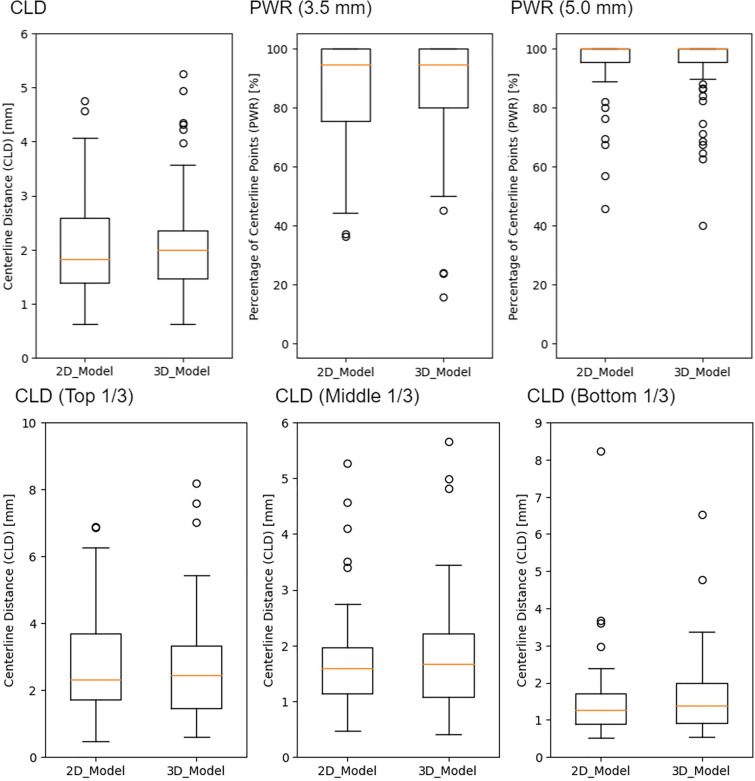
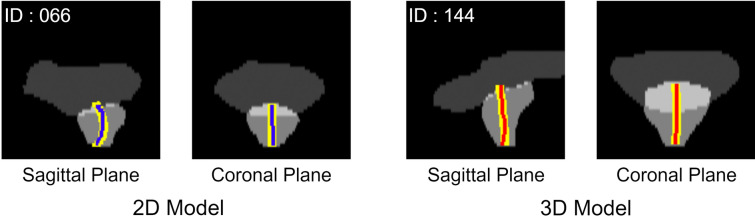
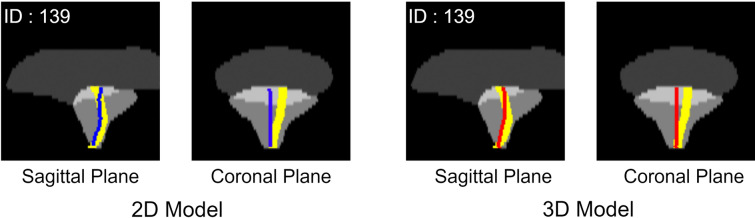
Urinary toxicities are one of the serious complications of radiotherapy for prostate cancer, and dose-volume histogram of prostatic urethra has been associated with such toxicities in previous reports. Previous research has focused on estimating the prostatic urethra, which is difficult to delineate in CT images; however, these studies, which are limited in number, mainly focused on cases undergoing brachytherapy uses low-dose-rate sources and do not involve external beam radiation therapy (EBRT). In this study, we aimed to develop a deep learning-based method of determining the position of the prostatic urethra in patients eligible for EBRT. We used contour data from 430 patients with localized prostate cancer. In all cases, a urethral catheter was placed when planning CT to identify the prostatic urethra. We used 2D and 3D U-Net segmentation models. The input images included the bladder and prostate, while the output images focused on the prostatic urethra. The 2D model determined the prostate's position based on results from both coronal and sagittal directions. Evaluation metrics included the average distance between centerlines. The average centerline distances for the 2D and 3D models were 2.07 ± 0.87 mm and 2.05 ± 0.92 mm, respectively. Increasing the number of cases while maintaining equivalent accuracy as we did in this study suggests the potential for high generalization performance and the feasibility of using deep learning technology for estimating the position of the prostatic urethra.
Keywords: CT image; Deep learning technology; Prostate cancer; Prostatic urethra; Urinary toxicity.
© 2024. The Author(s).
Conflict of interest statement
Declarations. Conflict of interest: There is no conflict of interest with regard to this manuscript. Ethical approval: This study was conducted with the approval of the Ethics Committee Tohoku University Graduate School of Medicine.
Figures
Similar articles
-
Multi-atlas-based auto-segmentation for prostatic urethra using novel prediction of deformable image registration accuracy.Med Phys. 2020 Jul;47(7):3023-3031. doi: 10.1002/mp.14154. Epub 2020 Apr 27. Med Phys. 2020. PMID: 32201958
-
Multi-atlas-based segmentation of prostatic urethra from planning CT imaging to quantify dose distribution in prostate cancer radiotherapy.Radiother Oncol. 2017 Dec;125(3):492-499. doi: 10.1016/j.radonc.2017.09.015. Epub 2017 Oct 12. Radiother Oncol. 2017. PMID: 29031609
-
The urethral position may shift due to urethral catheter placement in the treatment planning for prostate radiation therapy.Radiat Oncol. 2019 Dec 12;14(1):226. doi: 10.1186/s13014-019-1424-8. Radiat Oncol. 2019. PMID: 31831045 Free PMC article.
-
Simple diagrammatic method to delineate male urethra in prostate cancer radiotherapy: an MRI based approach.Br J Radiol. 2016 Dec;89(1068):20160348. doi: 10.1259/bjr.20160348. Epub 2016 Oct 17. Br J Radiol. 2016. PMID: 27748126 Free PMC article. Review.
-
Deep Learning in Radiation Oncology Treatment Planning for Prostate Cancer: A Systematic Review.J Med Syst. 2020 Aug 30;44(10):179. doi: 10.1007/s10916-020-01641-3. J Med Syst. 2020. PMID: 32862251
Cited by
-
Enhanced urethral identification for radiotherapy planning using fat-suppressed 3D T2-weighted magnetic resonance imaging.Radiol Phys Technol. 2025 Jun;18(2):589-596. doi: 10.1007/s12194-025-00903-4. Epub 2025 Apr 1. Radiol Phys Technol. 2025. PMID: 40167964 Free PMC article.
References
-
- National Cancer Center(2022.10.5), "Prostate Cancer", National Cancer Center Cancer Information Services. https://ganjoho.jp/reg_stat/statistics/stat/cancer/20_prostate.html
-
- Al-Mamgani A, Van Putten WLJ, Van Der Wielen GJ, Levendag PC, Incrocci L. Dose escalation and quality of life in patients with localized prostate cancer treated with radiotherapy: long-term results of the dutch randomized dose-escalation trial (CKTO 96–10 Trial). Int J Radiat Oncol Biol Phys. 2011;79:1004–12. - PubMed
-
- Rendeiro JA, Medeiros CA, Rodrigues P, De Letícia BR, Santiago R, Rocha B, et al. Physical exercise and quality of life in patients with prostate cancer systematic review and meta-analysis. Support Care Cancer. 2021. 10.1007/s00520-021-06095-y. - PubMed
-
- Takeda K, Takai Y, Narazaki K, Mitsuya M, Umezawa R, Kadoya N, et al. Treatment outcome of high-dose image-guided intensity-modulated radiotherapy using intra-prostate fiducial markers for localized prostate cancer at a single institute in Japan. 2012. Available: www.nccn.com - PMC - PubMed
MeSH terms
Grants and funding
LinkOut - more resources
Full Text Sources
Medical
