. 2025 Jun;43(6):960-970.
doi: 10.1038/s41587-024-02346-5. Epub 2024 Aug 14.

Rapid discovery of monoclonal antibodies by microfluidics-enabled FACS of single pathogen-specific antibody-secreting cells

Affiliations

Rapid discovery of monoclonal antibodies by microfluidics-enabled FACS of single pathogen-specific antibody-secreting cells

Katrin Fischer et al. Nat Biotechnol. 2025 Jun.

Abstract

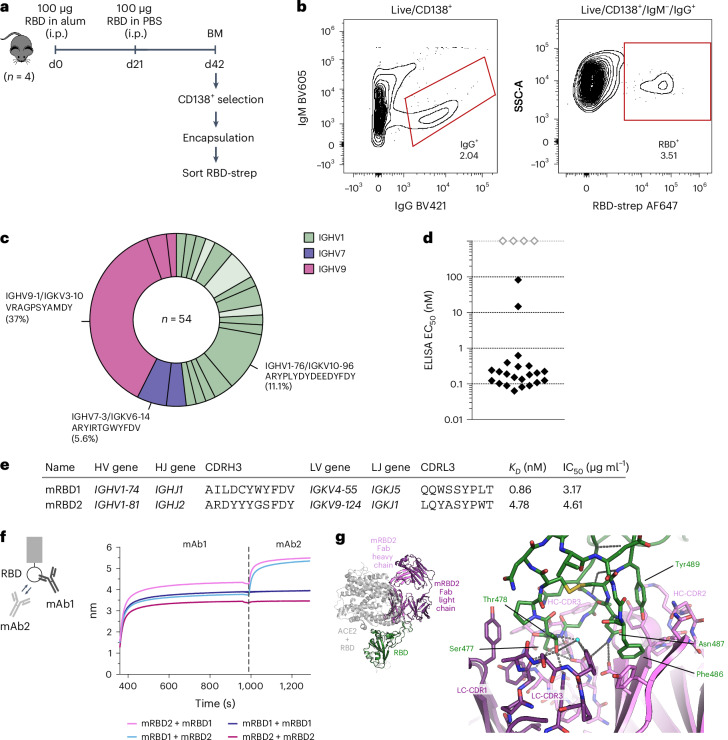
Monoclonal antibodies are increasingly used to prevent and treat viral infections and are pivotal in pandemic response efforts. Antibody-secreting cells (ASCs; plasma cells and plasmablasts) are an excellent source of high-affinity antibodies with therapeutic potential. Current methods to study antigen-specific ASCs either have low throughput, require expensive and labor-intensive screening or are technically demanding and therefore not widely accessible. Here we present a straightforward technology for the rapid discovery of monoclonal antibodies from ASCs. Our approach combines microfluidic encapsulation of single cells into an antibody capture hydrogel with antigen bait sorting by conventional flow cytometry. With our technology, we screened millions of mouse and human ASCs and obtained monoclonal antibodies against severe acute respiratory syndrome coronavirus 2 with high affinity (<1 pM) and neutralizing capacity (<100 ng ml-1) in 2 weeks with a high hit rate (>85% of characterized antibodies bound the target). By facilitating access to the underexplored ASC compartment, the approach enables efficient antibody discovery and immunological studies into the generation of protective antibodies.


Conflict of interest statement

Competing interests: C.M.D. discloses membership of the Scientific Advisory Board of Fusion Antibodies and AI proteins. All other authors declare no competing interests.

Figures

Fig. 1
Fig. 1. Workflow for high-throughput functional analysis of antibodies secreted by single cells.
a, Overview of the workflow—B cells (or enriched ASCs) are isolated from mice (bone marrow or spleen) or human PBMCs. Cells are mixed with liquid BG-agarose at 37 °C and encapsulated into picolitre water-in-oil emulsion droplets using a flow-focusing junction. Droplets are collected on ice for agarose gelation and demulsified, creating stable hydrogel beads around each cell. The BG-agarose is converted into an antibody capture matrix by the addition of recombinant capture reagents that are fused to the SNAP-tag, an enzyme that reacts with BG moieties. During incubation, antibodies secreted by a single cell are captured in the hydrogel surrounding the cell. Cells that have secreted antigen-specific antibodies are identified with fluorescently labeled detection reagents (antigens, secondary antibodies and antibodies against cell-surface markers), sorted using flow cytometry and sequenced. Antibody sequences can be obtained within 4 days, and recombinant antibodies for testing are generated in 2 weeks. b, Agarose-based antibody capture matrix. Agarose is chemically modified to contain BG moieties that react covalently with the SNAP-tag. Single-domain antibodies (VHHs) against the constant region of antibody light chains are expressed as SNAP-tag fusions and immobilized in the BG-agarose hydrogel, creating the capture matrix. c, Antibody capture by BG-agarose hydrogel beads functionalized with VHH–SNAP. Antibody capture (anti-streptavidin mouse IgG) and antigen binding (streptavidin–GFP) were analyzed by flow cytometry. The plot shows at least 220 events per condition at a 5% contour level. d, Antibody secretion by single OVA-specific mouse bone marrow plasma cells. Representative confocal microscopy image from two independent experiments showing a single cell encapsulated in VHH-functionalized BG-agarose stained with fluorescently labeled OVA (AF555), anti-CD138 antibodies (AF647) and anti-mouse IgG antibodies (AF405). e, Sorting of OVA-specific mouse bone marrow plasma cells. Hydrogel beads containing plasma cells that secreted OVA-specific IgG were sorted by FACS (gated as live/FLAG+/CD138+/IgM/IgG+). The plots show 10,168 (CD138+) and 411 (IgG+) events at 2% contour level. f, Characteristics of mouse anti-OVA antibodies—variable domain genes (V and J), third complementarity-determining region amino acid sequences (CDR3s) and equilibrium dissociation constants (KD).
Fig. 2
Fig. 2. Generation of mouse anti-SARS-CoV-2 RBD antibodies.
a, Mouse immunization and analysis scheme. Bone marrow plasma cells (CD138+) were magnetically enriched and then used in our workflow. RBD-specific plasma cells were sorted with fluorescently labeled RBD-streptavidin tetramers. b, Sorting of RBD-specific mouse plasma cells. Cells were gated as live/CD138+, and IgG-secreting RBD-specific plasma cells were sorted by FACS. The plots show 79,629 (CD138+) and 1,623 (IgG+) events at 2% contour level. c, Overview of antibody sequences of sorted plasma cells. In total, 54 paired heavy- and light-chain sequences were obtained. The pie chart shows the 21 observed HV and LV gene combinations (HV–LV). HV–LV pairings are colored by the HV gene. Combinations that were characterized are shown in darker shades, while combinations that were not expressed are shown in lighter shades. The three most expanded expressed HV–LV combinations are highlighted with their CDRH3 amino acid sequence and frequency. d, Summary of anti-RBD ELISA. The plot shows the EC50 with an antibody concentration range of 0.0002–400 nM. Antibodies that did not bind RBD at 400 nM are shown at an arbitrary EC50 of 1,000 nM (gray diamonds). e, Characteristics of mouse anti-SARS-CoV-2 RBD antibodies with neutralizing capacity—variable domain sequences (V and J genes), third complementarity-determining region amino acid sequences (CDR3), equilibrium dissociation constants (KD) and IC50 against WT SARS-CoV-2. f, In-tandem epitope binning experiment with mRBD1 and mRBD2. g, Crystal structure of mRBD2 with SARS-CoV-2 RBD (PDB: 8BE1). Top left, the RBD (green) in complex with mRBD2 Fab fragment (purple and pink for light and heavy chains) is superimposed with RBD complexed with ACE2 (gray; PDB: 6M0J), showing how the Fab fragment overlaps significantly with ACE2. The main figure shows details of the RBD loop (green carbon atoms) binding to the CDRs of the mRBD2 Fab fragment. Source data
Fig. 3
Fig. 3. Generation of human anti-SARS-CoV-2 RBD antibodies.
a, Human anti-RBD antibody discovery. B cells were negatively selected from fresh or frozen PBMCs 7–9 days after the second BNT162b2 vaccine dose and then used in the workflow. RBD-specific ASCs were sorted with fluorescently labeled RBD-streptavidin tetramers. b, Sorting of RBD-specific human ASCs. Representative layout for sorting of IgG+/RBD+ hydrogel beads obtained from the encapsulation of fresh B cells on d9 post vaccination. Hydrogel beads were gated as live/CD20/CD38+/IgM/IgG+. The plot shows 1,484 events at 2% contour level. c, Overview of sequences of human ASCs sorted with RBD. In total, 185 paired heavy- and light-chain sequences were obtained. The pie chart shows the observed HV–LV combination colored by the HV gene. HV–LV combinations that were expressed recombinantly are highlighted with their clone names and shown in a darker shade. d, Affinities (KD) of human anti-RBD antibodies. One antibody (gray diamond) did not show binding to RBD at the tested concentrations. e, Neutralization of WT and Omicron BA.1 SARS-CoV-2 by human anti-RBD antibodies. IC50 was calculated from experiments performed in duplicate. Antibodies with no quantifiable neutralizing capacity at the highest concentration tested (100 μg ml−1) are shown at an arbitrary IC50 of 1,000 μg ml−1 (gray diamonds). The ten antibodies with the lowest IC50 against WT SARS-CoV-2 were also tested against Omicron BA.1 SARS-CoV-2. Antibodies neutralizing both variants are highlighted in red with their clone names. Neutralization of WT SARS-CoV-2 by the REGEN-COV (Ronapreve) mAb cocktail (casirivimab and imdevimab) was tested in the same assay (blue diamond). f, Sandwich epitope binning experiment with pairs of neutralizing human anti-RBD antibodies. In the network plot, the nodes show the antibody clones, the connections indicate pairwise blocking and the shaded areas indicate whether the antibodies belong to the same clonotype. Colors indicate the VH gene as in c. Source data
Fig. 4
Fig. 4. Generation of human anti-SARS-CoV-2 S1 antibodies that do not bind the RBD.
a, Human anti-S1 antibody discovery. B cells were negatively selected from PBMCs 7 days after the second BNT162b2 vaccine dose and then used in the workflow. RBD/S1-specific ASCs were sorted with fluorescently labeled RBD- and S1-streptavidin tetramers. b, Index sorting of S1-specific human ASCs. Layout for sorting of IgG- or IgA-secreting ASCs isolated on day 7 post vaccination with fluorescently labeled S1- and RBD-streptavidin tetramers. Based on index sorting, the ratio of the S1/RBD fluorescence signal was calculated for all sequenced cells, and four sequences that corresponded to events with the highest S1/RBD fluorescence signal ratio were selected for expression (highlighted as red squares). The plot shows 719 events at a 5% contour level, and the percentage of events in each window is indicated. c, Characteristics of human anti-S1 antibodies—variable domain genes (V and J), third complementarity-determining region amino acid sequences (CDR3), equilibrium dissociation constants (KD) and IC50 against WT SARS-CoV-2. En dashes (–) denote that binding or inhibition was not quantifiable at the tested concentrations. d, Anti-S1 and anti-RBD ELISA of anti-S1 antibodies. An RBD-binding positive control (human IgG1κ, clone AM001414; BioLegend) is shown in black, and an isotype control (human IgG1κ, clone QA16A12; BioLegend) is shown in gray. The table shows the EC50 with an antibody concentration range of 0.0002–400 nM. The plots show mean values ± s.d. of two independent experiments performed in duplicate. Source data
Extended Data Fig. 1
Extended Data Fig. 1. Synthesis and characterization of benzylguanine (BG)-agarose.
(a) Synthesis of BG-agarose. (b) Assessment of 1.5% (wt/vol) BG-agarose capture valency. BG-agarose beads were incubated with different amounts of GFP-SNAP, and the GFP fluorescence of the beads was analyzed by flow cytometry. The fluorescence signal saturates between 1.3 and 2.7 × 109 GFP molecules/bead. Data are represented as mean values ± SD, and at least 18,827 beads were analyzed per condition (unpaired t-test, two-sided p < 0.0001). Data from one independent experiment is shown. Source data
Extended Data Fig. 2
Extended Data Fig. 2. Requirements for capture/detection of secreted proteins and characterization of anti-light chain VHHs for antibody capture.
(a) Capture matrix requirements for secreted proteins: epitopes of capture reagent (for example, VHH), detection reagent (for example, fluorescently labeled anti-IgG antibody) and antigen should not overlap. VHHs bind to the light-chain constant region, enabling simultaneous binding to the antigen binding site of VH/VL. To avoid interfering with antibody capture, the detection antibody should bind to the constant region of the heavy chain, preferably the Fc part (CH2/CH3). Binding affinities should be in the low nM to pM range. (b) Determination of binding affinity of anti-mouse κ VHH against recombinant mouse IgG1κ antibody by biolayer interferometry with antibody as ligand and VHH as analyte: KD = 0.0167 ± 0.001 nM, χ2 = 0.1417, R2 = 0.9991. Tested VHH concentrations: 0.16–4.4 nM. (c) Determination of binding affinity of anti-human λ VHH against recombinant human IgG1λ antibody by biolayer interferometry with antibody as ligand and VHH as analyte: KD = 1.35 ± 0.004 nM, χ2 = 0.7345, R2 = 0.9967. Tested VHH concentrations: 0.49–40 nM. (d) Association rates (kon), dissociation rates (koff) and affinities (KD) of VHHs showcasing the benefit of multivalent binding. Values for the anti-human κ VHH have been determined previously by biolayer interferometry for the monovalent (VHH as ligand and Fab as analyte) and bivalent (VHH as ligand and IgG as analyte) interaction and are denoted by an asterisk (*). (e) Biolayer interferometry assay to determine epitope overlap of capture and detection reagents. Binding of anti-mouse κ VHH, anti-mouse IgG1 and RBD antigen to a recombinant mouse anti-RBD antibody. Data of VHH binding followed by RBD binding is shown in blue, while the reverse order of binding is shown in purple. (f) Biolayer interferometry assay to determine epitope overlap of capture and detection reagents. Binding of anti-human κ or λ VHHs, anti-human IgG Fc and RBD antigen to recombinant human anti-RBD antibodies. Data of VHH binding followed by RBD binding are shown in blue, while the reverse order of binding is shown in purple.
Extended Data Fig. 3
Extended Data Fig. 3. Cell survival and IgG secretion of encapsulated mouse bone marrow plasma cells over time.
(a) Cell viability of encapsulated and non-encapsulated cells after incubation in culture medium for different time periods. Viability was analyzed by flow cytometry (gated on single cells or single beads/CD138+/live; gating strategy in Supplementary Fig. 2). (b) Detection of IgG in the culture supernatant of encapsulated (red) and nonencapsulated cells (dark gray) by ELISA at different time points. The dashed line indicates the sensitivity of the assay (absorbance corresponding to 1.56 ng/mL IgG). The solid lines denote the mean of two technical replicates. (c) IgG1 secretion of encapsulated and non-encapsulated cells over time was analyzed by flow cytometry. To determine the extent of cross-contamination between beads, the IgG1 signal of plasma cells (CD138+) was compared to the signal of empty beads or cells that lack the plasma cell marker (CD138; gating strategy in Supplementary Fig. 3). The numbers in the top right corner indicate the percentage of IgG+ events in the CD138+ (red) and CD138 (blue) populations (IgG+ gate indicated by a gray line). The number in the bottom right corner indicates the percentage of ‘true positives’ (percentage of IgG+ events originating from CD138+ based on the sum of IgG+ events from both CD138+ and CD138 populations). The plots show a minimum of 10,019 (CD138) and 2,533 (CD138+) events at 2% contour level. (d) Time course of ASC IgG secretion and background based on c. Left axis: percentage of IgG1-positive events in the CD138+ (red diamonds) and CD138 (blue diamonds) populations for each analyzed time point. Right axis (gray diamonds): percentage of events in the IgG1 gate that originate from CD138+ and not from CD138. Source data
Extended Data Fig. 4
Extended Data Fig. 4. Generation of anti-OVA antibodies from encapsulated mouse bone marrow plasma cells and analysis of confocal images.
(a) Analysis of confocal microscopy image of an encapsulated OVA-specific bone marrow plasma cell showing the spatial distribution of CD138 (AF647), IgG (AF405) and OVA (AF555) within the VHH-functionalized BG-agarose bead. The graphs display the pixel intensity along the red line from left to right. IgG and OVA signal intensity decrease as a function of distance from the encapsulated cell. A representative image of over 40 images obtained from two biological replicates is shown. Additional confocal images can be found in Supplementary Fig. 4. (b) Comparison of the IgG signal distribution of a hydrogel bead containing a cell with a neighboring empty bead. The cross-section for analysis is indicated by a red line. A representative image from two biological replicates is shown. Additional confocal images can be found in Supplementary Fig. 4. (c) Mouse immunization and analysis scheme. Bone marrow plasma cells (CD138+) were magnetically enriched. Cells were encapsulated into VHH-functionalized BG-agarose. OVA-specific plasma cells were sorted with fluorescently labeled monomeric OVA (OVA-AF647). (d) Comparison of IgG signal originating from plasma cells in BG-agarose beads incubated with (+VHH) or without VHH–SNAP–FLAG (−VHH; different experiment than shown in Fig. 1). The plots show 527 (−VHH) and 1,280 (+VHH) events at 2% contour level. (e) Representative gating strategy for identifying OVA-specific plasma cells from bone marrow. Live plasma cells inside hydrogel beads were gated as live/FLAG+/CD138+ (VHH–SNAP contains a FLAG tag). (f) Determination of binding affinity of mOVA1 and mOVA2 by biolayer interferometry: mOVA1: KD = 2.36 ± 0.02 nM, χ2 = 0.0705, R2 = 0.985. mOVA2: KD = 0.684 ± 0.004 nM, χ2 = 0.0388, R2 = 0.9919. Tested OVA concentrations: 1.02–16 nM.
Extended Data Fig. 5
Extended Data Fig. 5. Workflow with spleen-derived ASCs.
(a) Mouse immunization and analysis scheme. (b) Comparison of IgG signal originating from ASCs in BG-agarose beads incubated with (+VHH) or without VHH–SNAP–FLAG (−VHH; different experiment than shown in c). The plots show 3,663 (−VHH) and 2,290 (+VHH) events at 2% contour level. (c) Representative gating strategy for identifying OVA-specific ASCs from spleen. Live ASCs inside hydrogel beads were gated as live/FLAG+/CD138+ (VHH–SNAP contains a FLAG tag).
Extended Data Fig. 6
Extended Data Fig. 6. Sorting of mouse RBD-specific plasma cells and characterization of anti-RBD antibodies.
(a) Comparison of IgG signal originating from plasma cells in BG-agarose beads incubated with (+VHH) or without VHH–SNAP (−VHH; different experiment than shown in Fig. 2). The plots show 2,536 (−VHH) and 14,606 (+VHH) events at 2% contour level. (b) Representative gating strategy for identifying RBD-specific plasma cells from mouse bone marrow (gated as live/CD138+/IgM/IgG+/RBD+). (c) Anti-RBD ELISA. Workflow-derived antibodies are shown in black (binders) or blue (non-binders), a commercial positive control (clone 1035753, R&D Systems) is shown in red and an isotype control (mouse IgG1k, clone MG1-45; BioLegend) is shown in gray. The plot shows the mean of two technical replicates, representative of two independent experiments. (d) Neutralization of SARS-CoV-2 by mRBD1 and mRBD2. Wild-type SARS-CoV-2 (MOI = 0.01) was pre-incubated with a 3-fold dilution series of each antibody and then used to infect luminescent reporter cells. Levels of infection after 24 h were quantified as % of maximum luminescence. Mean values ± SD of three technical replicates are shown, representative of three independent experiments. IC50, half-maximal inhibitory concentration. (e) Determination of binding affinity of mRBD1 and mRBD2 by biolayer interferometry: mRBD1: KD = 0.864 ± 0.07 nM, χ2 = 0.0547, R2 = 0.991. mRBD2: KD = 4.78 ± 0.04 nM, χ2 = 0.1111, R2 = 0.9928. Source data
Extended Data Fig. 7
Extended Data Fig. 7. Stimulation of normal human PBMCs into ASCs and analysis of antibody secretion by flow cytometry and microscopy.
(a) Stimulation conditions and workflow for proof-of-concept in normal PBMCs. To obtain ASCs from normal PBMCs, B cells were stimulated with CD40L, IL-21 and anti-IgM antibodies. (b) IgG secretion of stimulated PBMCs encapsulated into hydrogel beads. The plot shows 66,173 events at a contour level of 2%; the gating strategy is shown in d. (c) Analysis of encapsulated stimulated PBMCs by epifluorescence microscopy. Hydrogel beads were stained with fluorescently labeled anti-CD38 (APC) and anti-human IgG antibodies (PE). The hydrogel bead boundary is shown as a dotted line. A representative image from one independent experiment is shown. (d) Gating strategy for identifying IgG-secreting human ASCs from stimulated B cells. ASCs were gated as DAPI/CD14/CD3/IgD/FLAG+/CD19+/CD20/CD27+/CD38+ (VHH–SNAP contains a FLAG tag).
Extended Data Fig. 8
Extended Data Fig. 8. Sorting of SARS-CoV-2 RBD-specific human ASCs.
(a) Comparison of IgG signal originating from cryopreserved ASCs on d7 post vaccination in BG-agarose beads incubated with (+VHH) or without VHH–SNAP (−VHH; different experiment than shown in Fig. 3). The plots show 1,139 (−VHH) and 1,289 (+VHH) events at 2% contour level. (b) Comparison of RBD-specific signal of cryopreserved ASCs on d7 post vaccination in BG-agarose beads incubated with (+VHH, secreted antibodies) or without VHH–SNAP (−VHH, surface antibodies). The plots show 1,139 (−VHH) and 1,289 (+VHH) events at 2% contour level. (c) Representative gating strategy for identifying RBD-specific human ASCs (gated as live/CD20/CD38+/IgM/IgG+/RBD+) and comparison of fresh and cryopreserved samples (day 8 post vaccination). Cells in hydrogels could be easily identified by forward and side scatter; therefore, the gating is different compared to other experiments.
Extended Data Fig. 9
Extended Data Fig. 9. Sorting of SARS-CoV-2 S1-specific human ASCs.
(a) Comparison of IgG signal originating from ASCs in BG-agarose beads incubated with (+VHH) or without VHH–SNAP (−VHH). The plots show 823 (−VHH) and 6,870 (+VHH) events at 2% contour level. (b) Representative gating strategy for identifying S1/RBD-specific human ASCs. (c) Neutralization of SARS-CoV-2 by hS1-1. Wild-type SARS-CoV-2 (MOI = 0.01) was pre-incubated with a 3-fold dilution series of hS1-1 and then used to infect luminescent reporter cells. Levels of infection after 24 h were quantified as % of maximum luminescence. Mean values of two technical replicates are shown, representative of two independent experiments. IC50, half-maximal inhibitory concentration. Source data
Extended Data Fig. 10
Extended Data Fig. 10. Comparison of human anti-SARS-CoV-2 RBD antibodies isolated in this work with antibodies isolated by LIBRA-seq.
(a) Comparison of affinities (KD). All characterized RBD binders were included in the comparison. For antibodies isolated in this work, the same KD values are depicted in Fig. 3d. Antibody affinity measurements by BLI were performed once but using at least four different analyte concentrations. For antibodies isolated by LIBRA-seq, previously reported values are shown. Horizontal lines denote the median. (b) Comparison of neutralizing capacities. Only antibodies tested against authentic SARS-CoV-2 were included in the comparison. For antibodies isolated in this work, the same IC50 is depicted in Fig. 3e. Mean values of two technical replicates are shown. For antibodies isolated by LIBRA-seq, previously reported values are shown. Different neutralization assays were used in the two studies. Source data

References

    1. Crowe, J. E. Human antibodies for viral infections. Annu. Rev. Immunol.40, 349–386 (2022). - PubMed
    1. Pantaleo, G., Correia, B., Fenwick, C., Joo, V. S. & Perez, L. Antibodies to combat viral infections: development strategies and progress. Nat. Rev. Drug Discov.21, 676–696 (2022). - PMC - PubMed
    1. Pedrioli, A. & Oxenius, A. Single B cell technologies for monoclonal antibody discovery. Trends Immunol.42, 1143–1158 (2021). - PubMed
    1. Hansen, J. et al. Studies in humanized mice and convalescent humans yield a SARS-CoV-2 antibody cocktail. Science369, 1010–1014 (2020). - PMC - PubMed
    1. Corti, D. et al. Protective monotherapy against lethal Ebola virus infection by a potently neutralizing antibody. Science351, 1339–1342 (2016). - PubMed

LinkOut - more resources