Comparative Study
. 2024 Aug 14;25(1):266.
doi: 10.1186/s12859-024-05883-7.

A comparative analysis of mutual information methods for pairwise relationship detection in metagenomic data

Affiliations
Comparative Study

A comparative analysis of mutual information methods for pairwise relationship detection in metagenomic data

Dallace Francis et al. BMC Bioinformatics. .

Abstract

Background: Construction of co-occurrence networks in metagenomic data often employs correlation to infer pairwise relationships between microbes. However, biological systems are complex and often display qualities non-linear in nature. Therefore, the reliance on correlation alone may overlook important relationships and fail to capture the full breadth of intricacies presented in underlying interaction networks. It is of interest to incorporate metrics that are not only robust in detecting linear relationships, but non-linear ones as well.

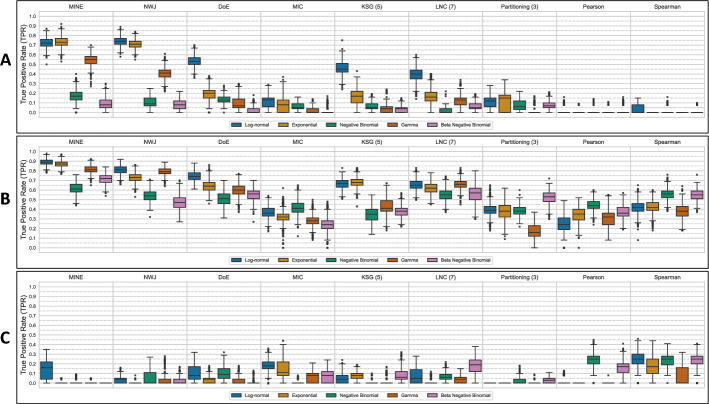
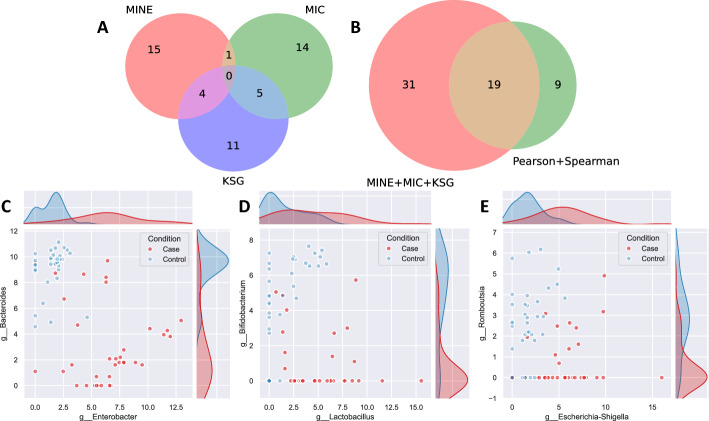
Results: In this paper, we explore the use of various mutual information (MI) estimation approaches for quantifying pairwise relationships in biological data and compare their performances against two traditional measures-Pearson's correlation coefficient, r, and Spearman's rank correlation coefficient, ρ. Metrics are tested on both simulated data designed to mimic pairwise relationships that may be found in ecological systems and real data from a previous study on C. diff infection. The results demonstrate that, in the case of asymmetric relationships, mutual information estimators can provide better detection ability than Pearson's or Spearman's correlation coefficients. Specifically, we find that these estimators have elevated performances in the detection of exploitative relationships, demonstrating the potential benefit of including them in future metagenomic studies.

Conclusions: Mutual information (MI) can uncover complex pairwise relationships in biological data that may be missed by traditional measures of association. The inclusion of such relationships when constructing co-occurrence networks can result in a more comprehensive analysis than the use of correlation alone.

Keywords: Asymmetrical relationships; Co-occurrence networks; Mutual information; Non-linear relationships.


Conflict of interest statement

The authors declare no competing interests.

Figures

Fig. 1
Fig. 1
Illustrative examples of the asymmetric ecological relationships explored in this study
Fig. 2
Fig. 2
The true positive rate (TPR) of different methods for detecting (A) exploitative, (B) commensal, and (C) amensal relationships based on different prior distributions. Results for log-normal, exponential, negative binomial, gamma, and beta negative binomial distributed data are distinguished by blue, light orange, green, dark orange, and pink boxplots respectively. TPR values are collected from 1,000 bootstrapped samples of true and null pairwise interactions. Results are separated on the x-axis by method. Boxplots were constructed using results from 1,000 bootstrapped iterations where the TPR was calculated after randomly sampling (with replacement) 100 true positive pairwise relationships and 100 null relationships. Results are shown for data that was TMM normalized and p-values that were corrected using the Benjamini–Hochberg procedure
Fig. 3
Fig. 3
Effects of normalization and distribution for each method on (A) TPR and (B) FDR for exploitative relationships. Generally, normalization does not impact results as much as data distribution. Two of the machine learning methods (MINE and NWJ) are exceptions to this, as restricting their input to TSS normalized data renders them uninformative
Fig. 4
Fig. 4
True positive rates (TPRs) for varying significance thresholds using the Benjamini–Hochberg procedure (blue), Bonferroni (orange), empirical q-values (green), and parametric q-values (red). Both empirical and parametric q-value approaches produce a higher TPR for the same significance threshold than the Benjamini–Hochberg procedure
Fig. 5
Fig. 5
Respective false discovery rates for the data presented in Fig. 4. Both empirical (green) and parametric (dark orange) q-value approaches usually result in a slight increase in FDR for the same significance threshold than the Benjamini–Hochberg procedure (blue). The shaded blue regions in each plot correspond to FDR values at or below each significance threshold
Fig. 6
Fig. 6
Venn diagrams detailing overlap of significant relationships found in the CDI dataset (A) between MI estimators and (B) between MI estimators and correlation measures for the case group. Only the top 20 most significant pairs of each metric are used in the construction of each diagram. (C, D, E) Scatter plots and accompanying density estimations for various relationships found by MI estimators. In each case, there is evidence of an exploitative interaction type, supported by the simultaneous shift of one genus to larger abundances (Enterobacter, Lactobacillus, Escherichia-Shigella) and the other to smaller abundances (Bacteroides, Bifidobacterium, Romboutsia) when comparing controls (blue) to cases (red). Abundance data is plotted after a logx+1 transform
Fig. 7
Fig. 7
A Flowchart of the data simulation technique. (1) A d×d target covariance matrix σ with diagonal elements equal to one and off-diagonal elements equal to zero is generated. (2) Using the target covariance matrix, n d-dimensional multivariate normal vectors with mean zero and covariance matrix σ are drawn resulting in an n×d matrix. (3) Their values transformed into quantiles using the standard normal cumulative distribution function. (4) One of five marginal distributions are imparted on each of the d columns by applying the chosen distribution’s inverse cumulative distribution function. (5) Various interaction relationships (exploitative, commensal, and amensal) are introduced between random pairs of columns (representing microbes), producing a final table that simulates an ecological environment in the context of this study. B Description of each marginal distribution used in this study. The parameters of each distribution were randomly selected from ranges that resulted in each distribution having a comparable mean, μ, and standard deviation, σ

References

    1. Robertson RC, Manges AR, Finlay BB, Prendergast AJ. The human microbiome and child growth–first 1000 days and beyond. Trends Microbiol. 2019;27(2):131–47. 10.1016/j.tim.2018.09.008 - DOI - PubMed
    1. Mohammadkhah AI, Simpson EB, Patterson SG, Ferguson JF. Development of the gut microbiome in children, and lifetime implications for obesity and cardiometabolic disease. Children. 2018;5(12):160. 10.3390/children5120160 - DOI - PMC - PubMed
    1. Sekirov I, Finlay BB. The role of the intestinal microbiota in enteric infection: intestinal microbiota and enteric infections. J Physiol. 2009;587(17):4159–67. 10.1113/jphysiol.2009.172742 - DOI - PMC - PubMed
    1. Coyte KZ, Schluter J, Foster KR. The ecology of the microbiome: Networks, competition, and stability. Science. 2015;350(6261):663–6. 10.1126/science.aad2602 - DOI - PubMed
    1. Jandhyala SM. Role of the normal gut microbiota. WJG. 2015;21(29):8787. 10.3748/wjg.v21.i29.8787 - DOI - PMC - PubMed

Publication types

LinkOut - more resources