. 2024 Aug 14;17(1):67.
doi: 10.1186/s13045-024-01586-x.

IL1RAP-specific T cell engager depletes acute myeloid leukemia stem cells

Affiliations

IL1RAP-specific T cell engager depletes acute myeloid leukemia stem cells

Yi Zhang et al. J Hematol Oncol. .

Abstract

Background: The interleukin-1 receptor accessory protein (IL1RAP) is highly expressed on acute myeloid leukemia (AML) bulk blasts and leukemic stem cells (LSCs), but not on normal hematopoietic stem cells (HSCs), providing an opportunity to target and eliminate the disease, while sparing normal hematopoiesis. Herein, we report the activity of BIF002, a novel anti-IL1RAP/CD3 T cell engager (TCE) in AML.

Methods: Antibodies to IL1RAP were isolated from CD138+ B cells collected from the immunized mice by optoelectric positioning and single cell sequencing. Individual mouse monoclonal antibodies (mAbs) were produced and characterized, from which we generated BIF002, an anti-human IL1RAP/CD3 TCE using Fab arm exchange. Mutations in human IgG1 Fc were introduced to reduce FcγR binding. The antileukemic activity of BIF002 was characterized in vitro and in vivo using multiple cell lines and patient derived AML samples.

Results: IL1RAP was found to be highly expressed on most human AML cell lines and primary blasts, including CD34+ LSC-enriched subpopulation from patients with both de novo and relapsed/refractory (R/R) leukemia, but not on normal HSCs. In co-culture of T cells from healthy donors and IL1RAPhigh AML cell lines and primary blasts, BIF002 induced dose- and effector-to-target (E:T) ratio-dependent T cell activation and leukemic cell lysis at subnanomolar concentrations. BIF002 administered intravenously along with human T cells led to depletion of leukemic cells, and significantly prolonged survival of IL1RAPhigh MOLM13 or AML patient-derived xenografts with no off-target side effects, compared to controls. Of note, BiF002 effectively redirects T cells to eliminate LSCs, as evidenced by the absence of disease initiation in secondary recipients of bone marrow (BM) from BIF002+T cells-treated donors (median survival not reached; all survived > 200 days) compared with recipients of BM from vehicle- (median survival: 26 days; p = 0.0004) or isotype control antibody+T cells-treated donors (26 days; p = 0.0002).

Conclusions: The novel anti-IL1RAP/CD3 TCE, BIF002, eradicates LSCs and significantly prolongs survival of AML xenografts, representing a promising, novel treatment for AML.

Keywords: Acute myeloid leukemia; IL1RAP; Immunotherapy; Leukemic stem cells; T cell engager.


Conflict of interest statement

Aspects of this work are described and claimed in a pending patent application.

Figures

Fig. 1
Fig. 1
IL1RAP expression on the cell surface of AML cell lines and primary AML blasts. A Representative histogram plots (left) and combined results (right, n = 3 independent experiments) of IL1RAP expression on AML cell lines analyzed by FCM. B IL1RAP expression on primary AML bulk blasts (n = 21) and AML CD34+ cells (n = 14), and normal (NL) CD34+ cells (n = 15), analyzed by FCM. C Paired comparison of IL1RAP expression on bulk and CD34+ blasts in individual AML patients (n = 14) by FCM. D Percentages of IL1RAP + , CD33 + , CD123 + , and CLL-1 + cells in AML CD34+ blasts by FCM (n = 12). E Percentages of cells expressing IL1RAP, CD33, CD123, and CLL-1 relative to the control cells stained with isotype control antibody, in normal healthy donor CD34+ hematopoietic stem cells (HSCs) analyzed by FCM (n = 7). B, and DE were analyzed by one-way ANOVA with Tukey or Dunnett multiple comparisons tests respectively, and C was analyzed by paired Student’s t-test. NL, normal; NS, not significant
Fig. 2
Fig. 2
Characterization of anti-IL1RAP-24 monoclonal antibody (mAb) and production of anti-IL1RAP/CD3 bispecific T cell engager (TCE). A Size exclusion chromatography (SEC, left) and SDS-PAGE (right) of anti-IL1RAP-24 mAb. B Target affinity assay of anti-IL1RAP-24 mAb binding to IL1RAP by surface plasmon resonance (SPR). C Flow cytometry (FCM) analysis of binding capacity of anti-IL1RAP-24 Fab vs. isotype control antibody to IL1RAPpos MV4-11 and MOLM13. D Schematic description of anti-IL1RAP/CD3 bispecific TCEs including BIF002, BIF018 and BIF026, created by Biorender.com. E Ion exchange chromatography (IEC) of anti-IL1RAP/CD3 bispecific TCE (BIF002) along with parental antibodies. F SPR sensorgrams of TCEs, i.e., BIF002, BIF018 and BIF026, binding to CD3, IL1RAP and Fc receptor (CD16a), respectively. G FCM analysis of binding capacity of anti-IL1RAP or anti-CD3 commercial mAbs, anti-IL1RAP-24 mAb, and TCEs including BIF002, BIF018 and BIF026, to IL1RAPhigh AML cells and CD3+ T and Jurkat cells
Fig. 3
Fig. 3
Dose-and effector-to-target (E:T) ratio-dependent activity of BIF002. A Cell lysis of MOLM13 and THP-1 at different E:T ratios and various concentrations of BIF002 at 48 h (normalized to no Ab ctrl at same E:T ratio; n = 3). The experiment was repeated with another T cell donor, and similar results were obtained. B Real-time counts of GFP + target AML cells from co-cultures with BIF002 (0.1—100 nM) and T cells (E:T ratio 5:1) (upper), and representative real time fluorescence plots of GFP + THP-1 lysis by BIF002 at E:T ratio 5:1 (lower), recorded by Agilent xCELLigence (technical duplicate). The experiment was repeated with another T cell donor, and similar results were obtained. Cell index was normalized to GFP + cell counts at 3 h of the same well. C Viability changes (left; n = 3) and combined IC50 results (right; n = 3 independent T cell donors) of AML cell lines treated with BIF002 and T cells at E:T ratio 5:1 at 48 h. The experiment was repeated with two other T cell donors, and similar results were obtained. DE Viability changes of primary AML bulk blasts (D; n = 3) and AML CD34+ blasts (E; n = 3) treated with BIF002 and T cells at E:T ratio 5:1 at 48 h. F Cell lysis of AML CD34+ blasts (n = 3) treated with healthy donor T cells and BIF002, or BIF016, or BIF026 at E:T ratio 5:1 at 48 h. G Cell lysis of AML cell lines treated with healthy donor PBMC and BIF002, or BIF016, or BIF026 at E:T ratio 5:1 at 48 h (n = 3). The experiment was repeated with another T cell donor, and similar results were obtained. H Combined results (left; n = 5 samples) and representative plots (right) of apoptotic cells in primary AML blasts treated with healthy donor T cells and BIF002 or BIF026 control at E:T ratio of 5:1 at 48 h. I Viability of normal (NL) CD34+ bone marrow cells treated with healthy donor T cells and BIF002 at E:T ratio 5:1 at 48 h (n = 3). J Normal CD34+ cells were treated with T cells and BIF002 or BIF026 (30 nM) or vehicle at E:T ratio 5:1 for 24 h and then cultured for colony-forming cell (CFC) assay. Representative colonies (left) and quantification (right; n = 3) of CFCs on Day 14 normalized to vehicle were shown. The experiment was repeated with another T cell donor, and similar results were obtained. Except for a various E:T ratio in A and the use of PBMC as effector cells in G, the effector cells for the others are healthy donor T cells with an E:T ratio of 5:1. Cell death was evaluated by 7-amino actinomycin D (7-AAD+) labeling. Apoptotic cells were evaluated by 7-amino actinomycin D (7-AAD+) or Annexin V (+) labeling. AML lysis was determined by the following formula: % Lysis = 100 − (viable cells of treatment group × 100/viable cells of untreated control group)
Fig. 4
Fig. 4
BIF002 induces IL1RAP dose-dependent T cell activation, cytokine release and T cell proliferation. A T cell activation, assessed by CD69 and CD25 expression levels analyzed by FCM, after co-culture with AML cell lines (top; vehicle-treated MOLM13 as control; n = 3 independent T cell donors) or primary AML blasts with different IL1RAP expression levels (bottom; vehicle-treated AML-2 as control; n = 3) at E:T ratio 5:1 for 48 h assessed by CD69 and CD25 expression levels. B BIF002 dose-dependent T cell activation after co-culture with AML cell lines (top; n = 3 independent T cell donors) or primary AML blasts with different IL1RAP expression levels (bottom; n = 3) at E:T ratio 5:1 for 48 h, assessed by CD69 and CD25 expression levels analyzed by FCM. IFN- γ (C) and TNF-α (D) release test in T cells co-cultured with AML cell lines and blasts and treated with BIF002 for 48 h, analyzed by ELISA (technical duplicate). The experiment was repeated with another donor, and similar results were obtained. E T cells were stained with CellTrace violet prior to co-culture with AML cell lines and BIF002 1 nM at E:T ratio 2:1 or 5:1 for 5 days. Representative plots of violet peaks representing successive generations of T cells (upper), and proliferation indexes (lower) of T cells after 5 days of co-culture (technical duplicate). Each successively dimer peak represents one cell division. Division Index is the average number of cell divisions by the original population that includes the undivided peak. Proliferation Index is the total number of divisions divided by the number of cells that went into division. All calculated by Flowjo. The data were analyzed by one-way ANOVA. AML cell lines were compared to KG1a which causes low T cell proliferation in the co-culture system. Additionally, no T cell proliferation was observed when co-cultured with K562, indicating a clear difference compared to other AML cell lines. F T cells were stained with CellTrace violet prior to co-culture with AML blasts and BIF002 at E:T ratio 2:1 for 5 days. Representative plots of violet peaks representing successive generations of T cells. Significance values: **p < 0.01; ***p < 0.001; ****p < 0.0001
Fig. 5
Fig. 5
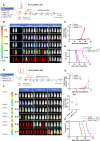
In vivo efficacy and dose finding of BIF002 in AML mice models. A Schematic experimental design. Luciferase-expressing MOLM13 were transplanted into NSGS mice that were treated with: vehicle alone (n = 2) or T cells alone or with 0.1 µg or 1 µg BIF002 (n = 5 mice per group). B Tumor burden assessed using bioluminescent imaging of MOLM13-engrafted mice. C Quantitation of total bioluminescent signal (Total Emission) in each group at indicated times post-injection for MOLM13 model. D Log-rank (Mantel-Cox) test of cumulative survival rates for MOLM13-engrafted mice. E Schematic experimental design. Luciferase-expressing AML patient cells were transplanted into NSGS mice (PDX model). These mice were treated with: T cells alone or with 1 µg or 10 µg BIF002 (n = 5 mice per group). F Tumor burden assessed using bioluminescent imaging of PDX mice. G Quantitation of total bioluminescent signal of PDX mice. H Log-rank (Mantel-Cox) test of cumulative survival rates for PDX model. C and H were analyzed by two-way ANOVA with Tukey multiple comparisons tests. Significance values: *p < 0.05; **p < 0.01; ***p < 0.001; ****p < 0.0001
Fig. 6
Fig. 6
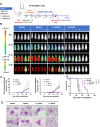
In vivo efficacy of BIF002 in the luciferase-expressing AML PDX Model. A Schematic experimental design. Luciferase-expressing AML patient cells were transplanted into NSGS mice that were then treated with: 10 µg control Ab BIF026, 10 µg BIF002, T cells + 10 µg BIF026, or T cells + 10 µg BIF002 (n = 5–7 mice per group). B Tumor burden assessed using bioluminescent imaging. C Quantitation of total bioluminescent signal (Total Emission) in each group at indicated times post-injection. D Log-rank (Mantel-Cox) test of cumulative survival rates. E Representative Wright-Giemsa stain of peripheral blood by microscope (n = 2, 1000X magnification). Significance values: *p < 0.05; **p < 0.01; ***p < 0.001; ****p < 0.0001
Fig. 7
Fig. 7
In vivo efficacy of BIF002 in the AML PDX Model with second transplantation. A Schematic experimental design. Blasts from a relapsed AML patient were transplanted into NSGS mice that were then treated with: vehicle, T cells + 10 µg control BIF026, or T cells + 10 µg BIF002 (n = 10 mice per group). On Day 34, BMMNCs were harvested from 3 mice/group and transplanted into NSGS recipient mice (n = 7/group) without further treatment. B Blasts and human T cell populations at Day 28 (upper) and at Day 70 (lower) by flow cytometry (FCM). C Representative Flow plots of blasts and T cells at Day 28 (n = 2). D Log-rank (Mantel-Cox) test of cumulative survival rates on first transplantation (n = 7). E Spleen size and weight of different groups. F Blasts and human T cell populations in bone marrow, peripheral blood, and spleen at the time for the second transplantation by FCM (n = 3). G Wright-Giemsa stain of peripheral blood by microscope (n = 3, 1000X magnification). H Blasts and human T cell populations at Day 21 in second transplantation mice peripheral blood by FCM. I Log-rank (Mantel-Cox) test of cumulative survival rates on the second transplantation (n = 7). B (left), E and H were analyzed by one-way ANOVA with Tukey multiple comparisons tests, F were analyzed by two-way ANOVA with Tukey multiple comparisons tests, and B(right) were analyzed by unpaired Student’s t test. Significance values: *p < 0.05; **p < 0.01; ***p < 0.001; ****p < 0.0001

References

    1. DiNardo CD, Erba HP, Freeman SD, Wei AH. Acute myeloid leukaemia. Lancet. 2023;401(10393):2073–86. 10.1016/S0140-6736(23)00108-3 - DOI - PubMed
    1. Shimony S, Stahl M, Stone RM. Acute myeloid leukemia: 2023 update on diagnosis, risk-stratification, and management. Am J Hematol. 2023;98(3):502–26. 10.1002/ajh.26822 - DOI - PubMed
    1. Liu H. Emerging agents and regimens for AML. J Hematol Oncol. 2021;14(1):49. 10.1186/s13045-021-01062-w - DOI - PMC - PubMed
    1. Kantarjian HM, Kadia TM, DiNardo CD, Welch MA, Ravandi F. Acute myeloid leukemia: treatment and research outlook for 2021 and the MD Anderson approach. Cancer. 2021;127(8):1186–207. 10.1002/cncr.33477 - DOI - PubMed
    1. Stelmach P, Trumpp A. Leukemic stem cells and therapy resistance in acute myeloid leukemia. Haematologica. 2023;108(2):353–66. 10.3324/haematol.2022.280800 - DOI - PMC - PubMed

Publication types

MeSH terms

Substances

LinkOut - more resources