. 2024 Aug 14;22(1):770.
doi: 10.1186/s12967-024-05573-1.

Sciatic nerve stimulation alleviates neuropathic pain and associated neuroinflammation in the dorsal root ganglia in a rodent model

Affiliations

Sciatic nerve stimulation alleviates neuropathic pain and associated neuroinflammation in the dorsal root ganglia in a rodent model

Chia-En Wong et al. J Transl Med. .

Abstract

Background: Satellite glial cells (SGCs) in the dorsal root ganglia (DRG) play a pivotal role in the formation of neuropathic pain (NP). Sciatic nerve stimulation (SNS) neuromodulation was reported to alleviate NP and reduce neuroinflammation. However, the mechanisms underlying SNS in the DRG remain unclear. This study aimed to elucidate the mechanism of electric stimulation in reducing NP, focusing on the DRG.

Methods: L5 nerve root ligation (NRL) NP rat model was studied. Ipsilateral SNS performed 1 day after NRL. Behavioral tests were performed to assess pain phenotypes. NanoString Ncounter technology was used to explore the differentially expressed genes and cellular pathways. Activated SGCs were characterized in vivo and in vitro. The histochemical alterations of SGCs, macrophages, and neurons in DRG were examined in vivo on post-injury day 8.

Results: NRL induced NP behaviors including decreased pain threshold and latency on von Frey and Hargreaves tests. We found that following nerve injury, SGCs were hyperactivated, neurotoxic and had increased expression of NP-related ion channels including TRPA1, Cx43, and SGC-neuron gap junctions. Mechanistically, nerve injury induced reciprocal activation of SGCs and M1 macrophages via cytokines including IL-6, CCL3, and TNF-α mediated by the HIF-1α-NF-κB pathways. SNS suppressed SGC hyperactivation, reduced the expression of NP-related ion channels, and induced M2 macrophage polarization, thereby alleviating NP and associated neuroinflammation in the DRG.

Conclusions: NRL induced hyperactivation of SGCs, which had increased expression of NP-related ion channels. Reciprocal activation of SGCs and M1 macrophages surrounding the primary sensory neurons was mediated by the HIF-1α and NF-κB pathways. SNS suppressed SGC hyperactivation and skewed M1 macrophage towards M2. Our findings establish SGC activation as a crucial pathomechanism in the gliopathic alterations in NP, which can be modulated by SNS neuromodulation.

Keywords: Macrophage; Neuropathic pain; Satellite glial cell; Sciatic nerve stimulation.


Conflict of interest statement

W. Liu holds shareholder interest in Aneuvo Biomedical Inc., C-E. Wong and J-S. Lee hold related patents. The other authors declare that they have no competing interests.

Figures

Fig. 1
Fig. 1
Study protocol and animal pain behavioral experiments. A The Sham group (group 1) with the L5 nerve root exposed but not ligated was used as the control. In the sciatic nerve stimulation (SNS) groups (groups 2 and 4), the SNS electrode was placed distal to the joint of the L4, L5, and L6 nerve roots at 1-day after nerve root ligation (NRL), and electrical stimulation was performed with 20-Hz for 1 h. In the NRL groups (groups 3 and 4), the L5 nerve root was exposed and ligated. Behavioral tests, including the von Frey and Hargreaves tests, performed 1 day before NRL and on post-injury days (PIDs) 1 (before electric stimulation), 2, 8, and 15. B The paw withdrawal thresholds on the ipsilateral side to NRL and SNS (N = 5–6). C The area under the curve (AUC) calculated as the cumulative withdrawal threshold. D The AUCs of the paw withdrawal thresholds on PIDs 1–8 and 8–15. E The paw withdrawal latencies on the ipsilateral side to NRL and SNS (N = 5–6). F The AUC calculated as the cumulative withdrawal latency. G The AUCs of the paw withdrawal latencies on PIDs 1–8 and 8–15. Data are expressed as mean ± standard deviation (SD). ##p < 0.01 compared with the Sham group, ###p < 0.001 compared with the Sham group, *p < 0.05 compared with the NRL group, **p < 0.01 compared with the NRL group, ***p < 0.001 compared with the NRL group
Fig. 2
Fig. 2
SNS alleviated L5 NRL-induced injury of the primary sensory neurons. A Immunofluorescence staining of NeuN (green) and activating transcription factor 3 (ATF3) (red) on post-injury day (PID 8) (N = 5). B The percentages of ATF3 neurons, ATF3 area, and integrated density of M2 quantified using ImageJ software. C The messenger RNA levels of ATF3C on PID 8 quantified by NanoString nCounter. Data are expressed as mean ± standard deviation. Scale bars = 200 μm. *p < 0.05, **p < 0.01, ***p < 0.001
Fig. 3
Fig. 3
Differentially expressed genes (DEGs) and cellular pathways after NRL and SNS in the L5 DRG. The DEGs of the L5 DRG on post-injury day 8 were evaluated using a NanoString nCounter (N = 3). A Heatmap of DEGs in the L5 DRG between the four experimental groups. B Venn diagram showing the number of DEGs in the L5 DRG. C Volcano plots for differential gene expression. Scattered points represent genes; the x-axis represents the log2 fold change, and the y-axis represents the log(p-value). DEGs were discriminated based on a p-value at an α level of 0.05. Blue dots indicate significantly upregulated genes, whereas green dots indicate significantly downregulated genes. D Cellular pathway scores calculated based on nCounter analyses of the DEGs. *p < 0.05, **p < 0.01
Fig. 4
Fig. 4
Activation SGCs and expression of ion channels and gap junctions in L5 DRG following NRL and SNS. Cryosections of the ipsilateral L5 DRG were obtained from the nerve root ligation rats on post-injury day (PID) 8 (N = 5). A Representative immunofluorescence staining of the SGC marker glial fibrillary acidic protein (GFAP) (red) and neuron marker NeuN (green) with quantification of relative area and integrated density of the GFAP signal. Gfap mRNA levels were quantified by nCounter analysis. B Immunofluorescence staining of GFAP (green) and transient receptor potential cation channel subfamily A member 1 (TRPA1) (red) with quantification of the TRPA1 area and integrated density on post-injury day 8. Trpa1 mRNA levels were quantified by nCounter analysis. C Immunofluorescence staining of NeuN (green) and connexin 43 (Cx43) (red) with quantification of the Cx43 area and integrated density. Gja1mRNA levels were quantified by nCounter analysis. D Immunofluorescence staining of NeuN (green) and S100A10 (red) with quantification of the S100A10 area and integrated density. S100a10 levels were quantified by nCounter analysis. Scale bars = 200 μm. *p < 0.05, **p < 0.01, ***p < 0.001
Fig. 5
Fig. 5
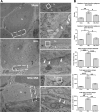
Modulatory effect of SNS on SGC-primary sensory neuron gap junctions in the DRGs in L5 NRL rats. A Transmission electron microscopy images of the L5 DRG showing SGC surrounding the primary sensory neurons. Magnified regions are indicated in white rectangles. Arrowheads indicate gap junctions between SGCs and sensory neurons. N: primary sensory neuron; S: SGCs. Scale bars = 10 μm and 200 nm. B Quantifications of glia-neuron gap junction plaques (N = 3). Data are expressed as mean ± standard deviation. *p < 0.05, **p < 0.01, ***p < 0.01
Fig. 6
Fig. 6
In vitro characterization of activated SGCs. A Immunofluorescence staining of NeuN (green) and activating transcription factor 3 (ATF3) (red) in primary rat DRG neurons treated with the control medium, SGC-conditioned medium, and lipopolysaccharide (LPS). Scale bars = 20 μm. B Quantification of ATF3-positive neurons (N = 4). C Cell viability assay results of primary neurons treated with the control medium, SGC-conditioned medium, and LPS (N = 5). D Immunofluorescence staining of PSD95 (green) and synapsin (red) in primary neurons treated with the control medium, SGC-conditioned medium, and LPS. Magnified regions are indicated in dashed rectangles. Scale bars = 5 μm. E Quantification of synapsin/PSD95 co-localized puncta (N = 4). Data are expressed as mean ± standard deviation. *p < 0.05, **p < 0.01, ***p < 0.01
Fig. 7
Fig. 7
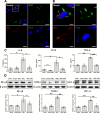
Interactions between activated SGCs and macrophages via cytokines and upregulation of HIF-1α and NF-κB pathways. A Representative confocal microscopy images of glial fibrillary acidic protein (GFAP), ionized calcium binding adaptor molecule 1 (Iba-1), and NeuN in the L5 DRG following nerve root ligation. The magnified region is indicated by the white rectangle. Scale bars = 50 μm. B Magnified confocal microscopy images of GFAP, Iba-1, and NeuN showing nearby signals of GFAP and Iba-1 surrounding NeuN signals. Scale bars = 10 μm. C Enzyme-linked immunosorbent assay quantifications of interleukin-6, chemokine (C–C motif) ligand 3, and tumor necrosis factor-α in the L5 DRG on post-injury day (PID) 8 (N = 3). D Representative Western blots of NF-κB, TRPA1, and HIF1-α in the L5 DRG on PID 8. The corresponding quantifications of relative protein levels for NF-κB, TRPA1, and HIF1- α are also shown (N = 3). Data are expressed as mean ± standard deviation. *p < 0.05, **p < 0.01, ***p < 0.01
Fig. 8
Fig. 8
NRL and SNS altered the macrophage polarization in the L5 DRG. A Immunofluorescence staining of satellite glial cell macrophage marker ionized calcium binding adaptor molecule 1 (Iba-1) (red), M1 marker inducible nitric oxide synthase (green) and M2 marker CD206 (cyan) on post-injury day (PID) 8 (N = 5). B Representative magnified images of M1 and M2 macrophages indicated by arrowheads. C The percentages of M1 and M2 macrophages and the ratio of M1/M2 quantified using ImageJ software. D The messenger RNA levels of Cd86 and Cd206 in the L5 DRG on PID 8 quantified by NanoString nCounter. E The relative area and integrated density of the Iba-1 signal quantified using ImageJ software. Data are expressed as mean ± standard deviation. Scale bars = 200 μm and 50 μm. *p < 0.05, **p < 0.01

References

    1. Costigan M, Scholz J, Woolf CJ. Neuropathic pain: a maladaptive response of the nervous system to damage. Annu Rev Neurosci. 2009;32:1–32. 10.1146/annurev.neuro.051508.135531 - DOI - PMC - PubMed
    1. Hanani M, Spray DC. Emerging importance of satellite glia in nervous system function and dysfunction. Nat Rev Neurosci. 2020;21:485. 10.1038/s41583-020-0333-z - DOI - PMC - PubMed
    1. Huang LYM, Gu Y, Chen Y. Communication between neuronal somata and satellite glial cells in sensory ganglia. Glia. 2013;61:1571–81. 10.1002/glia.22541 - DOI - PMC - PubMed
    1. Jasmin L, Vit JP, Bhargava A, Ohara PT. Can satellite glial cells be therapeutic targets for pain control? Neuron Glia Biol. 2010;6:63–71. 10.1017/S1740925X10000098 - DOI - PMC - PubMed
    1. Warwick RA, Hanani M. The contribution of satellite glial cells to chemotherapy-induced neuropathic pain. Eur J Pain. 2013;17:571–80. 10.1002/j.1532-2149.2012.00219.x - DOI - PubMed

LinkOut - more resources