. 2024 Aug 31;38(16):e23863.
doi: 10.1096/fj.202400982R.

Interstitial cells of the sip syncytium regulate basal membrane potential in murine gastric corpus

Affiliations

Interstitial cells of the sip syncytium regulate basal membrane potential in murine gastric corpus

Sung Jin Hwang et al. FASEB J. .

Abstract

Smooth muscle cells (SMCs), Interstitial cells of Cajal (ICC) and Platelet-derived growth factor receptor α positive (PDGFRα+) cells form an integrated, electrical syncytium within the gastrointestinal (GI) muscular tissues known as the SIP syncytium. Immunohistochemical analysis of gastric corpus muscles showed that c-KIT+/ANO1+ ICC-IM and PDGFRα+ cells were closely apposed to one another in the same anatomical niches. We used intracellular microelectrode recording from corpus muscle bundles to characterize the roles of intramuscular ICC and PDGFRα+ cells in conditioning membrane potentials of gastric muscles. In muscle bundles, that have a relatively higher input impedance than larger muscle strips or sheets, we recorded an ongoing discharge of stochastic fluctuations in membrane potential, previously called unitary potentials or spontaneous transient depolarizations (STDs) and spontaneous transient hyperpolarizations (STHs). We reasoned that STDs should be blocked by antagonists of ANO1, the signature conductance of ICC. Activation of ANO1 has been shown to generate spontaneous transient inward currents (STICs), which are the basis for STDs. Ani9 reduced membrane noise and caused hyperpolarization, but this agent did not block the fluctuations in membrane potential quantitatively. Apamin, an antagonist of small conductance Ca2+-activated K+ channels (SK3), the signature conductance in PDGFRα+ cells, further reduced membrane noise and caused depolarization. Reversing the order of channel antagonists reversed the sequence of depolarization and hyperpolarization. These experiments show that the ongoing discharge of STDs and STHs by ICC and PDGFRα+ cells, respectively, exerts conditioning effects on membrane potentials in the SIP syncytium that would effectively regulate the excitability of SMCs.

Keywords: PDGFRα+ interstitial cells; c‐KIT+ and ANO1+ interstitial cells of Cajal; spontaneous transient depolarizations (STDs); spontaneous transient hyperpolarizations (STHs).


Conflict of interest statement

Conflict of Interest Statement

The authors declare no conflicts of interest.

Figures
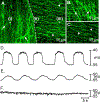
Figure 1.
Figure 1.. Mapping electrical activity across intact and dissected regions of the gastric corpus.
Intracellular microelectrode recordings were performed across intact and dissected regions of the gastric corpus. Panels A & B, in region Ai* & B, where the gastric corpus muscle layer was intact and interstitial cells of Cajal at the level of the myenteric plexus (ICC-MY) were present (arrows; *), resting membrane potential (RMP) averaged −58.5±1.5 mV and slow waves 11.6±1.5 mV in amplitude and 3.6±1.5 s in half maximal duration, occurred at a frequency of 5.8±0.7 cycles min−1 (D). Panel A, in region Aii*, immediately adjacent to where the longitudinal muscle and ICC-MY were dissected, the amplitude of the slow waves decreased to 15.2±7.6 mV (Panel E). RMP, frequency and duration of slow waves remained similar to the intact region of the preparation. Panels A & C, in region Aiii* & C, electrical recordings made within the dissected region where only the circular muscle layer and ICC-IM (arrowheads and *) were present generated irregular noisy recordings consisting of membrane depolarizations and hyperpolarizations (Panel F). Scale bars = 50 µm in all panels.
Figure 2.
Figure 2.. c-KIT+/ANO1+ ICC and PDGFRα+ cells are distinct populations of interstitial cells within the circular muscle layer of the gastric corpus.
Panels A-C, c-KIT+ ICC-IM within circular muscle of the gastric corpus (Panel A, green; arrows) also express ANO1 (Panel B, red; arrowheads). Panel C, merged image of Panels A&B showing cellular co-localization of both proteins (yellow; arrows). Panels D-F, c-KIT+ ICC-IM and PDGFRα+ cells are distinct populations of interstitial cells in the gastric corpus. Panel D, c-KIT+ ICC-IM (green; arrows), Panel E, PDGFRα+ cells (red; arrowheads). Panel F, merged image revealing that c-KIT+ ICC-IM and PDGFRα+ cells are two separate populations of interstitial cells in the corpus (arrows and arrowheads, respectively). Scale bars in Panels A&F = 50 μm and represent the respective series of panels.
Figure 3.
Figure 3.. Expression of c-KIT and ANO1 in circular muscle bundles of gastric corpus.
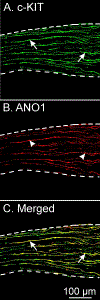
Panels A-C, cellular co-localization of c-KIT (Panel A; green, arrows) and ANO1 (Panel B; red, arrowheads) in ICC-IM within the circular layer of a corpus muscle bundle. Panel C, merged image showing cellular colocalization of c-KIT+ and ANO1+ in ICC-IM (yellow, arrows). The circular muscle bundle is outlined by the dashed white lines in each panel. Scale bar in Panel C = 100 μm and represent the relevant series of panels.
Figure 4.
Figure 4.. Expression of PDGFRα and SK3 in circular muscle bundles of gastric corpus.
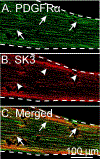
Panels A-C, cellular co-localization of PDGFRα (Panel A; green, arrows) and the small-conductance Ca2+-activated potassium channel, SK3 (Panel B; red, arrows) in a gastric corpus muscle bundle. Panel C, merged image showing cellular colocalization of PDGFRα and SK3 (yellow, arrows). The borders of the circular muscle bundle are shown by the dashed white lines in each panel. Scale bars in Panel C = 100 μm and represent the corresponding series of panels.
Figure 5.
Figure 5.. Electrical activity of circular muscle bundles from the gastric corpus.
Panel A, spontaneous activity consisting of irregular membrane potential fluctuations with spike action potentials. Panel B, region outlined in Panel A by the dashed box shown at a faster sweep speed. Note action potentials in corpus muscle bundles occurred during the depolarization phase of the membrane fluctuation (STD). Panel C, nifedipine (1 μM) abolished spike action potentials and revealed an ongoing discharge of membrane fluctuations that consisted of spontaneous transient depolarizations (STDs) and spontaneous transient hyperpolarizations (STHs). Panel D, region outlined in Panel C by the dashed box shown at a faster sweep speed. Panel E, in the continued presence of nifedipine, CaCCinh-A01 (10 μM) caused membrane hyperpolarization and inhibited STDs, revealing hyperpolarizing STHs. Panel F, region outlined in Panel E by the dashed box shown at a faster sweep speed. Panel G, in the continued presence of nifedipine and CaCCinh-A01, apamin (300 nM) inhibited STHs and produced membrane quiescence. Panel H, region outlined in Panel G by the dashed box shown at a faster sweep speed.
Figure 6.
Figure 6.. The effects of apamin on AMP and membrane oscillations of corpus circular muscle bundles.
Panel A, STDs and STHs under control conditions, dashed line represents average membrane potential (AMP). Panel B, addition of apamin (300 nM) caused depolarization in membrane potential and abolished both STDs and STHs. Note the depolarization in AMP caused by apamin was to the most depolarized potentials of STD’s recorded under control conditions. Panel C, an All-Points histogram of the changes in AMP and membrane fluctuations under control conditions (black bars) and after apamin (300 nM; red bars). Apamin (300 nM) caused a significant depolarization in AMP (red bars and line) compared to AMP under control conditions (black bars and line). As electrical recordings became quiescent the distribution became tighter.
Figure 7.
Figure 7.. The effects of the CaCC inhibitor CaCCinh-A01 on AMP and membrane fluctuations of corpus circular muscle bundles.
Panel A, STDs and STHs under control conditions, dashed line represents average membrane potential (AMP). Panel B, after addition of CaCCinh-A01. CaCCinh-A01 (10 μM) caused hyperpolarization in membrane potential and significantly reduced STDs and STHs. Panel C, an All-Points histogram of the changes in average membrane potential (AMP) and membrane fluctuations under control conditions (black bars) and after CaCCinh-A01 (red bars).
Figure 8.
Figure 8.. The effects of apamin and CaCCinh-A01 on RMP and membrane fluctuations of corpus circular muscle bundles.
Panel A, STDs and STHs recorded under control conditions. Dashed line represents average membrane potential (AMP). Panel B, apamin (300 nM) caused membrane depolarization and abolished STD’s and STH’s. Panel C, in the presence of apamin, CaCCinh-A01 (10 μM) hyperpolarized AMP. Panel C, an All-Points histogram of the changes in AMP, STD’s and STH’s under control conditions (black bars), after apamin (blue bars) and after CaCCinh-A01 in the presence of apamin (red bars). Note apamin tightened the distribution (blue line) compared to control conditions (black line).
Figure 9.
Figure 9.. The effect of the sarcoplasmic Ca2+‐ATPase inhibitor cyclopiazonic acid (CPA) on AMP, STD and STHs of corpus muscles.
Panel A, under control conditions AMP averaged −52±0.4 mV and corpus muscles generated an ongoing discharge of STDs and STHs. Panel B, addition of CPA (10 μM) caused depolarization in AMP and caused a significant reduction in STDs and STHs. Panel C, an All-Points histogram of the changes in AMP and membrane fluctuations under control conditions (black bars) and after CPA (red bars).
Figure 10.
Figure 10.. Close apposition between enteric nerve fibers and ICC-IM in corpus muscle bundles.
Panel A, c-KIT+ ICC-IM (green, arrows) in a corpus circular muscle bundle. Panel B, PGP9.5+ nerve fibers (red, arrowheads) in the same muscle bundle. Panel C, merged image revealing the close apposition between ICC-IM and enteric nerve fibers (arrows) in corpus muscle bundles. The circular muscle bundle is outlined by the dashed white lines in each panel. Scale bar in Panel C = 100 μm and represents the respective series of panels.
Figure 11.
Figure 11.. Close apposition between PDGFRα+ cells and enteric nerve fibers in corpus muscle bundles.
Panel A, PDGFRα+ cells (green, arrows) in a corpus circular muscle bundle. Panel B, PGP9.5+ nerve fibers (red, arrowheads) in the same circular muscle bundle. Panel C, merged image revealing the close apposition between PDGFRα+ cells and enteric nerve fibers (arrows) in corpus muscle bundles. The circular muscle bundle is outlined by the dashed white lines in each panel. Scale bar in Panel C = 100 μm and represents the series of panels.
Figure 12.
Figure 12.. Effects of neurally evoked responses on AMP, STDs and STHs of corpus muscles.
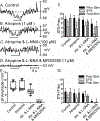
Panel A, electrical field stimulation (EFS; 0.5 ms pulse duration, train durations 5 s @ a frequency of 5 Hz, 10–15 V, horizontal bars) produced hyperpolarization in AMP (inhibitory junctional potential; IJP) and reduced the amplitude of STDs (dashed line). STDs recovered following termination of EFS and restoration of the AMP to membrane potentials prior to EFS. Panel B, atropine (1 μM) did not affect AMP and responses to EFS compared to control conditions, but STDs were also reduced during EFS. Panel C, In the presence of atropine, L-NNA (100 μM) also had no affect on AMP but slightly reduced the amplitude of the IJP. The decrease in STD frequency was reduced in atropine and L-NNA. Panel D, In the continued presence of atropine and L-NNA, addition of MRS2500 (1 μM) depolarized AMP and abolished the IJP and STDs and STHs. Panel E, Summary of the effects of EFS on IJP amplitude under control conditions and in the presence of antagonists. Panels F and G, A summary of the effects of EFS evoked neural responses on STD and STH frequences, 5 seconds prior to EFS (black bars), during EFS (white bars) and post EFS (grey bars). effect of EFS evoked neural responses on STD and STH frequencies. Under control conditions and in the presence of atropine, STD and STH frequency decreased during EFS. In atropine and L-NNA, EFS slightly reduced STDs and STH frequency. In atropine and L-NNA, the P2Y1 receptor antagonist MRS2500 greatly reduced the amplitude of both STDs and STHs.

References

    1. Desai KM, Sessa WC, and Vane JR (1991) Involvement of nitric oxide in the reflex relaxation of the stomach to accommodate food or fluid. Nature 351, 477–479 - PubMed
    1. Tack J, Demedts I, Meulemans A, Schuurkes J, and Janssens J (2002) Role of nitric oxide in the gastric accommodation reflex and in meal induced satiety in humans. Gut 51, 219–224 - PMC - PubMed
    1. Tack J (2005) Gastric motor and sensory function. Curr Opin Gastroenterol 21, 665–672 - PubMed
    1. Ordog T, Ward SM, and Sanders KM (1999) Interstitial cells of cajal generate electrical slow waves in the murine stomach. J Physiol 518 (Pt 1), 257–269 - PMC - PubMed
    1. Dickens EJ, Hirst GD, and Tomita T (1999) Identification of rhythmically active cells in guinea-pig stomach. J Physiol 514 (Pt 2), 515–531 - PMC - PubMed

MeSH terms

Substances

LinkOut - more resources