Editorial
. 2024 Aug 14;4(1):vbae099.
doi: 10.1093/bioadv/vbae099. eCollection 2024.

Current and future directions in network biology

Affiliations
Editorial

Current and future directions in network biology

Marinka Zitnik et al. Bioinform Adv. .

Abstract

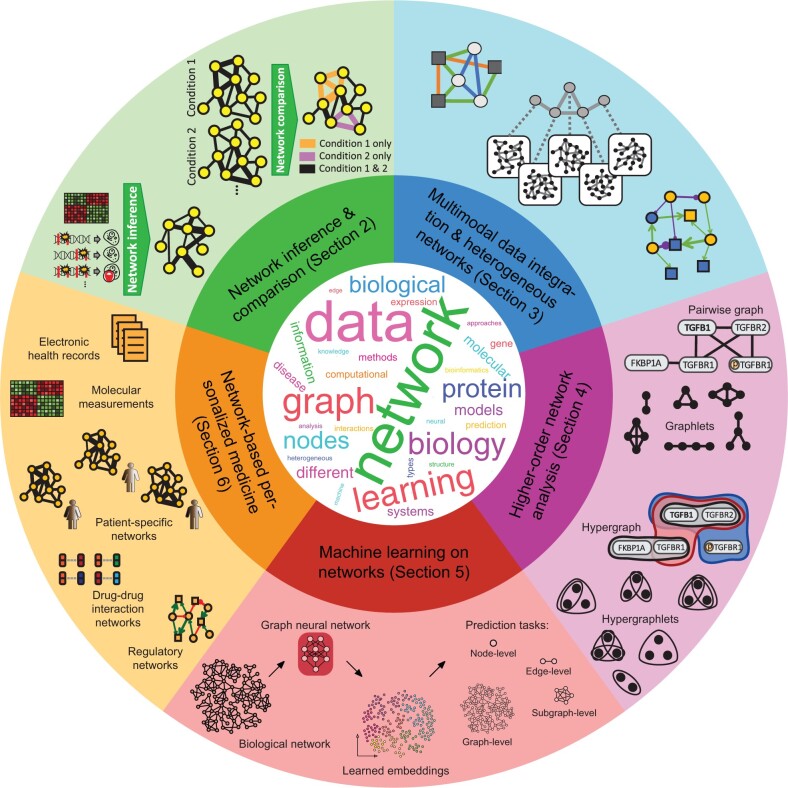
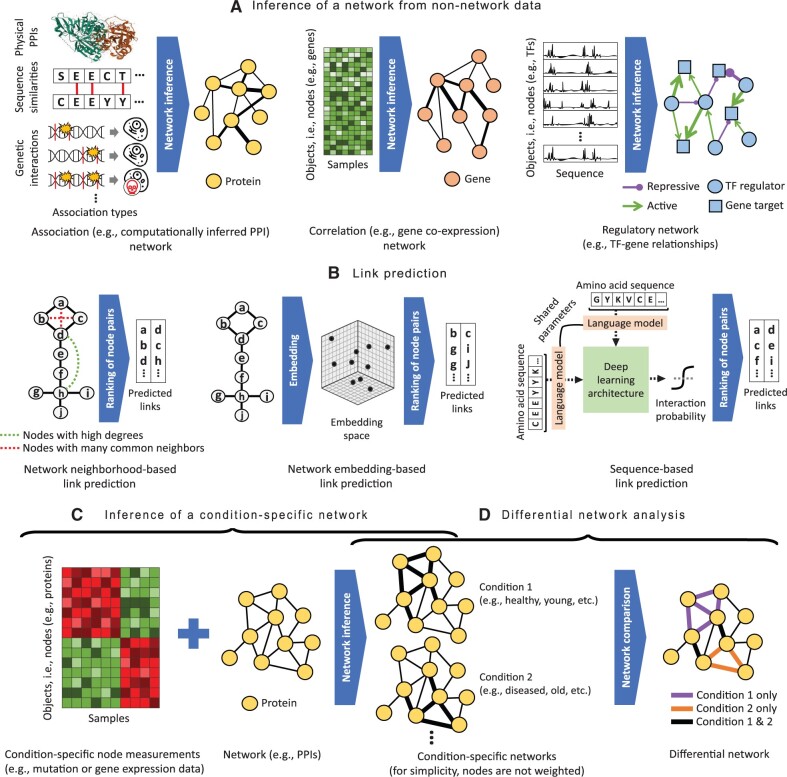
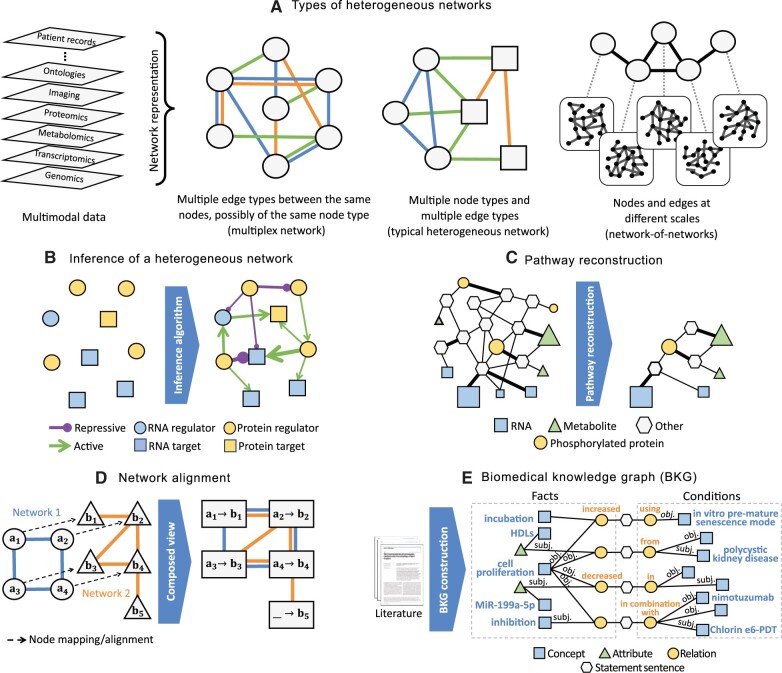
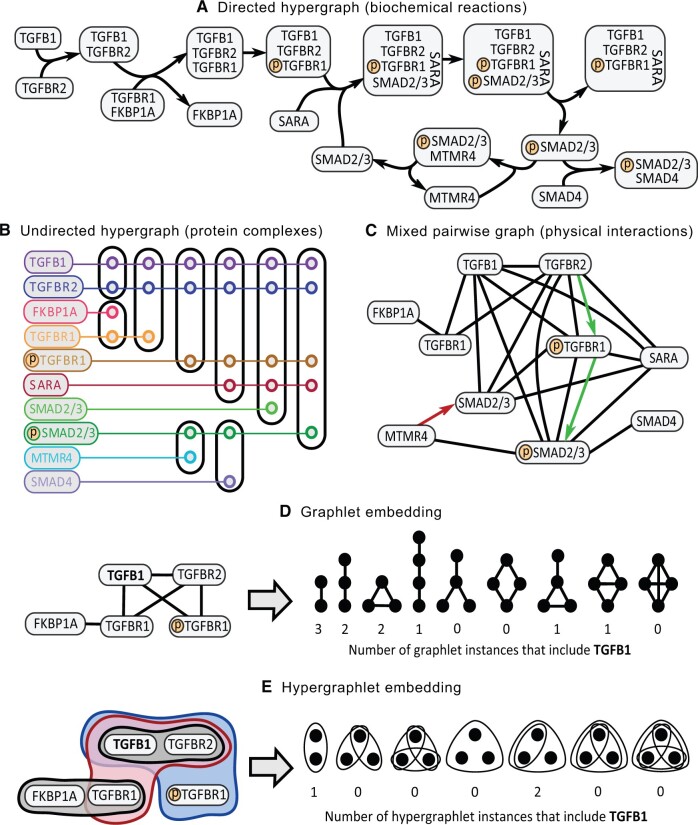
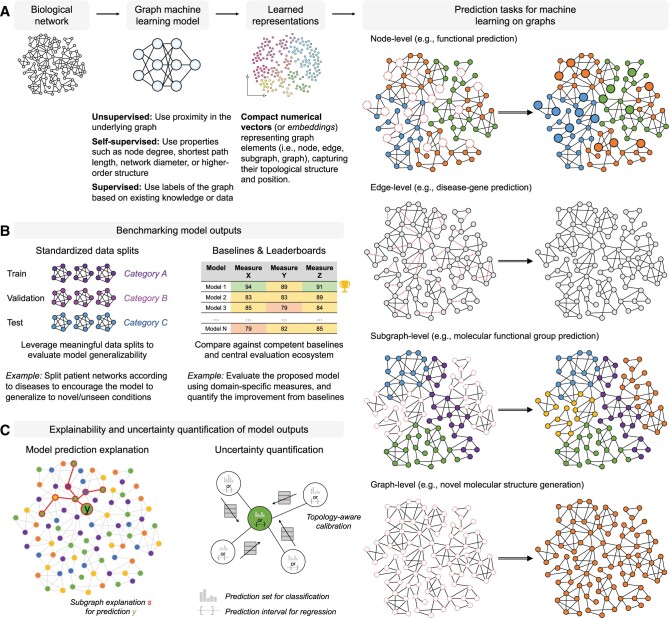
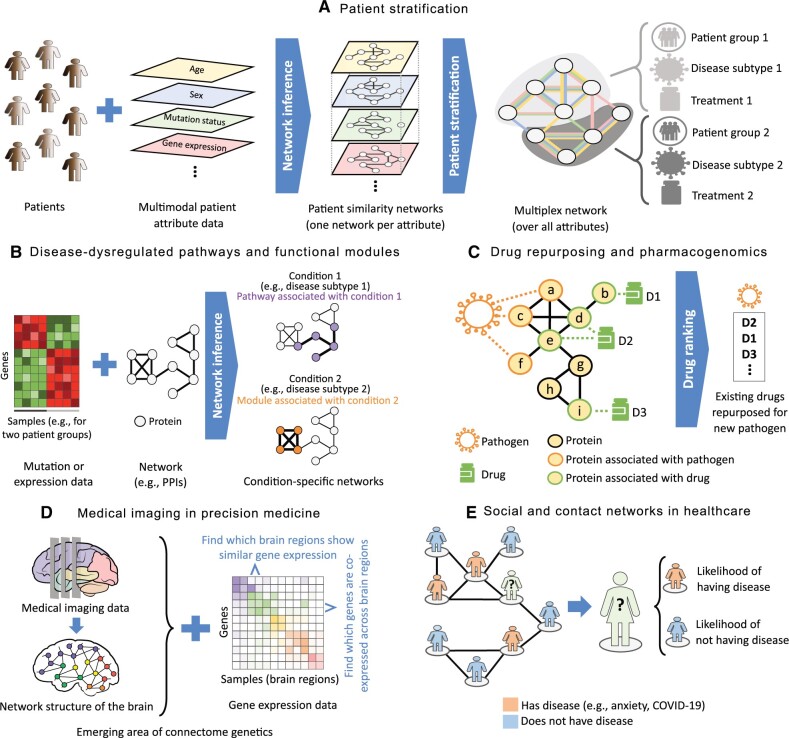
Summary: Network biology is an interdisciplinary field bridging computational and biological sciences that has proved pivotal in advancing the understanding of cellular functions and diseases across biological systems and scales. Although the field has been around for two decades, it remains nascent. It has witnessed rapid evolution, accompanied by emerging challenges. These stem from various factors, notably the growing complexity and volume of data together with the increased diversity of data types describing different tiers of biological organization. We discuss prevailing research directions in network biology, focusing on molecular/cellular networks but also on other biological network types such as biomedical knowledge graphs, patient similarity networks, brain networks, and social/contact networks relevant to disease spread. In more detail, we highlight areas of inference and comparison of biological networks, multimodal data integration and heterogeneous networks, higher-order network analysis, machine learning on networks, and network-based personalized medicine. Following the overview of recent breakthroughs across these five areas, we offer a perspective on future directions of network biology. Additionally, we discuss scientific communities, educational initiatives, and the importance of fostering diversity within the field. This article establishes a roadmap for an immediate and long-term vision for network biology.

Availability and implementation: Not applicable.


Conflict of interest statement

In Section 8, we rely on ISCB’s diversity statistics. These statistics are publicly available, and so there is no conflict of interest. Yet, to remedy any potential perceived conflict of interest, we declare that Predrag Radivojac is the President of ISCB and currently serves on the Board of Directors of ISCB. In addition, Tijana Milenković currently serves on the ISCB Board of Directors and the ISCB EDI Committee. The remaining authors have no conflicts of interest to declare.

Figures

Figure 1.
Figure 1.
Overview of the network biology field and five research topics discussed in this article. The word cloud in the center, generated using WordClouds.com, contains the top 30 most representative words from this article. Note that each word’s rank is based on the sum of the weights of the core word (e.g. learn) and its derived words (e.g. learns, learning, learned).
Figure 2.
Figure 2.
Prominent topics related to network inference and comparison. (A) Inference of an association (left), correlation (middle), or regulatory (right) network from nonnetwork data. (B) Link prediction: inference of new interactions from existing network data via neighborhood- (left) or embedding-based (middle) approaches, or from sequence data (right). For the former, shown are nodes that may be linked by new edges because two given nodes have high degrees (preferential attachment) or share many common neighbors; other neighborhood-based approaches exist, as discussed in the text. (C) Inference of a condition-specific network. The second approach category is illustrated. The thicker an edge in the network for a given condition, the more relevant the edge is for that condition. (D) Differential network analysis. Illustrated is a potential differential network between conditions 1 and 2, containing edges that are highly relevant for condition 1 but not condition 2, edges that are highly relevant for condition 2 but not condition 1, and edges that have consistent relevance patterns in both conditions.
Figure 3.
Figure 3.
Prominent topics related to multimodal data integration and heterogeneous networks. (A) Heterogeneous networks can naturally represent multimodal data. A heterogeneous network can have only a single node type, with different data modalities representing multiple edge types. Or, there can exist both multiple node and edge types. Different node types can exist at different biological scales; e.g. in a network-of-networks, nodes at a given scale are networks at the lower scale. (B–E) Prominent topics related to heterogeneous networks. (B) Inference of a heterogeneous network aims to learn the graph topology from multimodal—to date, typically multi-omic—measurements. (C) Pathway reconstruction for interpretation of multi-omic data: the input is multi-omic data and a background molecular network, and the output is a sparse subnetwork. Typically input biomolecules with higher scores (indicated by node sizes) and higher-quality connections (indicated by edge thickness) are prioritized in the output. (D) Network alignment: input can be individual homogeneous networks (left) or heterogeneous networks. Even alignment of homogeneous networks leads to a heterogeneous network (right) whose “supernodes” contain mapped nodes and whose edge types indicate which edges of the original networks are conserved (e.g., between supernodes “a1→b1” and “a2→b2” where the edge exists in both network 1 and network 2) versus nonconserved (e.g. between supernodes “a1→b1” and “a3→b3” where the edge exists in network 1 but not in network 2) under the given node mapping. (E) Inference of and reasoning on BKGs. Shown is a condition-aware BKG. The middle nodes (hexagons) are statement sentences. The layers on their left represent fact tuples and those on their right represent the conditions associated with the facts. The tuples have relation nodes (circles), concept nodes (squares), and optional attribute nodes (triangles).
Figure 4.
Figure 4.
Graph representations of nine reactions from Reactome’s TGFβ signaling pathway. (A) In a directed hypergraph, each hyperedge captures a reaction (“p” denotes phosphorylation). (B) In an undirected hypergraph, each hyperedge captures a protein complex. (C) In a (mixed) pairwise graph, each edge captures a pairwise interaction. “Mixed” refers to having both directed and undirected edges in the graph. Undirected edges denote physical interactions; directed edges denote either phosphorylation (the two right-most directed edges) or dephosphorylation (the left-most directed edge). (D) A node in a pairwise graph can be represented as a vector of graphlet counts. The number of 2-, 3-, and 4-node graphlet instances that include TGFB1 in the graph on the left are shown. (E) A node in an undirected hypergraph can be represented as a vector of hypergraphlet counts. The number of 2- and 3-node hypergraphlet instances that include TGFB1 in the hypergraph on the left are shown. In panels (D and E), only the (hyper)graphlet-level counts are shown for simplicity, i.e. (hyper)graphlet orbits are not shown nor considered when doing the counting. However, in practice, the more detailed orbit-level counts are computed rather than the (hyper)graphlet-level counts.
Figure 5.
Figure 5.
Overview of the components of machine learning on networks. (A) The core of this approach is a machine learning model, typically a neural network, that takes one or more biological networks as input and learns representations (i.e. embeddings) of various graph elements in an unsupervised, self-supervised, or supervised manner. There are four types of prediction tasks (denoted by the red dashed lines): node-, edge-, subgraph-, and graph-level predictions. Colors of nodes for the node-, subgraph-, and graph-level tasks signify the label; white nodes indicate missing labels to be predicted by the model. Examples include functional prediction (node-level), disease–gene prediction or context-specific edge prediction (edge-level), molecular functional group prediction (subgraph-level), and novel molecular structure generation (graph-level). Critical to continued development, wide adoption, and practical utility of network-based machine learning is a parallel improvement in frameworks for (B) rigorous benchmarking via established data splits and baselines, and (C) explainability of model predictions (e.g. identifying a subgraph s, denoted by red lines, that best explains the prediction y for the query node, denoted in green) and uncertainty quantification (e.g. using the prediction set for a classification task or prediction interval for a regression task; Huang et al. 2023b).
Figure 6.
Figure 6.
Prominent topics in network-based precision medicine. (A) Groups of patients that correspond to their communities (clusters) in a patient similarity network may shed light on distinct disease subtypes and thus lead to tailored, group-specific therapeutic strategies. (B) Identification of pathways (sparse, tree-like subnetworks) or functional modules (dense, clique-like subnetworks) associated with disease (subtypes) is related to inference of a condition-specific network (Section 2) and pathway reconstruction (Section 3). (C) Drug repurposing evaluates the fit of existing drugs to new diseases based on network “relatedness” between protein targets of the existing drugs and proteins associated with the new diseases, e.g. existing drug D2 may be a good treatment for the new pathogen because D2 targets two proteins (d and e), both of which directly interact with two of the proteins associated with the pathogen (a and c); the four proteins (a, c, d, e) form a clique, which further adds to their “relatedness.” (D) An important application of medical imaging lies in brain disorders. In connectome genetics, network structure of the brain meets -omics data. (E) An individual’s position in their social/contact network, along with demographic, personality, physical/mental health, etc. information about the other individuals, can give insights into the given individual’s health.

References

    1. Abdar M, Pourpanah F, Hussain S. et al. A review of uncertainty quantification in deep learning: techniques, applications and challenges. Inf Fusion 2021;76:243–97.
    1. Abramson J, Adler J, Dunger J. et al. Accurate structure prediction of biomolecular interactions with AlphaFold 3. Nature 2024;630:493–500. - PMC - PubMed
    1. Agarwal C, Queen O, Lakkaraju H. et al. Evaluating explainability for graph neural networks. Sci Data 2023;10:144. - PMC - PubMed
    1. Agarwal S, Branson K, Belongie S. Higher order learning with graphs. In: Proceedings of the International Conference on Machine Learning. p. 17–24. New York, NY: Association for Computing Machinery, 2006.
    1. Agrawal M, Zitnik M, Leskovec J. Large-scale analysis of disease pathways in the human interactome. In: Proceedings of the Pacific Symposium on Biocomputing. p. 111–22. 2018. - PMC - PubMed

Publication types

LinkOut - more resources