. 2024 Aug 1;14(8):6036-6047.
doi: 10.21037/qims-23-1563. Epub 2024 Apr 23.

Effects of long-term running on the structure and biochemical composition of knee cartilage in males: a cross-sectional study

Affiliations

Effects of long-term running on the structure and biochemical composition of knee cartilage in males: a cross-sectional study

Yanjing Zhang et al. Quant Imaging Med Surg. .

Abstract

Background: Running has been widely recognized as a beneficial activity for improving physical fitness, but it can also increase the risk of running-related injuries (RRIs). This study aims to assess the impact of long-term running on the structural and biochemical composition of the knee.

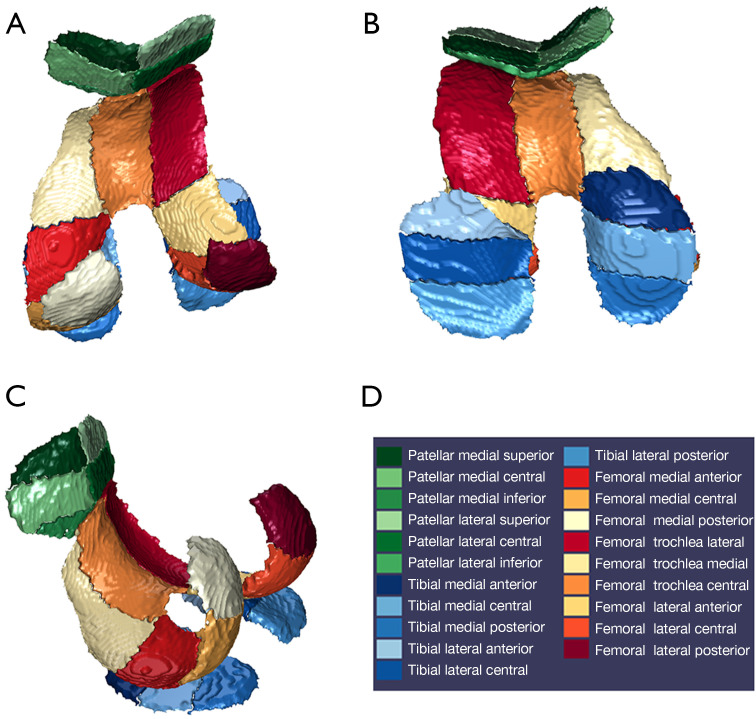
Methods: This study recruited a total of 32 participants, including 16 male recreational runners, aged 28-49 years, with a running experience of 2-7 years, and 16 matched sedentary controls. Magnetic resonance (MR) scans of T2* mapping and three-dimensional double-echo steady-state (3D-DESS) were performed on all participants. The volumes, thickness, and T2* values of joint articular cartilage were obtained via automatic segmentation software.

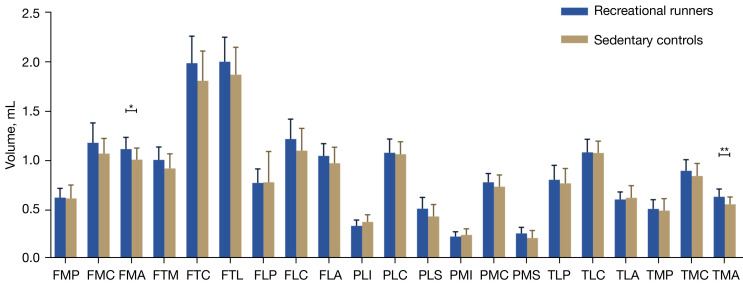
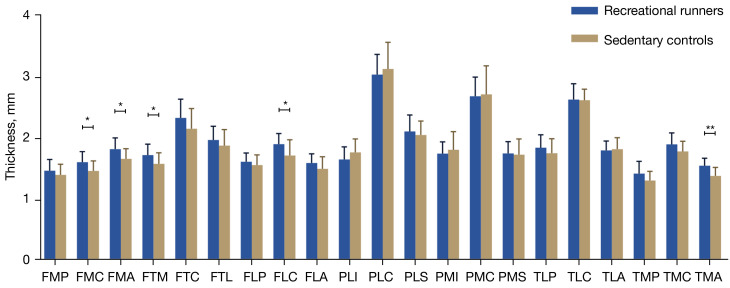
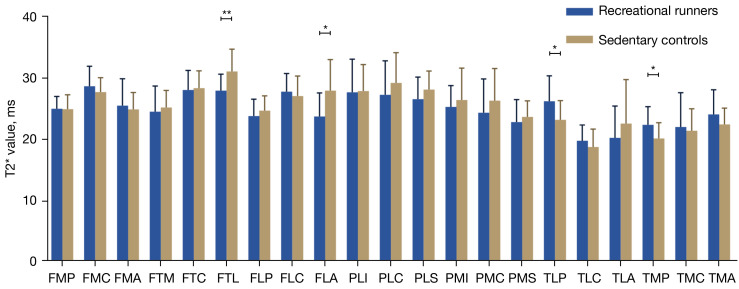
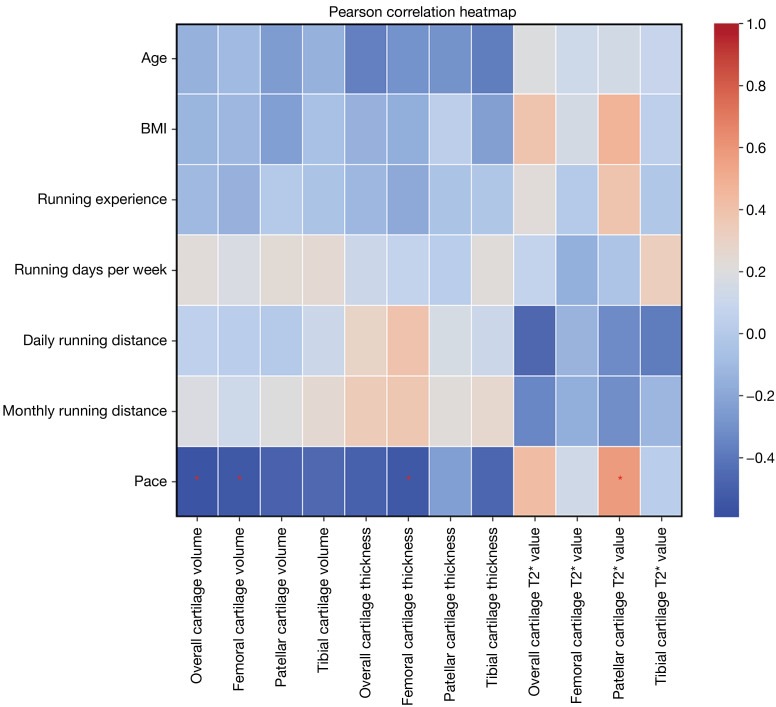
Results: Compared with the sedentary controls, runners exhibited significant increases in the volumes of both the femoral medial articular cartilage and the tibial medial articular cartilage. Additionally, there were significant increases in the thickness of several cartilage regions, including femoral medial cartilage, femoral medial articular cartilage, femoral medial thickness, femoral lateral cartilage, and tibial medial articular cartilage. Notably, the T2* values in the femoral lateral and tibial lateral cartilage of runners decreased significantly, while those in the patellar cartilage and medial tibial cartilage increased significantly. Runner pace was negatively correlated with the overall knee cartilage thickness (r=-0.556; P=0.02), femoral cartilage thickness (r=-0.533; P=0.03), and volume (r=-0.532; P=0.03) but positively correlated with the T2* value of the patellar cartilage (r=0.577; P=0.01).

Conclusions: Our study suggests that long-term mechanical stress from running may lead to increased thickness and volume in certain knee joint cartilage regions, possibly enhancing the functional adaptability of knee cartilage. The varying changes in T2* value in the tibial and fibular cartilage areas may indicate differing adaptability to pressure.

Keywords: Running; cartilage; knee; magnetic resonance imaging (MRI).


Conflict of interest statement

Conflicts of Interest: All authors have completed the ICMJE uniform disclosure form (available at https://qims.amegroups.com/article/view/10.21037/qims-23-1563/coif). T.C.C. is an employee of Siemens Healthineers and provided technical MRI guidance for this paper. The other authors have no conflicts of interest to declare.

Figures

Figure 1
Figure 1
Cartilage automatically segmented using MR Chondral Health: (A) cranial view; (B) caudal view; (C) side view; (D) the color codes of the 21 subregions. MR, magnetic resonance.
Figure 2
Figure 2
Comparison of knee cartilage volumes in 21 subregions between recreational runners and sedentary participants. *, P<0.05; **, P<0.01. FMP, femoral medial posterior; FMC, femoral medial central; FMA, femoral medial anterior; FTM, femoral trochlear medial; FTC, femoral trochlear central; FTL, femoral trochlear lateral; FLP, femoral lateral posterior; FLC, femoral lateral central; FLA, femoral lateral anterior; PLI, patellar lateral inferior; PLC, patellar lateral central; PLS, patellar lateral superior; PMI, patellar medial inferior; PMC, patellar medial central; PMS, patellar medial superior; TLP, tibial lateral posterior; TLC, tibial lateral central; TLA, tibial lateral anterior; TMP, tibial medial posterior; TMC, tibial medial central; TMA, tibial medial anterior.
Figure 3
Figure 3
Comparison of knee cartilage thickness in the 21 subregions between the recreational runners and sedentary participants. *, P<0.05; **, P<0.01. FMP, femoral medial posterior; FMC, femoral medial central; FMA, femoral medial anterior; FTM, femoral trochlear medial; FTC, femoral trochlear central; FTL, femoral trochlear lateral; FLP, femoral lateral posterior; FLC, femoral lateral central; FLA, femoral lateral anterior; PLI, patellar lateral inferior; PLC, patellar lateral central; PLS, patellar lateral superior; PMI, patellar medial inferior; PMC, patellar medial central; PMS, patellar medial superior; TLP, tibial lateral posterior; TLC, tibial lateral central; TLA, tibial lateral anterior; TMP, tibial medial posterior; TMC, tibial medial central; TMA, tibial medial anterior.
Figure 4
Figure 4
Comparison of knee cartilage T2* values in 21 subregions between recreational runners and sedentary participants. *, P<0.05; **, P<0.01. FMP, femoral medial posterior; FMC, femoral medial central; FMA, femoral medial anterior; FTM, femoral trochlear medial; FTC, femoral trochlear central; FTL, femoral trochlear lateral; FLP, femoral lateral posterior; FLC, femoral lateral central; FLA, femoral lateral anterior; PLI, patellar lateral inferior; PLC, patellar lateral central; PLS, patellar lateral superior; PMI, patellar medial inferior; PMC, patellar medial central; PMS, patellar medial superior; TLP, tibial lateral posterior; TLC, tibial lateral central; TLA, tibial lateral anterior; TMP, tibial medial posterior; TMC, tibial medial central; TMA, tibial medial anterior.
Figure 5
Figure 5
The heatmap of correlation matrix for running dataset. In this heatmap, warm colors represent positive correlations, while cool colors represent negative correlations. The chart has been truncated to display essential data. *, P<0.05. BMI, body mass index.

Similar articles

References

    1. Ceyssens L, Vanelderen R, Barton C, Malliaras P, Dingenen B. Biomechanical Risk Factors Associated with Running-Related Injuries: A Systematic Review. Sports Med 2019;49:1095-115. 10.1007/s40279-019-01110-z - DOI - PubMed
    1. Gao J, Fang J, Gong H, Gao B. Morphological and Microstructural Alterations of the Articular Cartilage and Bones during Treadmill Exercises with Different Additional Weight-Bearing Levels. J Healthc Eng 2017;2017:8696921. 10.1155/2017/8696921 - DOI - PMC - PubMed
    1. Amoako AO, Pujalte GG. Osteoarthritis in young, active, and athletic individuals. Clin Med Insights Arthritis Musculoskelet Disord 2014;7:27-32. 10.4137/CMAMD.S14386 - DOI - PMC - PubMed
    1. Chu CR, Williams AA, Coyle CH, Bowers ME. Early diagnosis to enable early treatment of pre-osteoarthritis. Arthritis Res Ther 2012;14:212. 10.1186/ar3845 - DOI - PMC - PubMed
    1. Maas KJ, Warncke M, Behzadi C, Welsch GH, Schoen G, Kaul MG, Adam G, Bannas P, Henes FO. Correlation of T2* relaxation times of the retropatellar cartilage with tibial tuberosity-trochlea groove distance in professional soccer players. Sci Rep 2020;10:15355. 10.1038/s41598-020-72299-7 - DOI - PMC - PubMed

LinkOut - more resources