. 2024 Jul 31;13(7):1033-1050.
doi: 10.21037/tp-24-8. Epub 2024 Jul 29.

Identification and analysis of inflammation-related biomarkers in tetralogy of Fallot

Affiliations

Identification and analysis of inflammation-related biomarkers in tetralogy of Fallot

Junzhe Du et al. Transl Pediatr. .

Abstract

Background: Studies have revealed that inflammatory response is relevant to the tetralogy of Fallot (TOF). However, there are no studies to systematically explore the role of the inflammation-related genes (IRGs) in TOF. Therefore, based on bioinformatics, we explored the biomarkers related to inflammation in TOF, laying a theoretical foundation for its in-depth study.

Methods: TOF-related datasets (GSE36761 and GSE35776) were downloaded from the Gene Expression Omnibus (GEO) database. The differentially expressed genes (DEGs) between TOF and control groups were identified in GSE36761. And DEGs between TOF and control groups were intersected with IRGs to obtain differentially expressed IRGs (DE-IRGs). Afterwards, the least absolute shrinkage and selection operator (LASSO) and random forest (RF) were utilized to identify the biomarkers. Next, immune analysis was carried out. The transcription factor (TF)-mRNA, lncRNA-miRNA-mRNA, and miRNA-single nucleotide polymorphism (SNP)-mRNA networks were created. Finally, the potential drugs targeting the biomarkers were predicted.

Results: There were 971 DEGs between TOF and control groups, and 29 DE-IRGs were gained through the intersection between DEGs and IRGs. Next, a total of five biomarkers (MARCO, CXCL6, F3, SLC7A2, and SLC7A1) were acquired via two machine learning algorithms. Infiltrating abundance of 18 immune cells was significantly different between TOF and control groups, such as activated B cells, neutrophil, CD56dim natural killer cells, etc. The TF-mRNA network contained 4 mRNAs, 31 TFs, and 33 edges, for instance, ELF1-CXCL6, CBX8-SLC7A2, ZNF423-SLC7A1, ZNF71-F3. The lncRNA-miRNA-mRNA network was created, containing 4 mRNAs, 4 miRNAs, and 228 lncRNAs. Afterwards, nine SNPs locations were identified in the miRNA-SNP-mRNA network. A total of 21 drugs were predicted, such as ornithine, lysine, arginine, etc.

Conclusions: Our findings detected five inflammation-related biomarkers (MARCO, CXCL6, F3, SLC7A2, and SLC7A1) for TOF, providing a scientific reference for further studies of TOF.

Keywords: Tetralogy of Fallot (TOF); bioinformatics analysis; biomarkers; inflammation; network.


Conflict of interest statement

Conflicts of Interest: All authors have completed the ICMJE uniform disclosure form (available at https://tp.amegroups.com/article/view/10.21037/tp-24-8/coif). The authors have no conflicts of interest to declare.

Figures
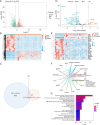
Figure 1
Figure 1
Identification and potential biological significances of DE-IRGs between TOF and control groups. (A) Volcano plot and (B) Heatmap of 971 DEGs between TOF and control groups in GSE36761. The screening criteria are set to adj P<0.05 and |log2FC| >1.5. (C) Venn diagrams for 29 DE-IRGs in TOF. (D) Volcano plot and (E) Heatmap for the expressions of 29 DE-IRGs in GSE36761. (F) Network for the DE-IRGs and targeted GO enrichment terms. (G) The most enriched KEGG terms of 29 DE-IRGs (P value <0.05, count >1). FC, fold change; FDR, false discovery rate; TOF, tetralogy of Fallot; DEGs, differentially expressed genes; DE-IRGs, differential expressed inflammation related genes; GO, Gene Ontology; KEGG, Kyoto Encyclopedia of Genes and Genomes.
Figure 2
Figure 2
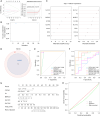
Five biomarkers was selected and construction of the nomogram in TOF. (A) Cross-validation for tuning parameter selection in the LASSO model and five characteristic genes were identified. (B) Cross-validation for tuning parameter selection in the RF model. (C) RF model was conducted to screen eight characteristic genes based on the importance ranks of features. (D) Venn diagrams for five biomarkers in TOF. (E) ROC curves for predictive performance of five biomarkers in GSE36761. (F) ROC curves for predictive performance of five biomarkers in the GSE35776 cohorts. (G) Nomogram was constructed based on five biomarkers. (H) Calibration curve of nomogram. TOF, tetralogy of Fallot; RF, random forest; LASSO, least absolute shrinkage and selection operator; AUC, area under the curve; ROC, receiver operating characteristic.
Figure 3
Figure 3
Immune correlation analysis of five biomarkers in TOF. (A) Heatmap of 28 immune cells proportions in the TOF and control samples of GSE36761. (B) Violin plot for differences in 28 immune cells proportions in the TOF and control samples (Wilcoxon test). (C) Correlation heatmap of biomarkers and significantly differential immune cells in TOF. *, P<0.05; **, P<0.01; ***, P<0.001; ****, P<0.0001; ns, no significance. TOF, tetralogy of Fallot; MDSC, myeloid-derived suppressor cell.
Figure 4
Figure 4
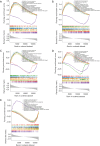
GSEA of five biomarkers (top 10 GO items). (A) MARCO, (B) CXCL6, (C) SLC7A1, (D) SLC7A2, (E) F3. GSEA, gene set enrichment analysis; GO, Gene Ontology.
Figure 5
Figure 5
GSEA results of five biomarkers (top 10 KEGG pathways). (A) MARCO, (B) CXCL6, (C) SLC7A1, (D) SLC7A2, (E) F3. GSEA, gene set enrichment analysis; KEGG, Kyoto Encyclopedia of Genes and Genomes.
Figure 6
Figure 6
Prediction of the miRNA and lncRNA targeting biomarker. Venn diagrams of the predicted (A) miRNAs and (B) lncRNAs common to miRWalk and starbase databases. (C) The ceRNA network targeting key genes. Red represents biomarker, green represents miRNA, blue represents lncRNA. ceRNA, competitive endogenous RNA.
Figure 7
Figure 7
The TFs-mRNA network targeting key genes. Red represents biomarker, yellow represents TF. TFs, transcription factors.
Figure 8
Figure 8
The miRNA-SNP-mRNA network targeting biomarkers. Red represents biomarker, green represents miRNA, yellow represents SNP location. SNP, single nucleotide polymorphism.
Figure 9
Figure 9
The gene-drug network targeting biomarkers through Genecards database. Red represents biomarker, green represents drug.
Figure 10
Figure 10
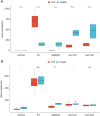
Boxplots for the expression levels of five biomarkers in two TOF-related datasets. (A) GSE36761, (B) GSE35776. *, P<0.05; ***, P<0.001; ****, P<0.0001; ns, no significance. TOF, tetralogy of Fallot.

References

    1. van der Bom T, Bouma BJ, Meijboom FJ, et al. The prevalence of adult congenital heart disease, results from a systematic review and evidence based calculation. Am Heart J 2012;164:568-75. 10.1016/j.ahj.2012.07.023 - DOI - PubMed
    1. van der Linde D, Konings EE, Slager MA, et al. Birth prevalence of congenital heart disease worldwide: a systematic review and meta-analysis. J Am Coll Cardiol 2011;58:2241-7. 10.1016/j.jacc.2011.08.025 - DOI - PubMed
    1. Forman J, Beech R, Slugantz L, et al. A Review of Tetralogy of Fallot and Postoperative Management. Crit Care Nurs Clin North Am 2019;31:315-28. 10.1016/j.cnc.2019.05.003 - DOI - PubMed
    1. Bittel DC, Zhou XG, Kibiryeva N, et al. Ultra high-resolution gene centric genomic structural analysis of a non-syndromic congenital heart defect, Tetralogy of Fallot. PLoS One 2014;9:e87472. 10.1371/journal.pone.0087472 - DOI - PMC - PubMed
    1. Kan Z, Yan W, Wang N, et al. Identification of circRNA-miRNA-mRNA Regulatory Network and Crucial Signaling Pathway Axis Involved in Tetralogy of Fallot. Front Genet 2022;13:917454. 10.3389/fgene.2022.917454 - DOI - PMC - PubMed

LinkOut - more resources