

Integrative approach to pedobarography and pelvis-trunk motion for knee osteoarthritis detection and exploration of non-radiographic rehabilitation monitoring
- PMID: 39144481
- PMCID: PMC11321954
- DOI: 10.3389/fbioe.2024.1401153
Integrative approach to pedobarography and pelvis-trunk motion for knee osteoarthritis detection and exploration of non-radiographic rehabilitation monitoring
Abstract
Background: Osteoarthritis (OA) is a highly prevalent global musculoskeletal disorder, and knee OA (KOA) accounts for four-fifths of the cases worldwide. It is a degenerative disorder that greatly affects the quality of life. Thus, it is managed through different methods, such as weight loss, physical therapy, and knee arthroplasty. Physical therapy aims to strengthen the knee periarticular muscles to improve joint stability.
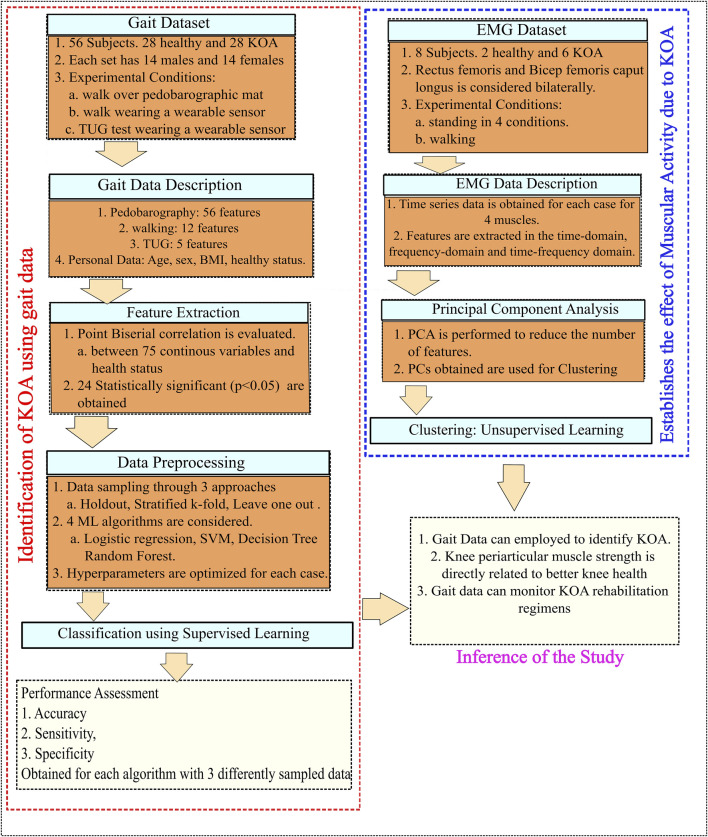
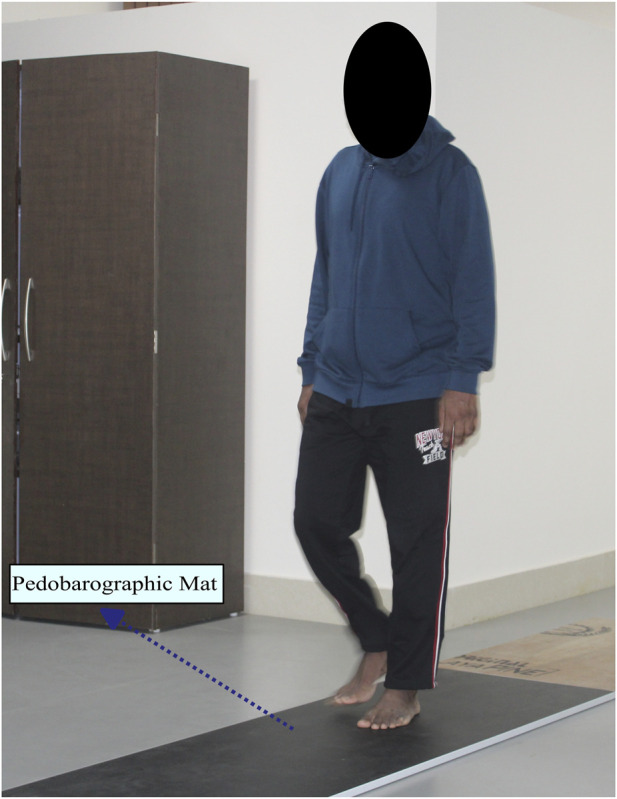
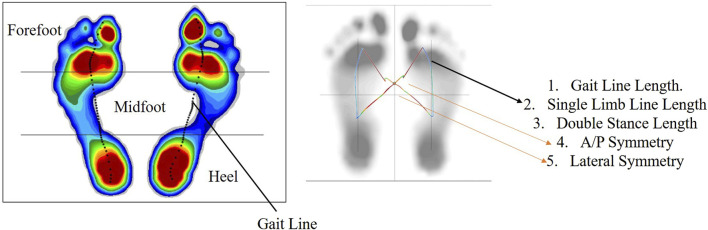
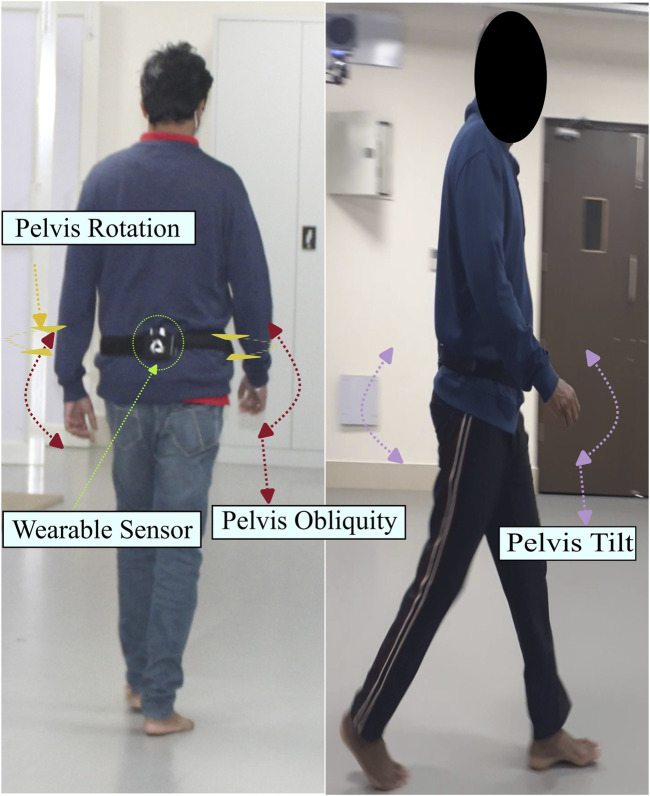
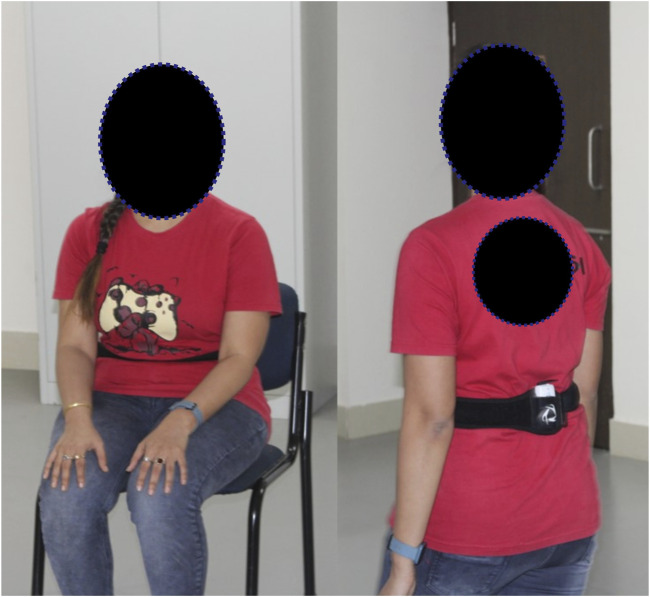
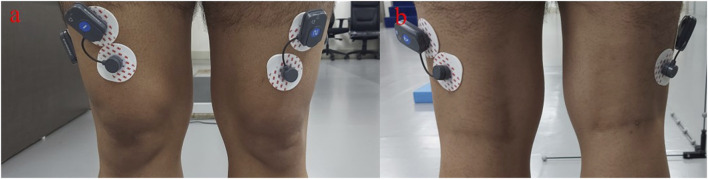
Methods: Pedobarographic data and pelvis and trunk motion of 56 adults are recorded. Among them, 28 subjects were healthy, and 28 subjects were suffering from varying degrees of KOA. Age, sex, BMI, and the recorded variables are used together to identify subjects with KOA using machine learning (ML) models, namely, logistic regression, SVM, decision tree, and random forest. Surface electromyography (sEMG) signals are also recorded bilaterally from two muscles, the rectus femoris and biceps femoris caput longus, bilaterally during various activities for two healthy and six KOA subjects. Cluster analysis is then performed using the principal components obtained from time-series features, frequency features, and time-frequency features.
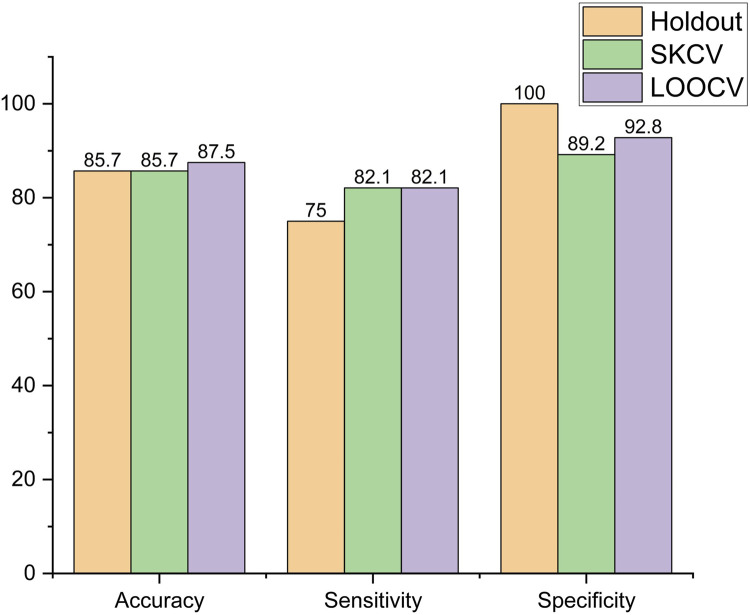
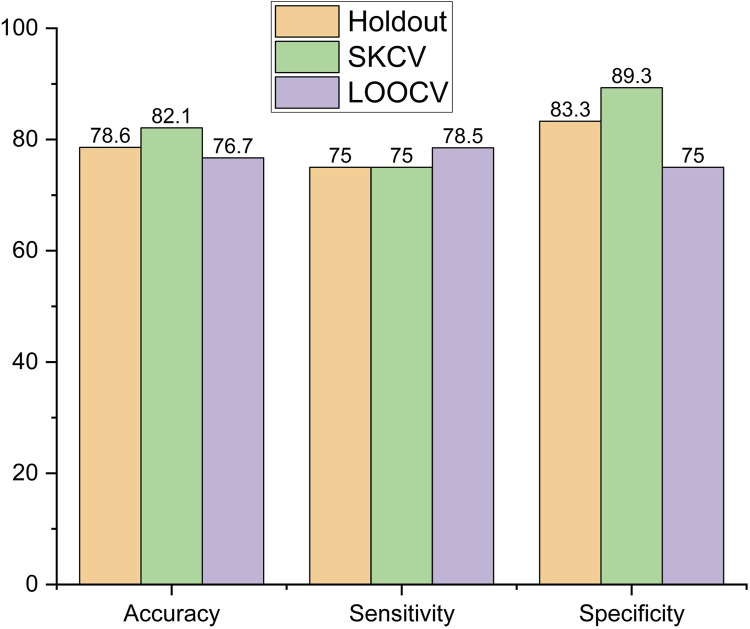
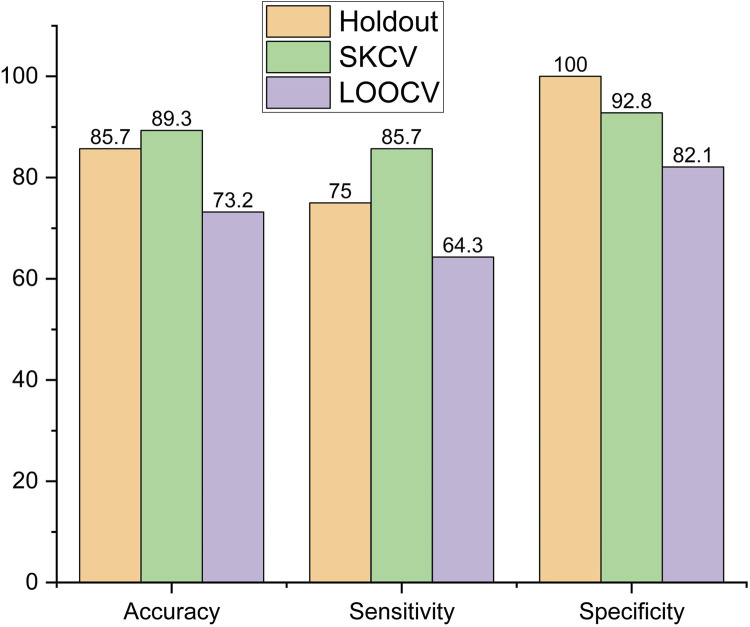
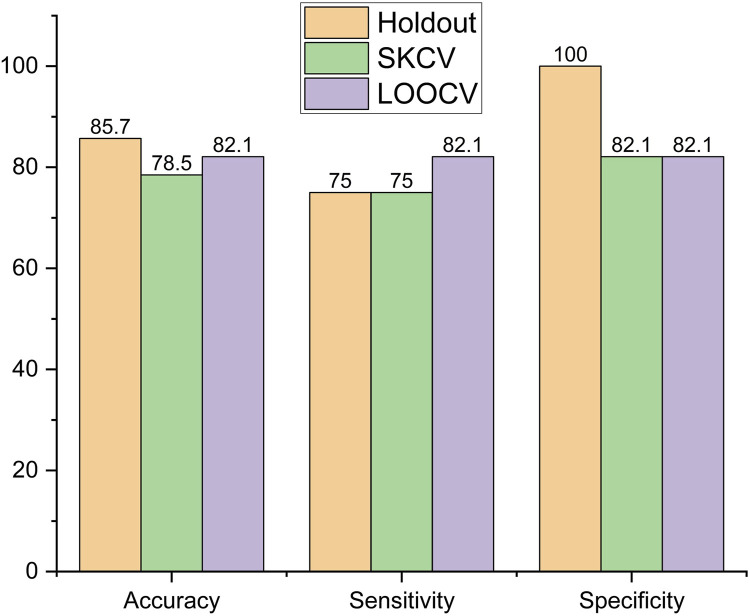
Results: KOA is successfully identified using the pedobarographic data and the pelvis and trunk motion with the highest accuracy and sensitivity of 89.3% and 85.7%, respectively, using a decision tree classifier. In addition, sEMG data have been successfully used to cluster healthy subjects from KOA subjects, with wavelet analysis features providing the best performance for the standing activity under different conditions.
Conclusion: KOA is detected using gait variables not directly related to the knee, such as pedobarographic measurements and pelvis and trunk motion captured by pedobarography mats and wearable sensors, respectively. KOA subjects are also distinguished from healthy individuals through clustering analysis using sEMG data from knee periarticular muscles during walking and standing. Gait data and sEMG complement each other, aiding in KOA identification and rehabilitation monitoring. It is important because wearable sensors simplify data collection, require minimal sample preparation, and offer a non-radiographic, safe method suitable for both laboratory and real-world scenarios. The decision tree classifier, trained with stratified k-fold cross validation (SKCV) data, is observed to be the best for KOA identification using gait data.
Keywords: disease identification; knee osteoarthritis; non-radiographic; pedobarography; rehabilitation; surface electromyography; wearable sensor.
Copyright © 2024 Sarmah, Boruah, Ito and Kanagaraj.
Conflict of interest statement
The authors declare that the research was conducted in the absence of any commercial or financial relationships that could be construed as a potential conflict of interest.
Figures
References
LinkOut - more resources
Full Text Sources