. 2024 Aug 14;11(8):240724.
doi: 10.1098/rsos.240724. eCollection 2024 Aug.

Assessing patterns of metazoans in the global ocean using environmental DNA

Affiliations

Assessing patterns of metazoans in the global ocean using environmental DNA

Nathan R Geraldi et al. R Soc Open Sci. .

Abstract

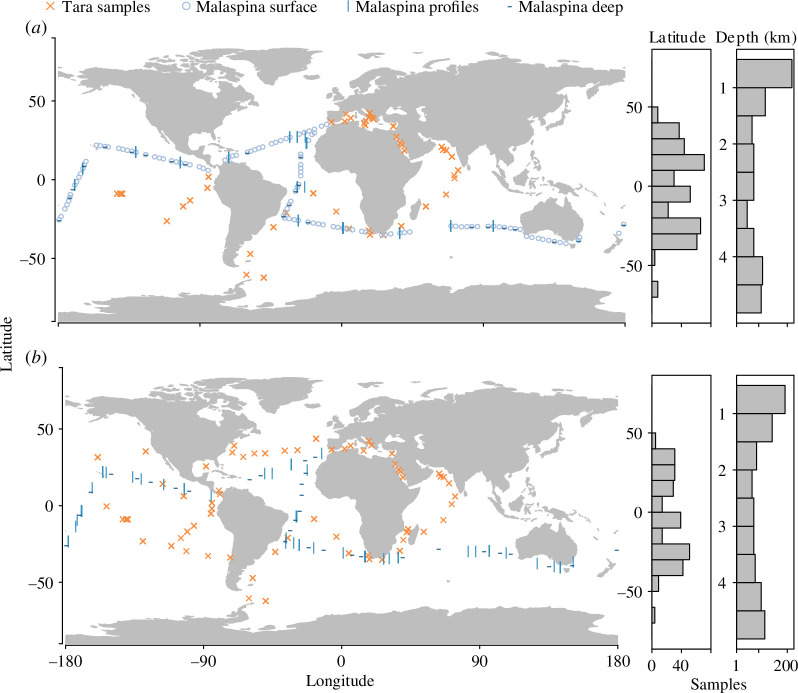
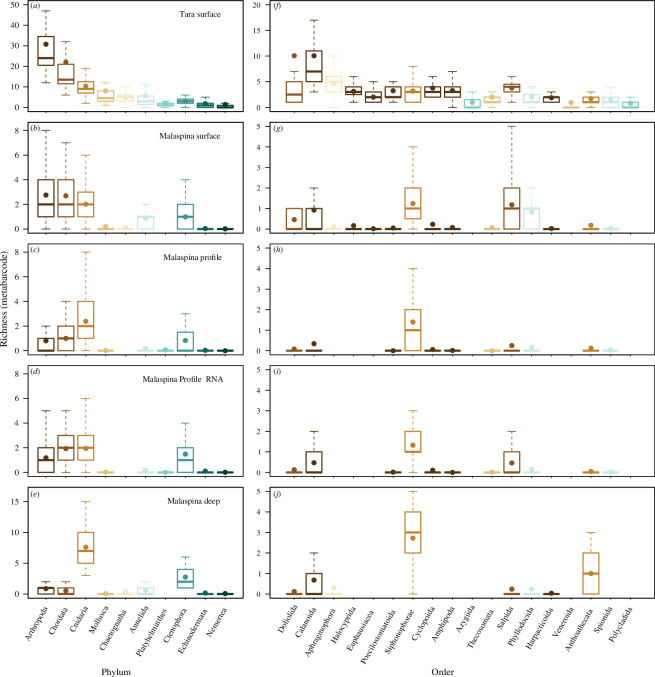
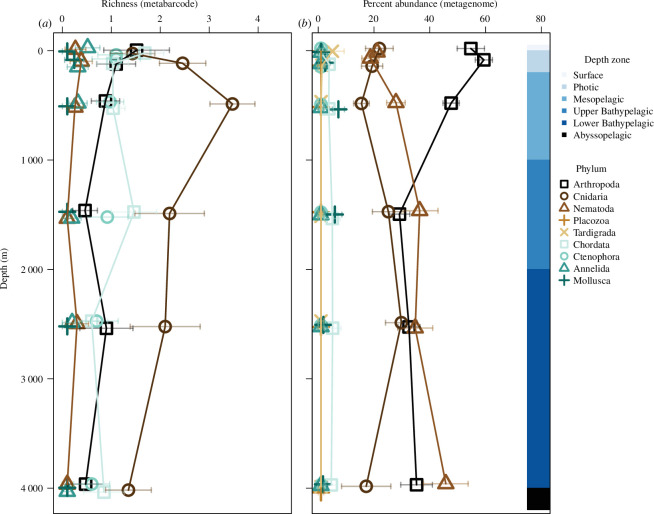
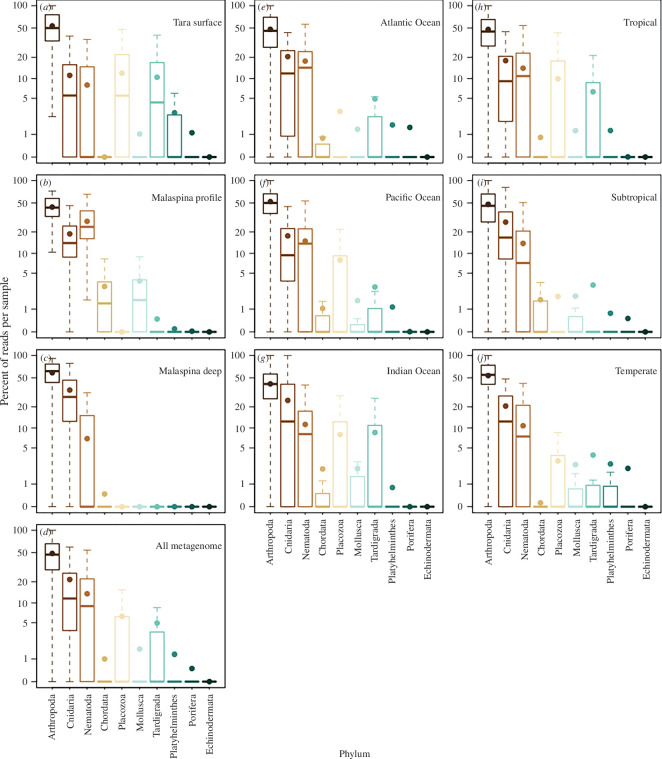
Documenting large-scale patterns of animals in the ocean and determining the drivers of these patterns is needed for conservation efforts given the unprecedented rates of change occurring within marine ecosystems. We used existing datasets from two global expeditions, Tara Oceans and Malaspina, that circumnavigated the oceans and sampled down to 4000 m to assess metazoans from environmental DNA (eDNA) extracted from seawater. We describe patterns of taxonomic richness within metazoan phyla and orders based on metabarcoding and infer the relative abundance of phyla using metagenome datasets, and relate these data to environmental variables. Arthropods had the greatest taxonomic richness of metazoan phyla at the surface, while cnidarians had the greatest richness in pelagic zones. Half of the marine metazoan eDNA from metagenome datasets was from arthropods, followed by cnidarians and nematodes. We found that mean surface temperature and primary productivity were positively related to metazoan taxonomic richness. Our findings concur with existing knowledge that temperature and primary productivity are important drivers of taxonomic richness for specific taxa at the ocean's surface, but these correlations are less evident in the deep ocean. Massive sequencing of eDNA can improve understanding of animal distributions, particularly for the deep ocean where sampling is challenging.

Keywords: deep sea; diversity; global abundance; metabarcoding; metagenome; metazoan.


Conflict of interest statement

We declare we have no competing interests.

Figures

Sample locations for Tara Oceans and Malaspina global expeditions with sample distribution along latitude and depth shown in the right panels for metabarcode (a) and metagenome (b) datasets.
Figure 1.
Sample locations for Tara Oceans and Malaspina global expeditions with sample distribution along the latitude and depth are shown in the right panels for metabarcode (a) and metagenome (b) datasets.
Taxonomic richness of metazoan phyla (a:e) and orders (f:j) with the greatest taxonomic richness from metabarcode data. Phyla or orders are organized from greatest to least rich (means)
Figure 2.
Taxonomic richness of metazoan phyla (a–e) and orders (f–j) with the greatest taxonomic richness from metabarcode data. Phyla or orders are organized from greatest to least rich (means). Plots show Tara Ocean samples (a and f), Malaspina surface samples (b and g), Malaspina profile samples for eDNA (c and h) and eRNA (d and i) and Malaspina deep samples (e and j). Only data from comparable filtered size fractions were included (0.2 – 0.8 and 0.2 – 3 μm size fractions for Malaspina datasets, and approx. 0.2 – 4.5 μm size fraction for Tara Oceans). The colour of the boxes in the second column indicates what phylum the order is in following the left column. Boxplots, based on per sample taxonomic richness, show the median with the upper and lower quartiles, while the whiskers extend to the extreme data point but no more than 1.5 times the respective quartile. The mean is indicated by the circle.
Taxonomic richness (a) and per cent abundance (b) of sequences within metazoan phyla from the ocean’s surface to the abyssopelagic
Figure 3.
Taxonomic richness (a) and per cent abundance (b) of sequences within metazoan phyla from the ocean’s surface to the abyssopelagic. Taxonomic richness was from metabarcode data and abundance was from metagenome data, all from the Malaspina profile dataset (0.2–3 μm filtered size fractions). Phyla are indicated by shape and colour. The mean taxonomic richness or per cent abundance of samples within the respective categories is shown with symbols along with the standard error indicated by horizontal bars.
Mean abundance (expressed as percent of reads per sample of metazoan marker gene sequences from metagenomic dataset) of the taxa identified by the two expeditions
Figure 4.
Mean abundance (expressed as the percentage of reads per sample of metazoan marker gene sequences from the metagenomic dataset) of the taxa identified by the two expeditions. Phyla shown are sorted based on highest medians. Plots show Tara Ocean samples (a), Malaspina profile samples (b) and Malaspina deep samples (c), all metagenome samples (d), all metagenome data from different ocean basins (e–g) and all metagenome data by latitudinal categories (h–j). Boxplots, based on per sample data across all samples, show the median with the upper and lower quartiles, while the whiskers extend to the extreme data point but no more than 1.5 times the respective quartile. The mean is indicated by the circle. Only data from comparable filtered size fractions were included (0.2–0.8 and 0.2–3 μm size fractions for Malaspina deep and profile datasets respectively and approx. 0.2–4.5 μm size fraction for Tara Oceans).

Similar articles

References

    1. Díaz S, et al. . 2019. Pervasive human-driven decline of life on earth points to the need for transformative change. Science 366 , eaax3100. (10.1126/science.aax3100) - DOI - PubMed
    1. McCauley DJ, Pinsky ML, Palumbi SR, Estes JA, Joyce FH, Warner RR. 2015. Marine defaunation: animal loss in the global ocean. Science 347 , 1255641. (10.1126/science.1255641) - DOI - PubMed
    1. Martin A, et al. . 2020. The oceans’ twilight zone must be studied now, before it is too late. Nature 580 , 26–28. (10.1038/d41586-020-00915-7) - DOI - PubMed
    1. Danovaro R, et al. . 2020. Ecological variables for developing a global deep-ocean monitoring and conservation strategy. Nat. Ecol. Evol. 4 , 181–192. (10.1038/s41559-019-1091-z) - DOI - PubMed
    1. Webb TJ, Vanden Berghe E, O’Dor R. 2010. Biodiversity’s big wet secret: the global distribution of marine biological records reveals chronic under-exploration of the deep pelagic ocean. PLoS One 5 , e10223. (10.1371/journal.pone.0010223) - DOI - PMC - PubMed

LinkOut - more resources