

Characterizing offshore polar ocean soundscapes using ecoacoustic intensity and diversity metrics
- PMID: 39144498
- PMCID: PMC11323090
- DOI: 10.1098/rsos.231917
Characterizing offshore polar ocean soundscapes using ecoacoustic intensity and diversity metrics
Abstract
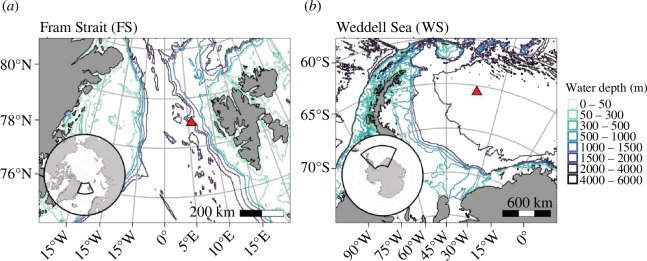
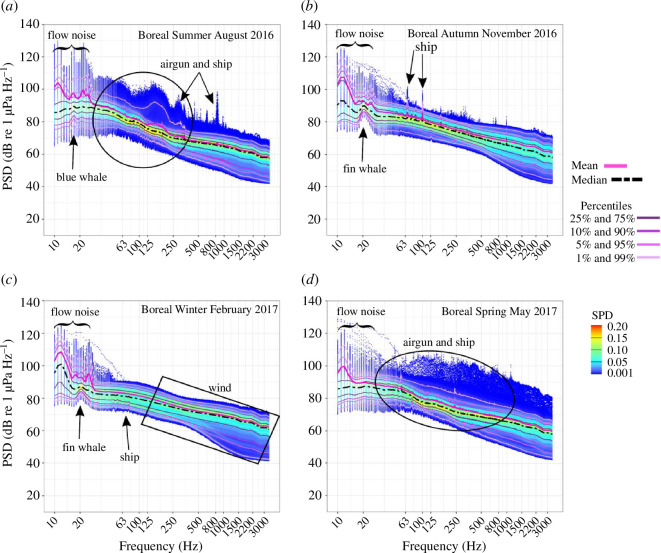
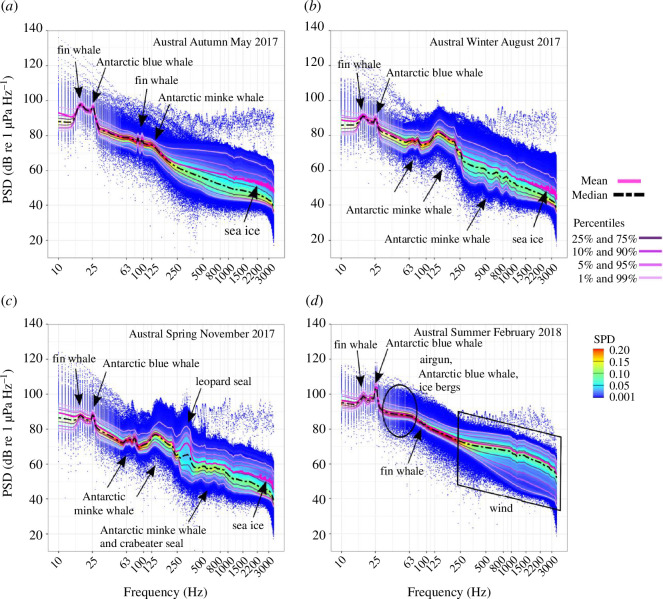
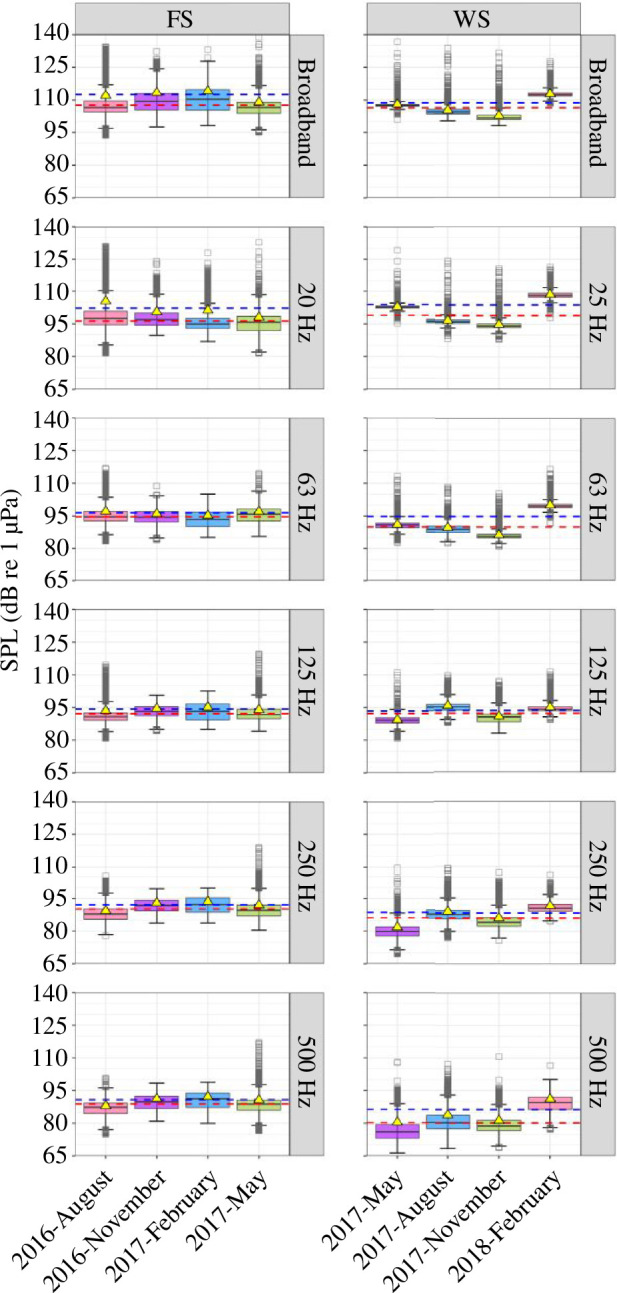
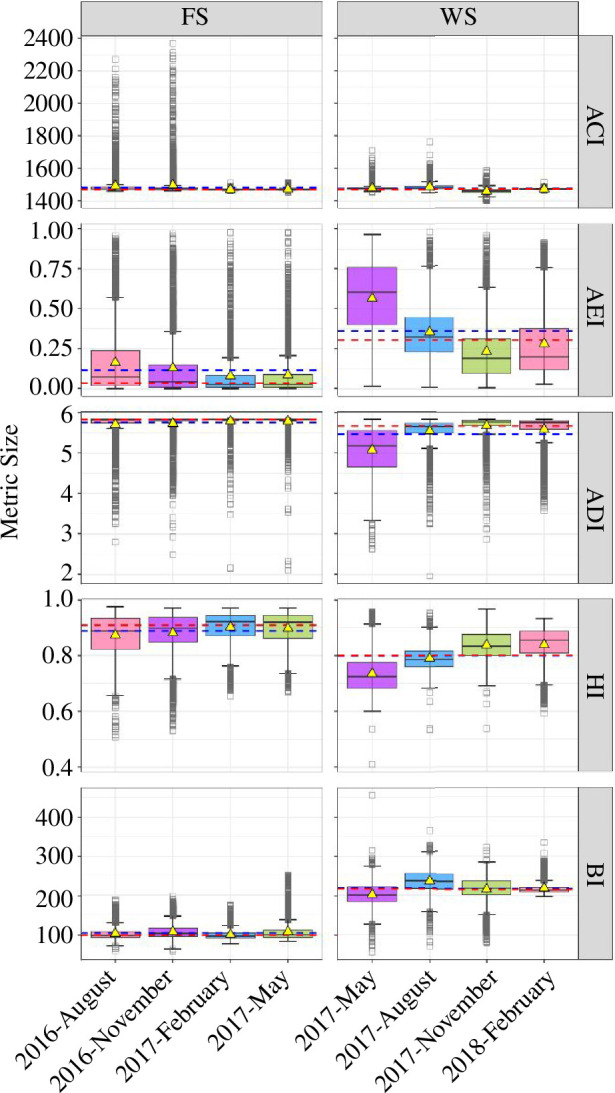
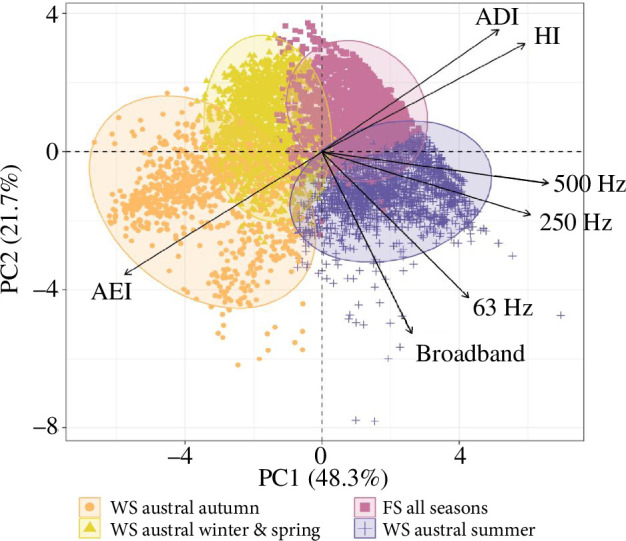
Polar offshore environments are considered the last pristine soundscapes, but accelerating climate change and increasing human activity threaten their integrity. In order to assess the acoustic state of polar oceans, there is the need to investigate their soundscape characteristics more holistically. We apply a set of 14 ecoacoustic metrics (EAMs) to identify which metrics are best suited to reflect the characteristics of disturbed and naturally intact polar offshore soundscapes. We used two soundscape datasets: (i) the Arctic eastern Fram Strait (FS), which is already impacted by anthropogenic noise, and (ii) the quasi-pristine Antarctic Weddell Sea (WS). Our results show that EAMs when applied in concert can be used to quantitatively assess soundscape variability, enabling the appraisal of marine soundscapes over broad spatiotemporal scales. The tested set of EAMs was able to show that the eastern FS, which is virtually free from sea ice, lacks seasonal soundscape dynamics and exhibits low acoustic complexity owing to year-round wind-mediated sounds and anthropogenic noise. By contrast, the WS exhibits pronounced seasonal soundscape dynamics with greater soundscape heterogeneity driven in large part by the vocal activity of marine mammal communities, whose composition in turn varies with the prevailing seasonal sea ice conditions.
Keywords: MANTA software; marine mammals; one-third-octave-level bands (TOL); passive acoustic monitoring (PAM); sea ice; underwater ambient noise levels.
© 2024 The Authors.
Conflict of interest statement
We declare we have no competing interests.
Figures
Similar articles
-
MASE: An Instrument Designed to Record Underwater Soundscape.Sensors (Basel). 2022 Apr 29;22(9):3404. doi: 10.3390/s22093404. Sensors (Basel). 2022. PMID: 35591094 Free PMC article.
-
Marine soundscape and fish biophony of a Mediterranean marine protected area.PeerJ. 2021 Dec 15;9:e12551. doi: 10.7717/peerj.12551. eCollection 2021. PeerJ. 2021. PMID: 35003918 Free PMC article.
-
An integrated underwater soundscape analysis in the Bering Strait region.J Acoust Soc Am. 2021 Sep;150(3):1883. doi: 10.1121/10.0006099. J Acoust Soc Am. 2021. PMID: 34598647
-
Ecoacoustic codes and ecological complexity.Biosystems. 2018 Feb;164:147-154. doi: 10.1016/j.biosystems.2017.09.003. Epub 2017 Sep 5. Biosystems. 2018. PMID: 28887176 Review.
-
Climate change and Southern Ocean ecosystems I: how changes in physical habitats directly affect marine biota.Glob Chang Biol. 2014 Oct;20(10):3004-25. doi: 10.1111/gcb.12623. Epub 2014 Jun 30. Glob Chang Biol. 2014. PMID: 24802817 Review.
References
-
- Madsen PT, Wahlberg M, Møhl B. 2002. Male sperm whale (Physeter macrocephalus) acoustics in a high-latitude habitat: implications for echolocation and communication. Behav. Ecol. Sociobiol. 53, 31–41. (10.1007/s00265-002-0548-1) - DOI
-
- Rowe S, Hutchings JA. 2006. Sound production by Atlantic cod during spawning. Trans. Am. Fish. Soc. 135, 529–538. (10.1577/T04-061.1) - DOI
-
- Pysanczyn JW, Williams EA, Brodrick E, Robert D, Craggs J, Marhaver KL, Simpson SD. 2023. The role of acoustics within the sensory landscape of coral larval settlement. Front. Mar. Sci. 10, 1111599. (10.3389/fmars.2023.1111599) - DOI
-
- Solé M, et al. . 2023. Marine invertebrates and noise. Front. Mar. Sci. 10, 1129057. (10.3389/fmars.2023.1129057) - DOI
Associated data
LinkOut - more resources
Full Text Sources
Miscellaneous
