. 2024 Jul 25;6(4):fcae244.
doi: 10.1093/braincomms/fcae244. eCollection 2024.

Inhibition of PHLDA3 expression in human superoxide dismutase 1-mutant amyotrophic lateral sclerosis astrocytes protects against neurotoxicity

Affiliations

Inhibition of PHLDA3 expression in human superoxide dismutase 1-mutant amyotrophic lateral sclerosis astrocytes protects against neurotoxicity

Kornélia Szebényi et al. Brain Commun. .

Abstract

Pleckstrin homology-like domain family A-member 3 (PHLDA3) has recently been identified as a player in adaptive and maladaptive cellular stress pathways. The outcome of pleckstrin homology-like domain family A-member 3 signalling was shown to vary across different cell types and states. It emerges that its expression and protein level are highly increased in amyotrophic lateral sclerosis (ALS) patient-derived astrocytes. Whether it orchestrates a supportive or detrimental function remains unexplored in the context of neurodegenerative pathologies. To directly address the role of pleckstrin homology-like domain family A-member 3 in healthy and ALS astrocytes, we used overexpression and knockdown strategies. We generated cultures of primary mouse astrocytes and also human astrocytes from control and ALS patient-derived induced pluripotent stem cells harbouring the superoxide dismutase 1 mutation. Then, we assessed astrocyte viability and the impact of their secretome on oxidative stress responses in human stem cell-derived cortical and spinal neuronal cultures. Here, we show that PHLDA3 overexpression or knockdown in control astrocytes does not significantly affect astrocyte viability or reactive oxygen species production. However, PHLDA3 knockdown in ALS astrocytes diminishes reactive oxygen species concentrations in their supernatants, indicating that pleckstrin homology-like domain family A-member 3 can facilitate stress responses in cells with altered homeostasis. In support, supernatants of PHLDA3-silenced ALS and even control spinal astrocytes with a lower pleckstrin homology-like domain family A-member 3 protein content could prevent sodium arsenite-induced stress granule formation in spinal neurons. Our findings provide evidence that reducing pleckstrin homology-like domain family A-member 3 levels may transform astrocytes into a more neurosupportive state relevant to targeting non-cell autonomous ALS pathology.

Keywords: PHLDA3; amyotrophic lateral sclerosis; astrocyte; astrocyte–neuron interaction; cell stress.


Conflict of interest statement

A.L. is a scientific consultant to Tachyon Ventures, a venture capital firm (Los Angeles, CA, USA). However, the consultancy is not pertinent to the work presented in this manuscript. The rest of the authors declare no conflict of interest.

Figures

Graphical Abstract
Graphical Abstract
Figure 1
Figure 1
PHLDA3 overexpression does not induce mouse astrocyte nuclear pyknosis. (A) Schematic of astrocyte transfection strategy (left), using the pCMV-GFP or pCMV-PHLDA3-GFP expression plasmid. Assays were evaluated 48 h posttransfection. Graph (right) shows the percentages of GFP+-transfected cells against the percentage of pyknotic nuclei out of total nuclei counts, using various concentration ratios of Lipofectamine 2000 and plasmid DNA. Data expressed as mean ± SD. (B) Representative immunofluorescence images of transfected astrocytes stained for GFP (arrows indicate pyknotic cells). Graph demonstrates the percentage of pyknotic GFP+ cells determined at the optimal lipofectamine (1 μl/ml)/DNA (2 μg/ml) concentration. Scale bars: 60 µm (30 µm for insets). n = 5 independently transfected cultures; unpaired two-tailed t-test; data are expressed as mean ± SEM. For further statistical details, see Supplementary Table 2.
Figure 2
Figure 2
PHLDA3 overexpression does not alter mouse astrocyte (AC) viability and pAkt/Akt protein-level ratios. (A) Representative immunofluorescence images showing PHLDA3+ and GFAP+ (upper panel) or GFP+ double-labelled cells (lower panel) in purified AC cultures transfected with pCMV-PHLDA3-GFP. Scale bars: 40 µm. (B) WBs displaying PHLDA3 and β-actin+ bands for lysates of non-transfected or transfected ACs with the pCMV-GFP or pCMV-empty control or the pCMV-PHLDA3-GFP vector. PHLDA3 labelling corresponds with the GFP-fusion protein (∼42 kDa, left-sided panel) and with the non-fused or endogenous protein (15 kDa, right-sided panel). Graph represents the Phlda3+ band densities normalized to the non-transfected group and to β-actin in each blot. n = 3 independent cultures; unpaired two-tailed t-test; data are expressed as mean ± SEM. (C) Graph represents normalized signal intensities in the alamarBlue™ viability assay. n = 4 independent cultures; unpaired two-tailed t-test; data are expressed as mean ± SEM. (D) Schematic of a previously demonstrated signalling route for Phlda3. WBs demonstrating immunoreactive bands for pAkt, Akt and β-actin for lysates of non-transfected or transfected ACs with the pCMV-empty or the pCMV-PHLDA3-GFP vector. Graph represents the ratios of pAkt/Akt band densities normalized to the non-transfected group and to β-actin in each blot. n = 3 independent cultures; unpaired two-tailed t-test; data are expressed as mean ± SEM. For further statistical details, see Supplementary Table 2. For full WB scans, see Supplementary Figs. 1 and 2.
Figure 3
Figure 3
PHLDA3 protein-level changes do not influence human control astrocyte (AC) ROS production or viability. (A) Schematic illustration of iPSC-derived spinal AC generation. (B) WBs displaying PHLDA3 and β-actin-positive bands for lysates of non-transfected or transfected control ACs with the pCMV-GFP control or the pCMV-PHLDA3-GFP vector. PHLDA3 labelling corresponds with the GFP-fusion protein (∼42 kDa). n = 3 independent cultures. Assays were performed 48 posttransfection. (C) Graphs represent normalized ROS levels measured by the ROS-Glo assay (left) and PrestoBlue™ intensity values (right) per culture. n = 3 and 6 independent cultures, respectively; one-way ANOVA. (D) WBs displaying bands for PHLDA3 and β-actin for protein lysates of non-treated, scrambled (scr) siRNA- and PHLDA3 siRNA-treated control ACs. Graph illustrates normalized band densities for each group. n = 3 independent cultures; one-way ANOVA with Dunnet's post hoc test. Assays were performed 72 h posttransfection. (E) Graphs represent normalized ROS levels (left) measured by the ROS-Glo assay and PrestoBlue™ intensity values (right) per culture of non-treated, scr siRNA- and PHLDA3 siRNA-treated control ACs. n = 4 independent cultures; one-way ANOVA with overall P-value (left) and Tukey's post hoc test (right). Data are expressed as mean ± SEM for all graphs. For further statistical details, see Supplementary Table 2. For full WB scans, see Supplementary Figs. 3 and 4.
Figure 4
Figure 4
PHLDA3-KD diminishes ROS production in human SOD1 ALS astrocytes (ACs). (A) Representative immunofluorescence images of control and SOD1 ALS ACs, demonstrating nuclear (arrows in upper panel) and cytoplasmic (arrows in lower panel) distribution of PHLDA3 IR in GFAP+ ACs. Digital images (right) represent area segmentations for cytoplasmic and nuclear PHLDA3 IR measurements based on DAPI and phalloidin staining. Scale bars: 40 µm. Graphs show the ratio of cytoplasmic/nuclear density of PHLDA3 IR in control and SOD1 ALS AC. n = 6 cultures; unpaired two-tailed t-test. (B) WBs displaying bands for PHLDA3 and β-actin for protein lysates of control and SOD1 ALS ACs. Graph illustrates normalized band densities for each group. n = 3 independent cultures; unpaired two-tailed t-test. (C) Graphs represent normalized ROS levels (left) measured by the ROS-Glo assay and PrestoBlue™ intensity values (right) per culture of control and SOD1 ALS ACs. n = 4 independent cultures; unpaired two-tailed t-test. (D) WBs displaying bands for PHLDA3 and β-actin for protein lysates of non-treated, scr siRNA- and PHLDA3 siRNA-treated SOD1 ALS ACs. Graph illustrates normalized band densities for each group. n = 3 independent cultures; one-way ANOVA with Dunnet's post hoc test. (E) Graphs represent normalized ROS levels (left) measured by the ROS-Glo assay and PrestoBlue™ intensity values (right) per culture of non-treated, scr siRNA- and PHLDA3 siRNA-treated SOD1 ALS ACs. n = 5 independent cultures; one-way ANOVA with Dunnett's post hoc test (left) and overall ANOVA P-value (right). Data are expressed as mean ± SEM for all graphs. For further statistical details, see Supplementary Table 2. For full WB scans, see Supplementary Figs. 5 and 6.
Figure 5
Figure 5
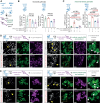
SA-induced human cortical neuronal SG formation is diminished by ACM produced by PHLDA3-KD ALS astrocytes (ACs). (A) Schematic illustration of hiPSC-derived cortical i3N neuron culture generation and experimental strategy. (B) Representative immunofluorescence images of human i3N neurons with or without SA treatment for 1 h following incubation for 3 h in ACM of scrambled (scr) siRNA- or PHLDA3 siRNA-transfected human SOD1 ALS ACs, displaying stress granule marker (G3BP1) and NeuN IR and DAPI staining (arrows indicate pyknotic nuclei). Scale bars: 20 μm. Insets represent magnified G3BP1 immunoreactive areas (dashed yellow squares) and SG deposits (arrows). Scale bars: 50 μm. (C) Graphs represent the percentage of pyknosis in scr siRNA-ACM- and PHLDA3 siRNA-ACM-treated NeuN+ neurons per culture. n = 4 independent cultures; one-way ANOVA. (D) Graphs represent the number of G3BP1+ SGs in cultures of scr siRNA-ACM- and PHLDA3 siRNA-ACM-treated neurons in NeuN+ neurons per culture. n = 4 independent cultures; one-way ANOVA with Tukey's post hoc test. Data are expressed as mean ± SEM for all graphs. For further statistical details, see Supplementary Table 2.
Figure 6
Figure 6
Human spinal neuronal SG formation is increased by ACM produced by human spinal SOD1 ALS astrocytes (ACs). (A) Schematic illustration of hiPSC-derived spinal neuron culture generation. Representative immunofluorescence images show ChAT+ positive spinal neurons with corresponding DAPI staining. Scale bars: 10 μm. (B) Experimental strategy. (C) Graphs represent the percentage of G3BP1+ SGs (left) and nuclear pyknosis (right) in NeuN+ neurons per culture treated with either control or SOD1 ALS ACM. n = 3 independent cultures; unpaired two-tailed t-test. (D) Representative immunofluorescence images of hiPSC-derived spinal neurons with incubation in either control or SOD1 ALS ACM, displaying SG marker (G3BP1) and NeuN IR and DAPI staining (arrows represent pyknotic nuclei). Scale bars: 40 μm. Inset represents magnified G3BP1 IR areas (dashed square) and SG deposits (arrows). Scale bar: 100 μm. Data are expressed as mean ± SEM for all graphs. For further statistical details, see Supplementary Table 2.
Figure 7
Figure 7
SA-induced human spinal neuronal SG formation is reduced by ACM produced by human spinal PHLDA3-KD astrocytes (ACs). (A) Schematic illustration of experimental strategy. Spinal neurons were exposed to SA treatment or vehicle for 1 h following incubation for 3 h in ACM. Graphs represent the percentage of neuronal pyknosis (B) and G3BP1+ SGs (C) in scrambled (scr) siRNA-ACM- and PHLDA3 siRNA-ACM-treated NeuN+ neurons per culture. n = 3 independent cultures; one-way ANOVA with Tukey's post hoc test (for C). Representative immunofluorescence images of hiPSC-derived spinal neurons with or without SA treatment for 1 h following incubation for 3 h in ACM of scr siRNA- or PHLDA3 siRNA-transfected control (D) and SOD1 ALS ACs (E), displaying SG marker (G3BP1) and NeuN IR and DAPI staining (arrows represent pyknotic nuclei). Scale bars: 40 μm. Insets represent magnified G3BP1 IR areas (dashed squares) and SG deposits (arrows). Scale bars: 100 μm. Data are expressed as mean ± SEM for all graphs. For further statistical details, see Supplementary Table 2.

References

    1. Phatnani H, Maniatis T. Astrocytes in neurodegenerative disease. Cold Spring Harb Perspect Biol. 2015;7(6):1–18. - PMC - PubMed
    1. Vahsen BF, Gray E, Thompson AG, et al. Non-neuronal cells in amyotrophic lateral sclerosis—From pathogenesis to biomarkers. Nat Rev Neurol. 2021;17(6):333–348. - PubMed
    1. Escartin C, Galea E, Lakatos A, et al. Reactive astrocyte nomenclature, definitions, and future directions. Nat Neurosci. 2021;24:312–325. - PMC - PubMed
    1. Smith HL, Freeman OJ, Butcher AJ, et al. Astrocyte unfolded protein response induces a specific reactivity state that causes non-cell-autonomous neuronal degeneration. Neuron. 2020;105(5):855–866.e5. - PMC - PubMed
    1. Szebényi K, Wenger LMD, Sun Y, et al. Human ALS/FTD brain organoid slice cultures display distinct early astrocyte and targetable neuronal pathology. Nat Neurosci. 2021;24(11):1542–1554. - PMC - PubMed

LinkOut - more resources