. 2022 Sep 8;3(1):sgac055.
doi: 10.1093/schizbullopen/sgac055. eCollection 2022 Jan.

A Possible White Matter Compensating Mechanism in the Brain of Relatives of People Affected by Psychosis Inferred from Repeated Long-Term DTI Scans

Affiliations

A Possible White Matter Compensating Mechanism in the Brain of Relatives of People Affected by Psychosis Inferred from Repeated Long-Term DTI Scans

Yaron Caspi. Schizophr Bull Open. .

Abstract

Background and hypothesis: An existing model suggests that some brain features of relatives of people affected by psychosis can be distinguished from both the probands and a control group. Such findings can be interpreted as representing a compensating mechanism.

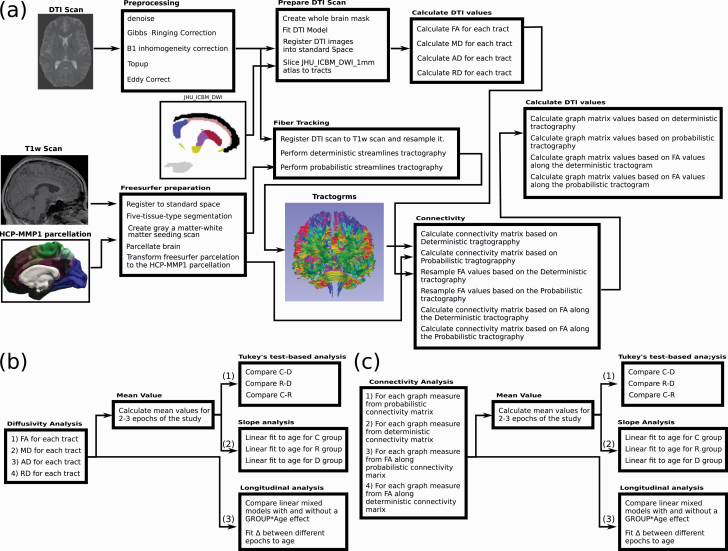
Study design: We studied white matter features using diffusion tensor imaging in a cohort of 82 people affected by psychosis, 122 of their first-degree relatives, and 89 control subjects that were scanned between two to three times with an interval of approximately 3 years between consecutive scans. We measured both fractional anisotropy and other standard diffusivity measures such as axial diffusivity. Additionally, we calculated standard connectivity measures such as path length based on probabilistic or deterministic tractography. Finally, by averaging the values of the different measures over the two or three consecutive scans, we studied epoch-averagely the difference between these three groups.

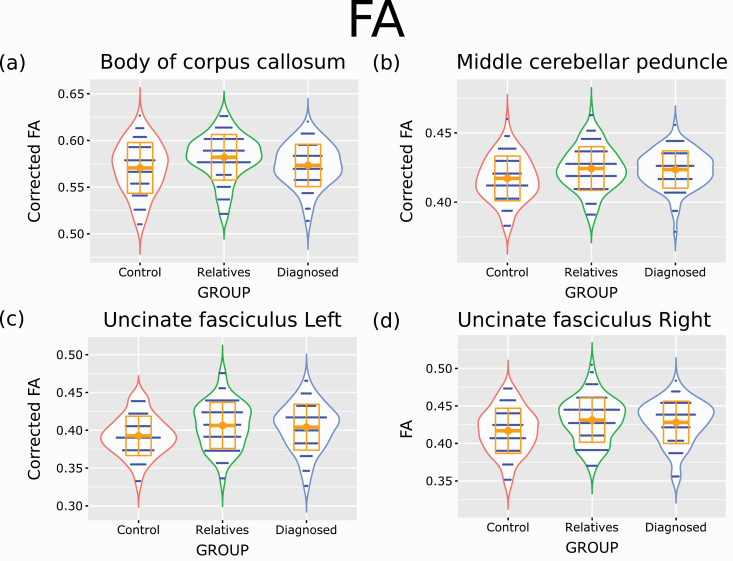
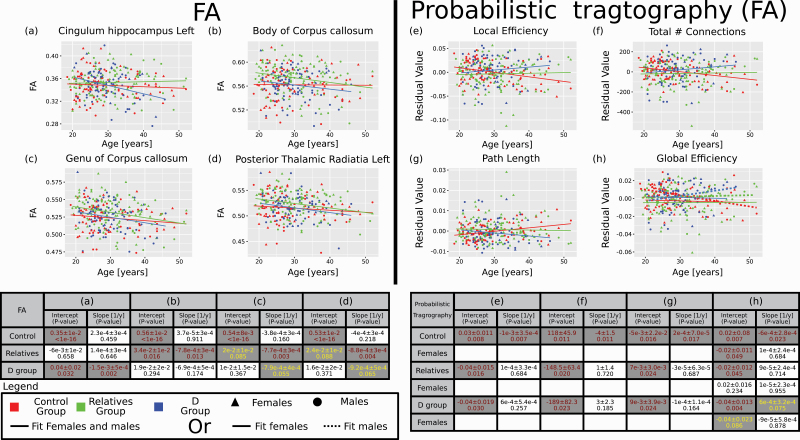
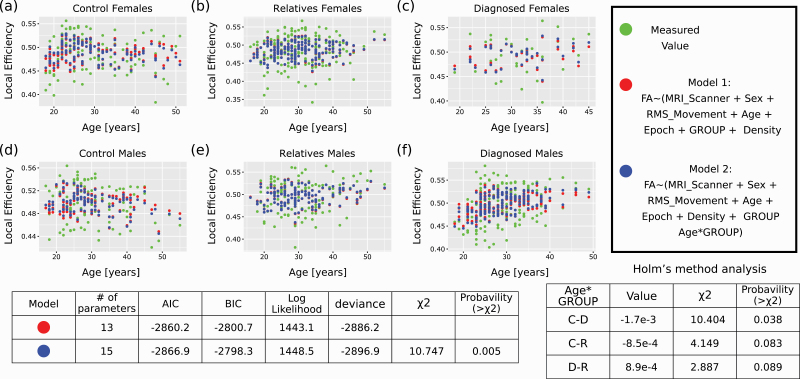
Study results: For several tracts and several connectivity measures, the relatives showed distinct features from both the probands and the control groups. In those cases, the relatives did not necessarily score between the probands and the control group. An aggregate analysis in the form of a group-dependent score for the different modes of the analysis (e.g., for fractional anisotropy) supported this observation.

Conclusions: We interpret these results as evidence supporting a compensation mechanism in the brain of relatives that may be related to resilience that some of them exhibit in the face of the genetic risk they have for being affected by psychosis.

Keywords: connectivity; diffusion tensor imaging; familial risk; first-degree relatives; psychosis; resilience.


Conflict of interest statement

All authors declare no conflict of interests.

Figures

Fig. 1.
Fig. 1.
Summary of processing and analysis pipelines. (a) Summary of the computational pipeline used to processes the scans and calculate form them diffusivity and connectivity values. For calculation we used FSL, MRtrix and FreeSurfer. First, scans are pre-processed to remove distortion. Next, a DTI model is built, and the FA, MD, AD, and RD are calculated for each tract from the JHU ICBM MW atlas. In parallel, tractography is conducted using both deterministic and probabilistic tractography algorithms, and connectivity matrices are calculated based on the HCP-MMP1 parcellation atlas (using the corresponding T1w scan processed via FreeSurfer). In addition, connectivity matrices are calculated for both algorithms by sampling FA values along the tracts. From these four connectivity matrices, several graph matrix measures are calculated (see the Supporting Text at the SI). (b) and (c) Scheme for diffusivity and connectivity data analysis. For each connectivity or diffusivity mode, the average values for all available data for each individual were calculated, and an epoch-averaged Tukey’s Test Analysis and epoch-averaged slope analysis was carried. In parallel, a longitudinal analysis was carried using a linear mixed model and analyzing the difference of the values (Δ). Note that the outliers filtering step is not shown.
Fig. 2.
Fig. 2.
Tukey’s test comparisons analysis of FA results—largest effect. Violin plots for four corrected FA values measures that showed the larges Tukey’s test difference (FDR corrected q-value below 0.05) when comparing one of the three possible comparisons between the different groups. I.e., the control-diagnosed groups, control-relatives groups, and relative-diagnosed groups. Orange squares represent the median data values, and orange boxes represent SD. For the body of the corpus callosum, the figure represents values after correction for sex and age. For the middle cerebellar peduncle and the left uncinate fasciculus the figures represent values after correction for sex alone. No correction was applied for the right uncinate fasciculus.
Fig. 3.
Fig. 3.
Slope analysis—largest scores. Four FA tracts as a function of age (a–d) and four graph matrix values from the FA along the tracts of the probabilistic tractography as a function of age (e–h) that obtained the highest epoch-averaged slope score according to the ordered from (a) to (d) for FA and (e) to (h) for the connectivity. All four connectivity measures were corrected for density and the values represent the residuals after corrections. The tables below the graphs provide fitting parameters with their P-values. Values in the table are for the male and females groups together (a–g) or separately when it is relevant (h). Note that for the relatives and diagnosed groups, the intercept is a relative value to the control group and not an independent number. Similarly, for females, the intercept values are relatives to the males. Slope values represent absolute values. Hence, only values for the slopes were included in the score calculations. In cases where females and males values were fitted separately, solid lines are for the females and dashed lines for the males. In brown—P-values below 0.05. In yellow, P-values between 0.05 and 0.1.
Fig. 4.
Fig. 4.
Longitudinal analysis of local efficiency obtained from sampling the FA values along the probabilistic connectivity tracts. Longitudinal analysis of the local efficiency, the only reliable measure that showed an FDR corrected ANOVA q-value below 0.05 when comparing two linear mixed models. Model (a) in R notation—Local_Efficiency ~ (MRI_Scanner + Sex + RMS_Movement + Age + Epoch + Density + GROUP) + (1 | Family:Subject). Model (b) in R notation—Local_Efficiency ~ (MRI_Scanner + Sex + RMS_Movement + Age + Epoch + Density + GROUP + Age*GROUP) + (1|Family:Subject). (a–c) graphs for females. (d–f) graphs for males. (a, d)—Control group. (b, e)—Relatives group. (c, f)—Diagnosed group. Green dots are the actual values measured (along all three epochs of the study). Red dots are the predictions of model (a). Blue dots are the predictions of model (b). When no red dot is seen, it means that the prediction of model (a) and model (b) were indistinguishable. The tables below the graphs show the ANOVA results between the two models, the Age*GROUP χ2, and the Holm’s method analysis of the Age*GROUP factor. AIC, akaike information criterion; BIC, Bayesian Information Criterion; C-D, difference between the control and D groups; C-R, difference between the control and relatives groups; D-R, difference between the D and relatives groups (note that in this case, C-D and similar notations represent a minus sign, unlike Tukey’s test case).

Similar articles

Cited by

References

    1. Skudlarski P, Schretlen DJ, Thaker GK, et al. . Diffusion tensor imaging white matter endophenotypes in patients with schizophrenia or psychotic bipolar disorder and their relatives. Am J Psychiatry. 2013;170(8):886–898. - PubMed
    1. de Zwarte SMC, Brouwer RM, Tsouli A, et al. . Running in the family? Structural brain abnormalities and IQ in offspring, siblings, parents, and co-twins of patients with schizophrenia. Schizophr Bull. 2018;45(6):1209–1217. - PMC - PubMed
    1. Lichtenstein P, Yip BH, Björk C, et al. . Common genetic determinants of schizophrenia and bipolar disorder in Swedish families: a population-based study. Lancet 2009;373(9659):234–239. - PMC - PubMed
    1. Hilker R, Helenius D, Fagerlund B, et al. . Heritability of schizophrenia and schizophrenia spectrum based on the Nationwide Danish Twin Register. Biol Psychiatry. 2018;83(6):492–498. - PubMed
    1. Kyaga S, Lichtenstein P, Boman M, Hultman C, Långström N, Landén M. Creativity and mental disorder: family study of 300 000 people with severe mental disorder. Br J Psychiatry. 2011;199(5):373–379. - PubMed

LinkOut - more resources