

Effect of CUP1 copy number and pH on copper resistance of Saccharomyces cerevisiae enological strains
- PMID: 39144927
- PMCID: PMC11320302
- DOI: 10.1016/j.heliyon.2024.e34885
Effect of CUP1 copy number and pH on copper resistance of Saccharomyces cerevisiae enological strains
Abstract
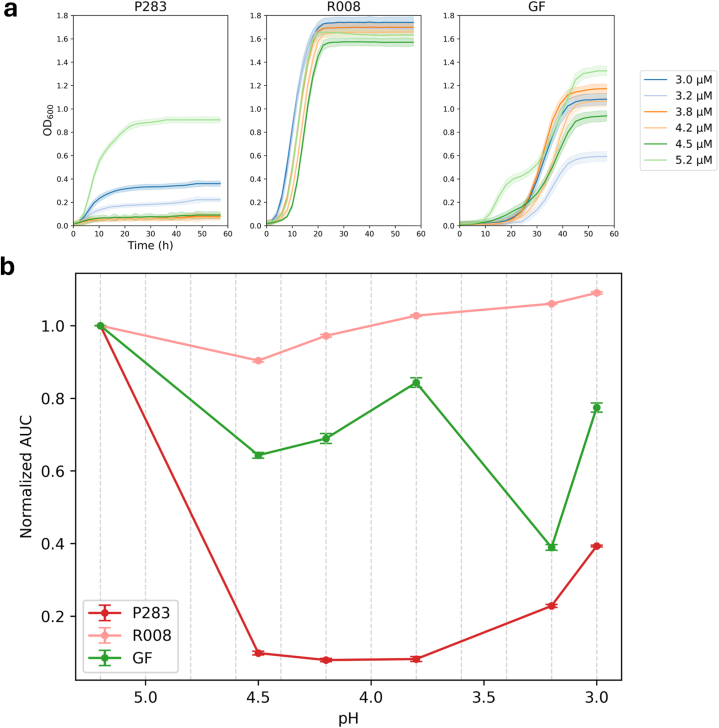
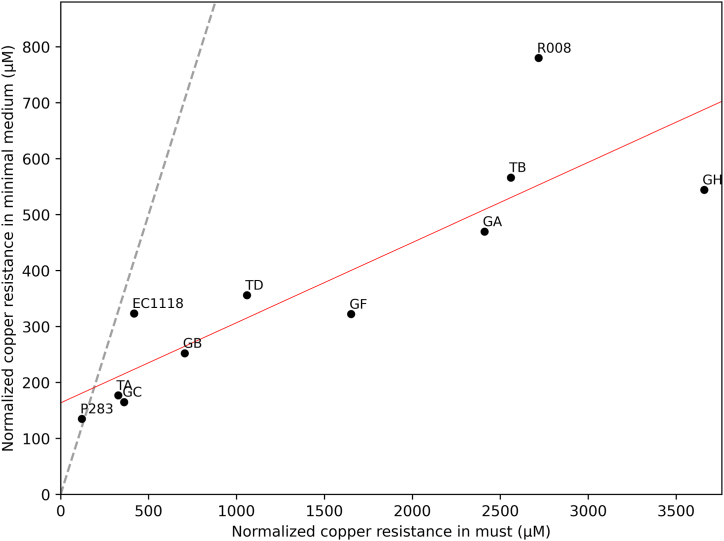
The widespread use of copper-based pesticides in winemaking can affect wine fermentation. Therefore, it is crucial to assess the resistance levels of Saccharomyces cerevisiae wine strains in enological growth conditions. In the context of winemaking, grape juice is a complex environment capable of chelating copper and is characterized by a distinctly acidic pH. In this work, the effects of copper concentration on the growth of 10 S. cerevisiae strains, isolated from an enological environment, and one commercial starter were tested in YNB minimal medium and synthetic must, mimicking enological conditions. In minimal medium, resistance to copper varied among yeasts (50-600 μM), revealing the presence of three resistance levels (high, intermediate, and low). Representative strains of the three groups were tested at a pH range from 5.2 to 3.0 at the copper concentration that showed a 20-25 % growth reduction. At pH range 5.2-4.5, a growth reduction was observed, while, conversely, a strain-specific recovery was observed at pH range 3.2-3.0. In synthetic must, the strains showed higher copper resistance levels than in minimal medium (50-4000 μM). In both synthetic must and minimal medium, a significant logarithmic correlation was found between copper resistance and CUP1 gene copy number. The copy number tended to better explain resistance in minimal medium compared to synthetic must. The results shed light on the role of CUP1 copy number within an enological environment.
Keywords: Cu detoxification system; Grape pomace; Metallothionein; Real-time PCR; Wine.
© 2024 The Authors. Published by Elsevier Ltd.
Conflict of interest statement
The authors declare that they have no known competing financial interests or personal relationships that could have appeared to influence the work reported in this paper.
Figures


References
-
- Rubino J.T., Franz K.J. Coordination chemistry of copper proteins: how nature handles a toxic cargo for essential function. J. Inorg. Biochem. 2012;107(1):129–143. - PubMed
-
- Puig S., Thiele D.J. Molecular mechanisms of copper uptake and distribution. Curr. Opin. Chem. Biol. 2002;6(2):171–180. - PubMed
-
- Karimi B., Masson V., Guilland C., Leroy E., Pellegrinelli S., Giboulot E., Maron P., Ranjard L. Ecotoxicity of copper input and accumulation for soil biodiversity in vineyards. Environ. Chem. Lett. 2021;19:2013–2030. doi: 10.1007/s10311-020-01155-x. 2021. - DOI
LinkOut - more resources
Full Text Sources
