. 2024 Jul 23:10:e2178.
doi: 10.7717/peerj-cs.2178. eCollection 2024.

Encoder-decoder convolutional neural network for simple CT segmentation of COVID-19 infected lungs

Affiliations

Encoder-decoder convolutional neural network for simple CT segmentation of COVID-19 infected lungs

Kiri S Newson et al. PeerJ Comput Sci. .

Abstract

This work presents the application of an Encoder-Decoder convolutional neural network (ED-CNN) model to automatically segment COVID-19 computerised tomography (CT) data. By doing so we are producing an alternative model to current literature, which is easy to follow and reproduce, making it more accessible for real-world applications as little training would be required to use this. Our simple approach achieves results comparable to those of previously published studies, which use more complex deep-learning networks. We demonstrate a high-quality automated segmentation prediction of thoracic CT scans that correctly delineates the infected regions of the lungs. This segmentation automation can be used as a tool to speed up the contouring process, either to check manual contouring in place of a peer checking, when not possible or to give a rapid indication of infection to be referred for further treatment, thus saving time and resources. In contrast, manual contouring is a time-consuming process in which a professional would contour each patient one by one to be later checked by another professional. The proposed model uses approximately 49 k parameters while others average over 1,000 times more parameters. As our approach relies on a very compact model, shorter training times are observed, which make it possible to easily retrain the model using other data and potentially afford "personalised medicine" workflows. The model achieves similarity scores of Specificity (Sp) = 0.996 ± 0.001, Accuracy (Acc) = 0.994 ± 0.002 and Mean absolute error (MAE) = 0.0075 ± 0.0005.

Keywords: Autoencoder; Automated segmentation; CNN; COVID-19; Encoder-decoder; Lung CT; Lung segmentation; Machine learning; Simple segmentation.


Conflict of interest statement

The authors declare that they have no competing interests.

Figures

Figure 1
Figure 1. Visual example of data used.
(A and C) Slices of a CT chest scan showing the cross-section of a lung infected with COVID-19; the grey areas showing where the infection is present. (B and D) The corresponding contours/masks, respectively, which are the segmented infected regions highlighting areas of the lung that are visibly infected. These masks are the “ground truth” (GT) used for training models and comparing predictions to. CT images/contours used within figure by Jun et al. (2020).
Figure 2
Figure 2. Diagram of our ED-CNN-
The recorded lung CT scan (left) is progressively encoded as it passes through the encoder. The compressed representation is then decoded into an output contour of the COVID-19 infected region(s) (right) of the input CT. CT images/contours used within figure by Jun et al. (2020).
Figure 3
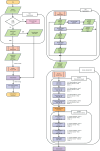
Figure 3. Pipeline flow chart of the entire system.
Diagram includes the data augmentation process and the steps throughout the model.
Figure 4
Figure 4. Visual comparison of results-
The first row shows the slices from a CT scan of the lungs that are infected with COVID-19, the second row shows the predicted infected regions made by our ED-CNN, the white highlighting the areas of infection from the original CT, and the final row shows the ground truth of the infected areas for comparison which also highlights infected areas in white-these are contoured by a radiologist. For rows one and three, CT images/contours used within the figure by Jun et al. (2020).

References

    1. Abraham B, Nair MS. Computer-aided classification of prostate cancer grade groups from mri images using texture features and stacked sparse autoencoder. Computerized Medical Imaging and Graphics. 2018;69(10071):60–68. doi: 10.1016/j.compmedimag.2018.08.006. - DOI - PubMed
    1. Adil MT, Rahman R, Whitelaw D, Jain V, Al-Taan O, Rashid F, Munasinghe A, Jambulingam P. Sars-cov-2 and the pandemic of covid-19. Postgraduate Medical Journal. 2021;97(1144):110–116. doi: 10.1136/postgradmedj-2020-138386. - DOI - PMC - PubMed
    1. Ahishali M, Degerli A, Yamac M, Kiranyaz S, Chowdhury ME, Hameed K, Hamid T, Mazhar R, Gabbouj M. Advance warning methodologies for covid-19 using chest x-ray images. IEEE Access. 2021;9:41052–41065. doi: 10.1109/ACCESS.2021.3064927. - DOI - PMC - PubMed
    1. Ai T, Yang Z, Hou H, Zhan C, Chen C, Lv W, Tao Q, Sun Z, Xia L. Correlation of chest ct and rt-pcr testing for coronavirus disease 2019 (covid-19) in China: a report of 1014 cases. Radiology. 2020;296(2):E32–E40. doi: 10.1148/radiol.2020200642. - DOI - PMC - PubMed
    1. Cheng MM, Fan DP. Structure-measure: a new way to evaluate foreground maps. International Journal of Computer Vision. 2021;129(9):2622–2638. doi: 10.1007/s11263-021-01490-8. - DOI

LinkOut - more resources