. 2024 Mar 14;73(4):857-879.
doi: 10.1093/jrsssc/qlae015. eCollection 2024 Aug.

Population-level task-evoked functional connectivity via Fourier analysis

Affiliations

Population-level task-evoked functional connectivity via Fourier analysis

Kun Meng et al. J R Stat Soc Ser C Appl Stat. .

Abstract

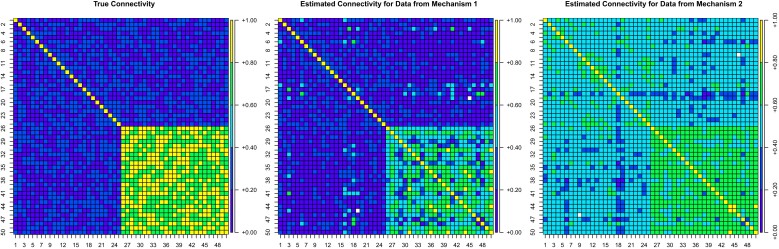
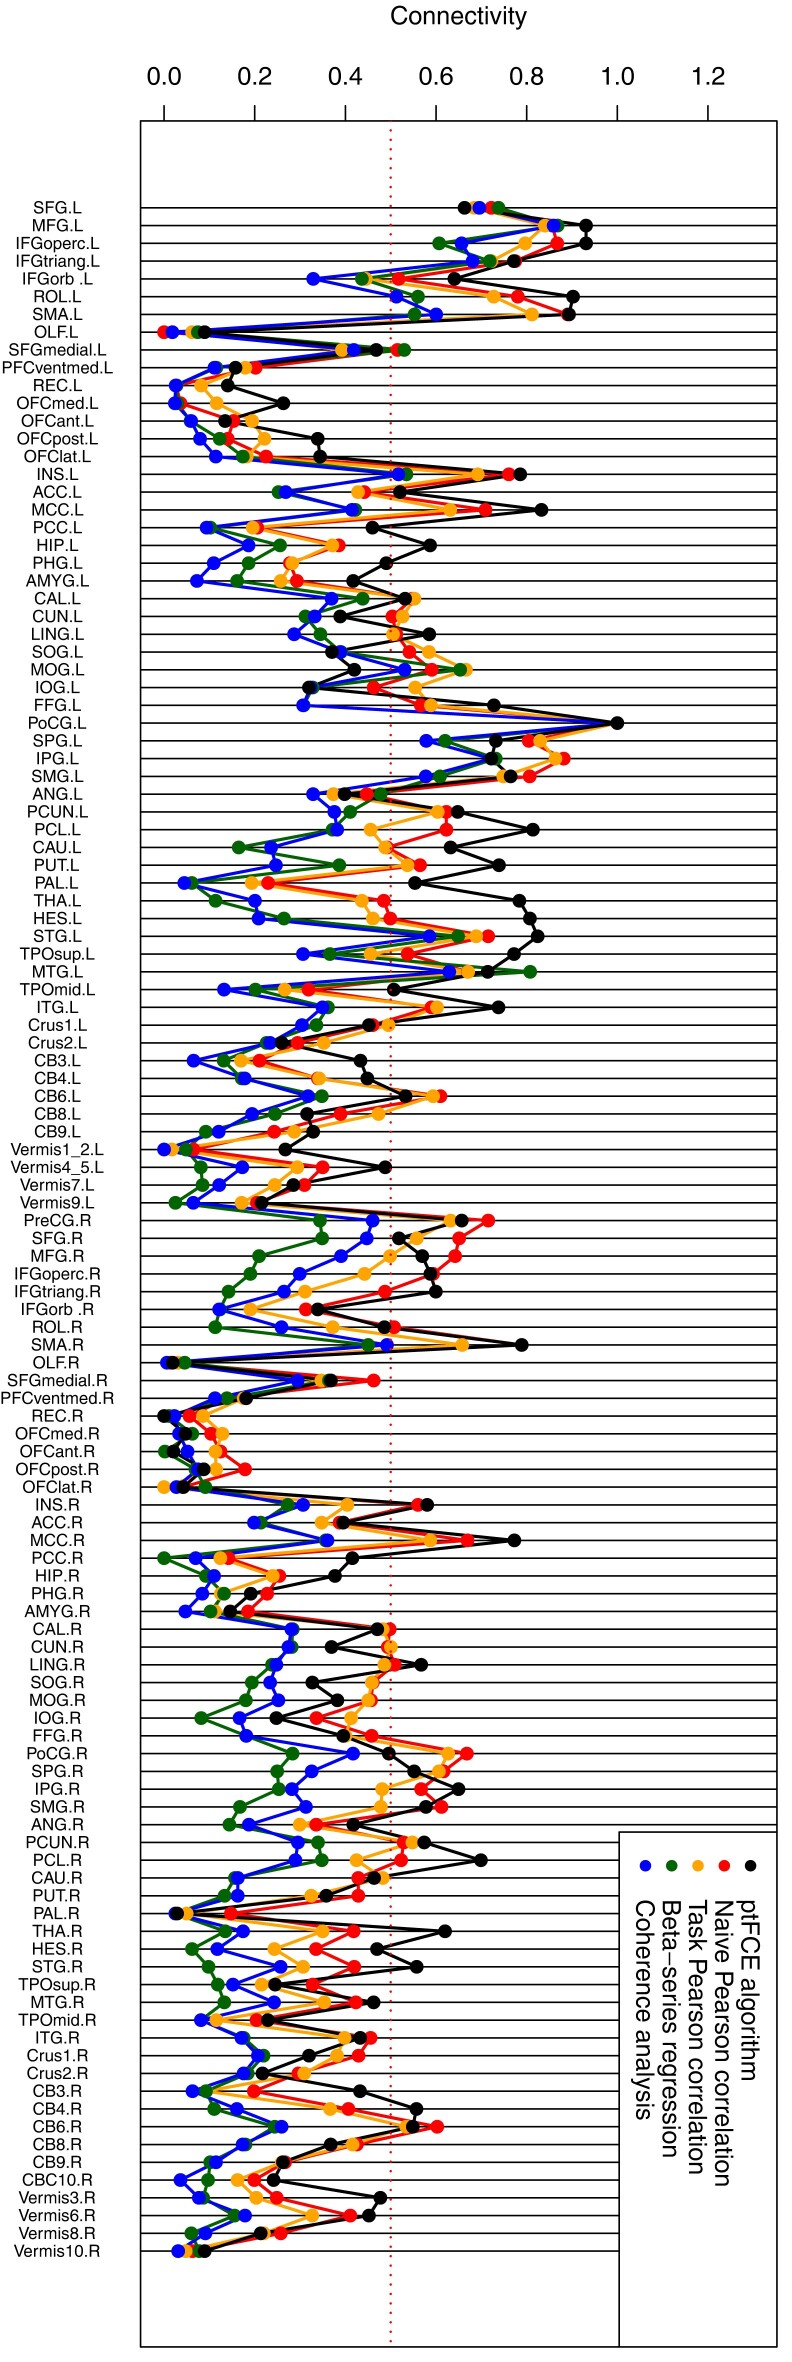
Functional magnetic resonance imaging (fMRI) is a noninvasive and in-vivo imaging technique essential for measuring brain activity. Functional connectivity is used to study associations between brain regions, either while study subjects perform tasks or during periods of rest. In this paper, we propose a rigorous definition of task-evoked functional connectivity at the population level (ptFC). Importantly, our proposed ptFC is interpretable in the context of task-fMRI studies. An algorithm for estimating the ptFC is provided. We present the performance of the proposed algorithm compared to existing functional connectivity frameworks using simulations. Lastly, we apply the proposed algorithm to estimate the ptFC in a motor-task study from the Human Connectome Project.

Keywords: AMUSE algorithm; Human Connectome Project; motor-task; weakly stationary with mean zero.


Conflict of interest statement

Conflicts of interest: None declared.

Figures

Figure 1.
Figure 1.
Three types of signals at the kth node of subject ω: stimulus signal N(t), task-evoked neural activity signal Φk[ω;N(t)], and observed BOLD signal Yk(ω;t)=Ψk{ω;Φk[ω;N(t)]}.
Figure 2.
Figure 2.
To generate this figure, we first generate synthetic BOLD signals using Mechanism 0 in online supplementary material, Appendix E with sample size n=308 and underlying ρ=0.25 (presented by the black dashed line). Then we apply our proposed ptFCE algorithm to the synthetic BOLD signals generated by Mechanism 0. The solid blue curve presents the estimator Cklest,n(ξ) as a function of Fourier frequencies ξ(0,12Δ), and the solid orange curve presents {Cklest,n(ξ)|ξ(0,0.15)} for taking the desired median. The unreasonably large value part of this orange curve motivates us to implement the median instead of the mean of {Cklest,n(ξ)|ξ(0,0.15)}. The dotted red line presents the median of Cklest,n(ξ) across ξ(0,0.15), i.e. the output of the ptFCE algorithm for the synthetic BOLD signals.
Figure 3.
Figure 3.
The simulation results of the 50-node study. The left panel shows the true connectivity structure for generating synthetic data using Mechanisms 1 and 2. The details of the data-generating procedure are provided in online supplementary material, Appendix E.4. The lighter shade in the bottom-right quadrant indicates that the connection between any two of nodes 26–50 is strong. For each of Mechanisms 1 and 2, we randomly generate only one synthetic subject. Then, we apply our proposed ptFCE algorithm to estimate the underlying connectivity. The estimated connectivity structures for data generated from Mechanisms 1 and 2 are presented in the middle and right panels, respectively.
Figure 4.
Figure 4.
Illustration of estimation results from five FC estimation methods. The horizontal axis indicates the 116 regions compared to PreCG.L. The abbreviations of region names are provided in the data set aal2.120 in the R package brainGraph. The vertical axis presents the standardized connectivity measurements Xr,j(st) between each region and the seed region PreCG.R. The dotted horizontal line indicates the threshold 0.5 implemented for determining the connected/nonconnected relationships between PreCG.L and other regions.
Figure 5.
Figure 5.
Each dot denotes a region from the AAL atlas, located using its corresponding MNI coordinates. The abbreviated region names are given next to each dot. We apply the ptFCE algorithm to estimate the ptFCs between region PreCG.L and each of the rest 116 regions. In the left panel, we use greyscale colouring of the edges to indicate the magnitude of ptFC between the corresponding two vertices; specifically, the larger a ptFC, the darker the line segment connecting the corresponding region pair. In the right panel, the presented blue line segments indicate the 30 largest ptFCs estimated by the ptFCE algorithm among all 116 regions.

Similar articles

References

    1. Aguirre G. K., Zarahn E., & D’Esposito M. (1997). Empirical analyses of bold fMRI statistics. NeuroImage, 5(3), 179–197. 10.1006/nimg.1997.0264 - DOI - PubMed
    1. Ashby F. G. (2019). Statistical analysis of fMRI data. MIT Press.
    1. Barch D. M., Burgess G. C., Harms M. P., Petersen S. E., Schlaggar B. L., Corbetta M., Glasser M. F., Curtiss S., Dixit S., Feldt C., & Nolan D. (2013). Function in the human connectome: Task-fMRI and individual differences in behavior. Neuroimage, 80, 169–189. 10.1016/j.neuroimage.2013.05.033 - DOI - PMC - PubMed
    1. Bowman F. D. (2014). Brain imaging analysis. Annual Review of Statistics and its Application, 1(1), 61–85. 10.1146/statistics.2013.1.issue-1 - DOI - PMC - PubMed
    1. Bowman F. D., Caffo B., Bassett S. S., & Kilts C. (2008). A Bayesian hierarchical framework for spatial modeling of fMRI data. NeuroImage, 39(1), 146–156. 10.1016/j.neuroimage.2007.08.012 - DOI - PMC - PubMed

LinkOut - more resources