. 2024 Jun 11;134(16):e172890.
doi: 10.1172/JCI172890.

Mouse sarcopenia model reveals sex- and age-specific differences in phenotypic and molecular characteristics

Affiliations

Mouse sarcopenia model reveals sex- and age-specific differences in phenotypic and molecular characteristics

Haiming L Kerr et al. J Clin Invest. .

Abstract

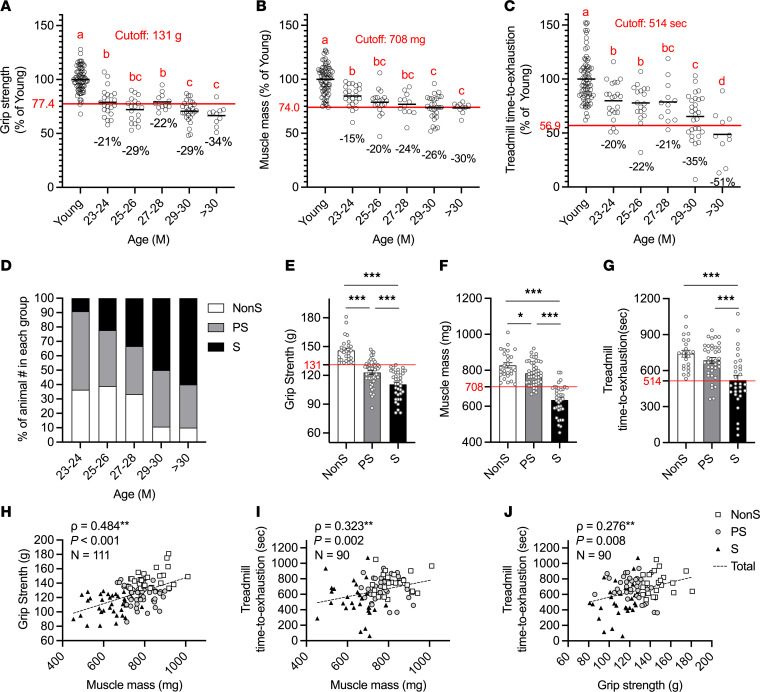
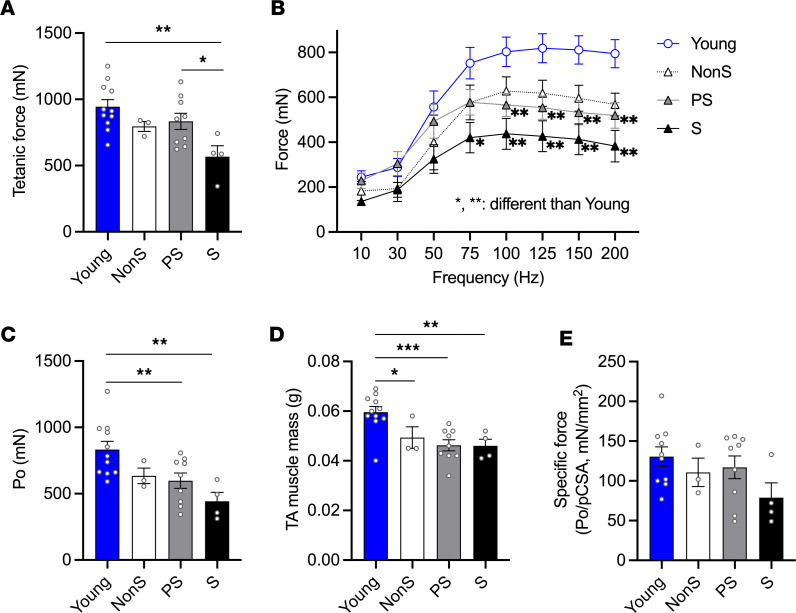
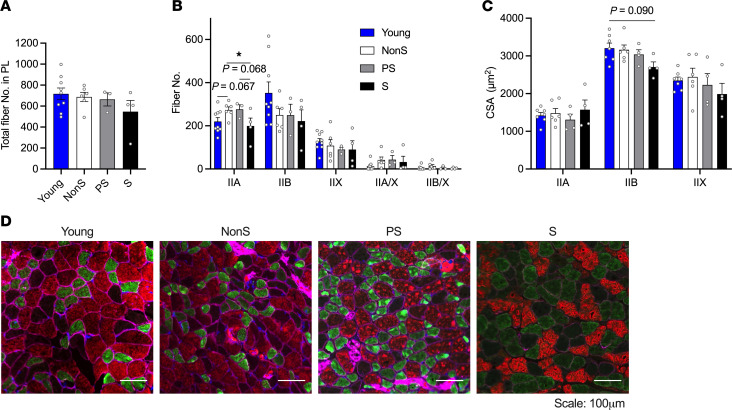
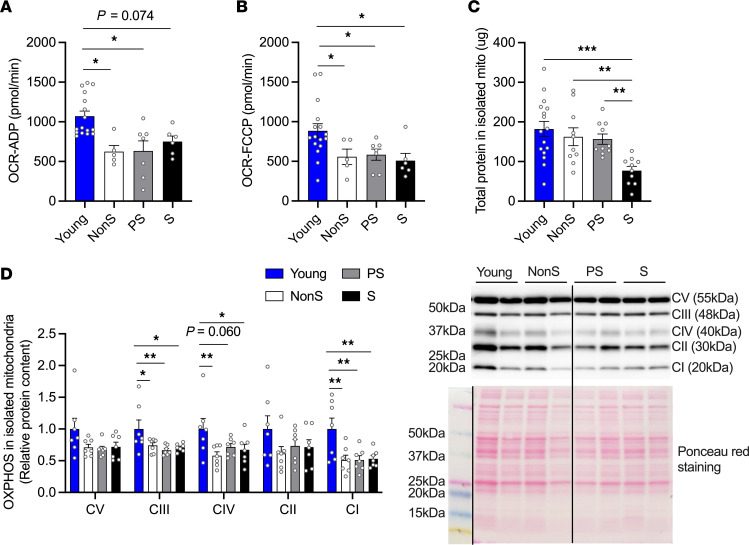
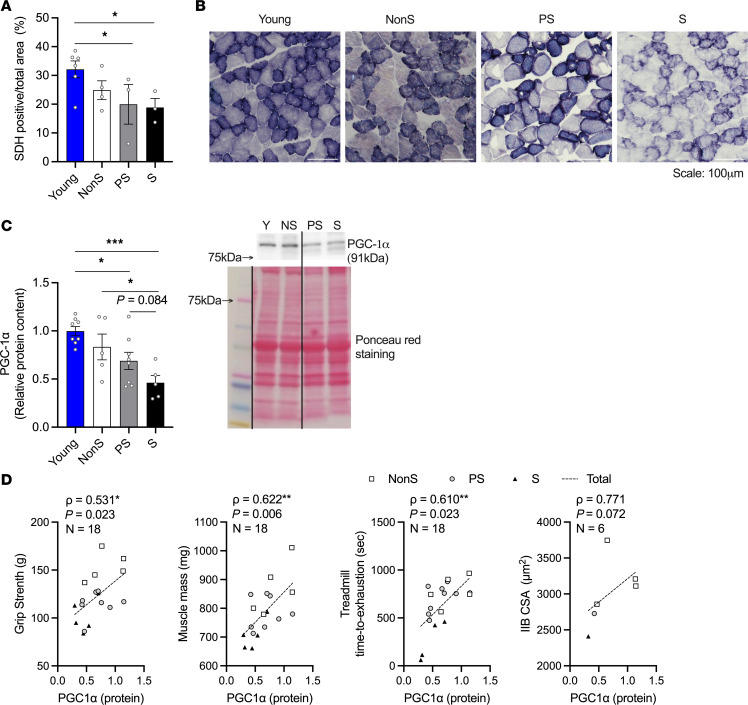
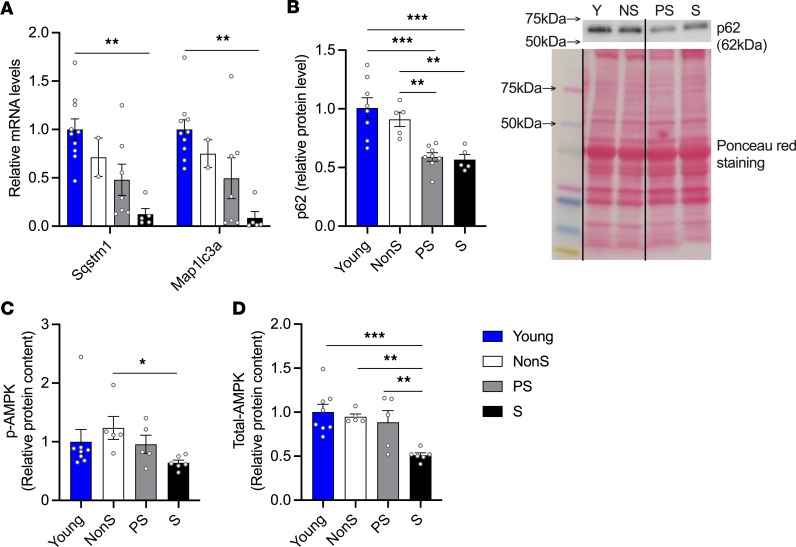
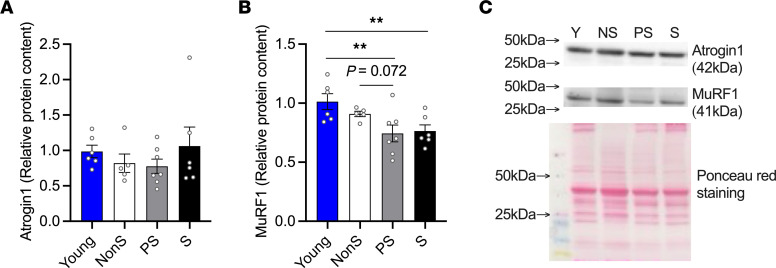
Our study was to characterize sarcopenia in C57BL/6J mice using a clinically relevant definition to investigate the underlying molecular mechanisms. Aged male (23-32 months old) and female (27-28 months old) C57BL/6J mice were classified as non-, probable-, or sarcopenic based on assessments of grip strength, muscle mass, and treadmill running time, using 2 SDs below the mean of their young counterparts as cutoff points. A 9%-22% prevalence of sarcopenia was identified in 23-26 month-old male mice, with more severe age-related declines in muscle function than mass. Females aged 27-28 months showed fewer sarcopenic but more probable cases compared with the males. As sarcopenia progressed, a decrease in muscle contractility and a trend toward lower type IIB fiber size were observed in males. Mitochondrial biogenesis, oxidative capacity, and AMPK-autophagy signaling decreased as sarcopenia progressed in males, with pathways linked to mitochondrial metabolism positively correlated with muscle mass. No age- or sarcopenia-related changes were observed in mitochondrial biogenesis, OXPHOS complexes, AMPK signaling, mitophagy, or atrogenes in females. Our results highlight the different trajectories of age-related declines in muscle mass and function, providing insights into sex-dependent molecular changes associated with sarcopenia progression, which may inform the future development of novel therapeutic interventions.

Keywords: Aging; Mitochondria; Mouse models; Muscle biology; Skeletal muscle.


Conflict of interest statement

Conflict of interest: The authors have declared that no conflict of interest exists.

Figures

Figure 1
Figure 1. Muscle mass and strength and physical function in young and old C57BL/6J male mice.
(A) Forelimb grip strength, (B) Muscle mass, and (C) Treadmill time to exhaustion, by age group, as a percent of the young group’s mean. (AC) Red horizontal lines at 2 SDs below the young group’s mean define cutoff points for impairments. 1-way ANOVA with LSD post hoc tests (ANOVA P < 0.05) shows significant differences, denoted by different letters (a, b, c, d). (D) The percentage of animals in each age group is identified by their sarcopenia status as nonsarcopenic (NonS; 0 deficit), probably sarcopenic (PS, 1 deficit), or sarcopenic (S, 2–3 deficits) based on the numbers of deficits in grip strength, muscle mass, and treadmill running time. (EG) Differences in grip strength, muscle mass, and treadmill running time among sarcopenia groups (n = 27, 47, 37 for grip strength and muscle mass; n = 23, 37, 30 for treadmill). 1-way ANOVA followed by LSD post hoc tests (ANOVA P < 0.05) were performed to detect differences among groups (*P < 0.05 and ***P < 0.001 indicate differences in pairwise comparisons). (HJ) Correlations between grip strength, muscle mass, and treadmill running time in old mice. Correlations were assessed with the Spearman correlation coefficient test (ρ). **P < 0.01.
Figure 2
Figure 2. Contractile properties of TA muscles in young and old nonsarcopenic (NonS), probable-sarcopenic (PS), and sarcopenic (S) male mice.
(A) Tetanic force (mN). (B) Contractile force (mN) in response to stimulation at various frequencies (Hz). (C) Peak force (Po, mN) was recorded as the highest force production during force-frequency regimen. (D) Muscle mass (g). (E) Specific force of TA muscle was calculated as peak force divided by physiological cross-sectional area (mN/mm2). Data are shown as mean ± SE (n = 11, 3, 9, 4). 1-way ANOVA was used to identify differences across groups followed by Dunnett’s (for force/frequency) or LSD post hoc test (ANOVA P < 0.05). Tukey HSD post hoc test was conducted when ANOVA was not significant (Specific force, ANOVA P = 0.205). *P < 0.05, **P < 0.01, ***P < 0.001 indicate significant differences compared with young in panel B and significant differences between groups for other panels.
Figure 3
Figure 3. IHC of myosin heavy chain type IIA, IIB, and IIX fibers in PL muscles from young and old NonS, PS, and S male mice (n= 9, 6, 3, 4).
(A) Total fiber number in PL muscles. (B) Fiber number in PL muscles by myosin heavy chain (MHC) type (IIA, IIB, IIX, IIA/X, and IIB/X). (C) CSA of fibers by MHC type in PL muscles (n = 7, 6, 4, 4). (D) Representative images of IHC MHC staining for IIA (green), IIB (red), and IIX (no stain, blank) in PL, with membranes stained for dystrophin (magenta). Data are shown as mean ± SE. 1-way ANOVA was used to identify differences across groups followed by LSD post hoc test (IIA fiber number: ANOVA P = 0.087, trend difference). Tukey HSD post hoc test was conducted when ANOVA was not significant (other fiber number and CSA, ANOVA P > 0.1). *P < 0.05 indicate differences in pairwise comparisons. Trends (0.05 < P < 0.1) were marked in the figure with their P values. Scale bars: 100 μm.
Figure 4
Figure 4. Mitochondrial respiration and OXPHOS complex content in isolated mitochondria from PL muscles of young and old NonS, PS, and S male mice.
(A) Maximum mitochondrial respiration measured as ADP-stimulated oxygen consumption rate (OCR-ADP, pmol/min, n = 16, 5, 7, 6). (B) Uncoupled maximum respiration measured as FCCP-stimulated oxygen consumption rate (OCR-FCCP, pmol/min, n = 16, 5, 7, 6). (C) Total protein in isolated mitochondria (μg) measured by BCA (n = 16, 10, 10, 10). (D) Protein levels of oxidative phosphorylation (OXPHOS) complexes measured using Western blotting (n = 7/group). Western blots were quantified by densitometry and normalized to Ponceau red signal. Representative Western blots and Ponceau red staining are on the right. The line on the blot indicates that lanes are not continuous but from the same blot. Data are shown as mean ± SE. 1-way ANOVA was used to identify differences across groups followed by LSD post hoc test (ANOVA P < 0.05). Tukey HSD post hoc test was conducted when ANOVA was not significant (Complex V and II, ANOVA P > 0.1). ADP-stimulated oxygen consumption rate was analyzed by Kruskal-Wallis tests as the data was not normally distributed (P < 0.05). * P < 0.05, ** P < 0.01, and *** P < 0.001 indicate differences in pairwise comparisons. Trends (0.05 < P < 0.1) were marked in the figure with their P values.
Figure 5
Figure 5. Oxidative capacity and mitochondria biogenesis markers in PL muscles of young and old NonS, PS, and S male mice.
(A) Percentage of SDH-positive area in PL muscles (n = 6, 4, 3, 3). (B) Representative images of SDH-stained PL muscles. Scale bars: 100 μm. (C) Relative protein content of PGC-1α in GAS/PL muscles (n = 8, 5, 8, 5), measured by Western blotting, quantified by densitometry, and normalized to Ponceau red signal. Representative Western blots and Ponceau red staining are shown on the right. The line on the blot indicates that lanes are not continuous but from the same blot. Data are shown as mean ± SE. (A and C) 1-way ANOVA was used to identify differences across groups followed by LSD post hoc test (ANOVA P < 0.05 for PGC-1α; ANOVA P = 0.095 for SDH, trend difference). *P < 0.05, **P < 0.01, and ***P < 0.001 indicate differences in pairwise comparisons. Trends (0.05 < P < 0.1) are marked in the figure with the P value. (D) Correlations between PGC1-α protein content and grip strength, muscle mass, treadmill running time, or MHC IIB fiber cross-sectional area. Correlations were assessed with the Spearman correlation coefficient test (ρ). *P < 0.05, **P < 0.01.
Figure 6
Figure 6. Molecular markers for autophagy and AMPK signaling in skeletal muscles in young and old NonS, PS, and S male mice.
(A) Gene expression of autophagy markers Sqstm1 (p62) and Map1lc3a (LC3) (n = 10, 3, 7, 5) as measured by RT-qPCR. Hprt was used as a reference gene and data are expressed as relative mRNA fold-change from the young group. (B) Relative protein level of the autophagy marker p62 (n = 8, 5, 8, 5) in GAS/PL muscles as measured by Western blotting, quantified by densitometry, and normalized to Ponceau red signal. Representative Western blots and Ponceau red staining are shown on the right. The line on the blot indicates that lanes are not continuous but from the same blot. (C) Relative protein content of p-AMPKα (Thr172) and (D) total AMPK (n = 8, 5, 5, 6) as measured in Quad muscles by MSD electrochemiluminescence immunoassay. Data are shown as mean ± SE. 1-way ANOVA was used to identify differences across groups followed by LSD post hoc test (ANOVA P < 0.05). Gene expression of autophagy markers and p-AMPKα protein levels were analyzed by Kruskal-Wallis tests as the data was not normally distributed (P < 0.05). *P < 0.05, **P< 0.01, and ***P < 0.001 indicate differences in pairwise comparisons.
Figure 7
Figure 7. Relative protein content of atrogenes.
(A) Atrogin1 and (B) MuRF1 in GAS/PL muscles of young and old NonS, PS, and S male mice n = 6566, as measured by Western blotting, quantified by densitometry, and normalized to Ponceau red signal. (C) Representative Western blots and Ponceau red staining. Data are shown as mean ± SE. 1-way ANOVA was used to identify differences across group means followed by LSD post hoc test (ANOVA P < 0.05). *P < 0.05 and **P < 0.01 indicate differences in pairwise comparisons. A trend (0.05 < P < 0.1) was marked in the figure with the P value.

Comment in

  • Decoding the decline: unveiling drivers of sarcopenia

References

    1. Du K, et al. Prevalence of sarcopenia and sarcopenic obesity vary with race/ethnicity and advancing age. Divers Equal Health Care. 2018;15(4):175–183. doi: 10.21767/2049-5471.1000173. - DOI
    1. Batsis JA, et al. Sarcopenia, sarcopenic obesity, and functional impairments in older adults: national health and nutrition examination surveys 1999-2004. Nutr Res. 2015;35(12):1031–1039. doi: 10.1016/j.nutres.2015.09.003. - DOI - PMC - PubMed
    1. Dhillon RJ, Hasni S. Pathogenesis and management of sarcopenia. Clin Geriatr Med. 2017;33(1):17–26. doi: 10.1016/j.cger.2016.08.002. - DOI - PMC - PubMed
    1. Law TD, et al. Resistance exercise to prevent and manage sarcopenia and dynapenia. Annu Rev Gerontol Geriatr. 2016;36(1):205–228. doi: 10.1891/0198-8794.36.205. - DOI - PMC - PubMed
    1. Izquierdo M, et al. International exercise recommendations in older adults (ICFSR): expert consensus guidelines. J Nutr Health Aging. 2021;25(7):824–853. doi: 10.1007/s12603-021-1665-8. - DOI - PubMed

Substances