. 2024 Aug 20;121(34):e2405465121.
doi: 10.1073/pnas.2405465121. Epub 2024 Aug 15.

Mechanism of gabapentinoid potentiation of opioid effects on cyclic AMP signaling in neuropathic pain

Affiliations

Mechanism of gabapentinoid potentiation of opioid effects on cyclic AMP signaling in neuropathic pain

Anibal Garza-Carbajal et al. Proc Natl Acad Sci U S A. .

Abstract

Over half of spinal cord injury (SCI) patients develop opioid-resistant chronic neuropathic pain. Safer alternatives to opioids for treatment of neuropathic pain are gabapentinoids (e.g., pregabalin and gabapentin). Clinically, gabapentinoids appear to amplify opioid effects, increasing analgesia and overdose-related adverse outcomes, but in vitro proof of this amplification and its mechanism are lacking. We previously showed that after SCI, sensitivity to opioids is reduced by fourfold to sixfold in rat sensory neurons. Here, we demonstrate that after injury, gabapentinoids restore normal sensitivity of opioid inhibition of cyclic AMP (cAMP) generation, while reducing nociceptor hyperexcitability by inhibiting voltage-gated calcium channels (VGCCs). Increasing intracellular Ca2+ or activation of L-type VGCCs (L-VGCCs) suffices to mimic SCI effects on opioid sensitivity, in a manner dependent on the activity of the Raf1 proto-oncogene, serine/threonine-protein kinase C-Raf, but independent of neuronal depolarization. Together, our results provide a mechanism for potentiation of opioid effects by gabapentinoids after injury, via reduction of calcium influx through L-VGCCs, and suggest that other inhibitors targeting these channels may similarly enhance opioid treatment of neuropathic pain.

Keywords: Cav1.2; adenylyl cyclase; dorsal root ganglia; opioid; pregabalin.


Conflict of interest statement

Competing interests statement:The authors declare no competing interest.

Figures
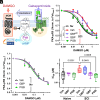
Fig. 1.
Fig. 1.
Gabapentinoids restore opioid inhibition of cAMP generation after SCI. (A) Diagram of relevant molecular targets. Fsk activates AC5/6 to induce cAMP production, which is indirectly quantified via the phosphorylation of PKA-RII. DAMGO activates the MOR to inhibit AC5/6 activity via Gαi. Gabapentinoids inhibit VGCC membrane expression by interacting with the CaVα2δ subunit. (B) Dose–response curves for DAMGO inhibition of Fsk-induced PKA-RII phosphorylation in neurons from naive (Nv) and SCI animals. The curves have been normalized to the maximal Fsk response in the absence of opioids (PKA-pRII = 1). Results are shown as mean ± SEM; N ≥ 4 per data point. In the case of SCI, neurons were treated for 30 min (GBP30) or overnight with GBP or PGB. (C) Effects of GBP and PGB overnight on neurons from naive rats (mean ± SEM; N ≥ 5 per data point.) (D) IC50 values for (B and C). Box–whisker plots indicate the full data range. Statistics: ***P < 0.001, **P < 0.01, and *P < 0.05. (B): 2w ANOVA, treatment effect F(4,234) = 25.11, P < 0.0001; Dunnett’s multiple comparison test: [(SCI vs. Nv), (SCI vs. GP_24) and (SCI vs. PrG_24)] P > 0.0001. (C) 2 W ANOVA. (D) 1w ANOVA, Kruskal–Wallis test (H(7,56) = 31.63, P < 0.0001), followed by Dunn’s multiple comparisons test. Individual P values are on the graph.
Fig. 2.
Fig. 2.
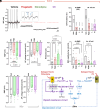
L-VGCC activity modulates opioid sensitivity after SCI. (A) DAMGO dose–response curves in neurons from SCI animals, treated with vehicle (Veh) and the specific VGCC inhibitors nimodipine (L), C9 (N), and TTA-P2 (T), individually or in combination (LNT). Naive dose–response curve (gray) is shown for reference. (B) Neurons from the naive group were tested with vehicle (Veh), nimodipine (L), and the VGCC inhibitor combination (LNT). SCI reference curve is shown in pink. Results are shown as mean ± SEM; N ≥ 3 per data point. (C) IC50 values for (A and B). Box-whisker plots indicate the full data range. (D) FPL 64176 (FPL; L-VGCC opener) mimics SCI effects in naive rat neurons. The effect on IC50 is blocked by L-VGCC inhibition with nimodipine, but unaffected by the KCNQ activator retigabine (Ret), despite small effects on DAMGO maximal effect (mean ± SEM; N > 4 per data point). (E) IC50 values for (D) (full data range). (F) Ionomycin treatments (Ion; 2 and 200 nM) mimic both FPL 64176 and SCI effects in naive rat neurons but are unaffected by nimodipine or PGB treatments. (mean ± SEM; N > 3 per data point). (G) IC50 values for (F) (full data range). (H) Effects of FPL 64176 and ionomycin on basal and Fsk-induced PKA-pRII levels (full data range). (I) AC1 inhibitor ST034307 (AC1i) had no effect on FPL 64176-induced opioid insensitivity in naive rat neurons (mean ± SEM; N > 3 per data point). (J) Diagram of the inhibitors and activators used and their targets. Statistics: ****P > 0.0001, ***P < 0.001, **P < 0.01, and *P < 0.05. (A): 2w ANOVA, F(4,181)= 13.33, P < 0.0001; Dunnett’s multiple comparison test: [(SCI vs. L), (SCI vs. LNT)] P > 0.0001. (B) 2w ANOVA. (C) 1w ANOVA (F(7,45) = 7.12, P < 0.0001), followed by Sidak’s multiple comparisons test. (D) 2w ANOVA F(3,256) = 56.85, P < 0.0001. Tukey’s multiple comparison test: (FPL vs. Nv) P < 0.0001; (FPL vs. FPL_L) P < 0.0001. (E) 1w ANOVA F(3,39) = 20.18, P < 0.0001, followed by Dunnett’s multiple comparisons test. (F) 2w ANOVA F(4,219) = 23.92, P < 0.0001. Dunnett’s multiple comparisons test [(Veh vs. Ion2), (Veh vs. Ion_200)] P < 0.0001. (G) 1w ANOVA (F(4,26) = 7.26, P < 0.0005), followed by Šídák’s multiple comparisons test. (H) 1w ANOVA. (I) 2w ANOVA, F(2,93) = 19.88, followed by Tukey’s multiple comparisons test: (Nv vs. FPL) and (Nv vs. FPL+AC1i), P < 0.0001.
Fig. 3.
Fig. 3.
C-Raf activity in IB4+ neurons is required for opioid insensitivity effects induced by L-VGCC-activation or ionomycin. (A) FPL 64176 and ionomycin effects on DAMGO dose–response curves from naive rat neurons are blocked by the C-Raf inhibitor GW 5074 (GW; 3 μM) (mean ± SEM; N ≥ 4 per data point). (B) IC50 values for (A) (full data range). (C) pERK responses to subthreshold depolarizations (−45 mV) are decreased by blockers of L-VGCCs or N-VGCCs (L and N, respectively), with complete inhibition of pERK responses when used in combination (LN) (full data range). (D) L-VGCC activation by FPL 64176 (3 μM, 5′) induces phosphorylation of C-Raf, RKIP, ERK, and CREB (full data range). (E) Three-dimensional scatter plot of DRG neurons in culture stimulated with vehicle or FPL 64176. Neurons were clustered according to soma area, CGRP expression, and IB4 binding, with dot circumference and color intensity being proportional to pC-Raf signal; control 2,519 neurons, FPL 2,559 neurons. (F and G) Cluster-specific effects of ionomycin on DAMGO sensitivity. (G) DAMGO dose–response curves were quantified among individual clusters of naive rat neurons exposed to vehicle (Control) or ionomycin 200 nM (Ion) (mean ± SEM; N ≥ 3 per data point). Box–whisker plots indicate the full data range of IC50 values. Subpopulations with increased DAMGO IC50, green; no change, purple; no DAMGO response, gray. Statistics: ***P < 0.001, **P < 0.01, and *P < 0.05. (A): 2w ANOVA, treatment effect F(4,172) = 16.59, P < 0.0001; Sidak’s multiple comparison test: (Veh vs. Ion) P < 0.0001; (Veh vs. FPL) P = 0.0004; (Ion vs. Ion_GW) P < 0.0001; (FPL vs. FPL_GW) P = 0.0002. (B) 1w ANOVA F(4,27) = 12.46, P < 0.0001. (C) 1w ANOVA F(3,26) = 16.44, P < 0.0001. (D) Unpaired t test: pC-Raf (T(8) = 5.244), pRKIP(T(8) = 5.24), pERK(T(8) = 2.49), pCREB(T(6) = 3.98); P values shown in the figure. (G) Dose–response curves: 2w ANOVA; IB1 (F(1,70) = 6.82, P = 0.011); IB2a (F(1,48) = 13.12, P = 0.0007); IBCG (F(1,84) = 23.86; P < 0.0001). Unpaired t test IC50: IB1(T(8) = 2.67, P = 0.028); IB2a(T(7) = 2.65, P = 0.033); IBCG(T(13) = 3.23, P = 0.0065).
Fig. 4.
Fig. 4.
Electrophysiological effects of PGB, nimodipine (L), and C9 (N) on sensory neurons isolated from SCI (AF) and naive (G and H) rats. (A) Representative recordings at RMP from SCI neurons after vehicle, PGB, nimodipine, or C9 treatments. SCI neurons were exposed to PGB overnight. Nimodipine and C9 were applied 15 min before recording. Impact of VGCC inhibitors on (B) incidence of neurons firing at RMP (SA) or when artificially depolarized to −45 mV (OA), (C) RMP, (D) AP voltage threshold, (E) rheobase, and (F) DSF amplitudes during 30-s recordings at RMP or −45 mV. Results are shown as ratios (B), mean ± SEM (CE), or medians (F). (G and H) Lack of effect of VGCC inhibitors on neurons from naive rats (mean ± SEM). (I) Proposed mechanisms of VGCC-mediated effects on excitability and opioid sensitivity after SCI. Activation of either L-VGCC or N-VGCC will increase intracellular Ca2+, activating the ERK cascade via Ca2+-sensitive RasGEFs and inducing ERK-mediated hyperexcitability, which in turn enhances VGCC activity. The close proximity of L-VGCC to AC5/6 allows C-Raf to modulate Gαi sensitivity of AC, decreasing opioid inhibition. cAMP generation in turn facilitates L-VGCC activation via PKA. AKAP79/150 is proposed as the molecular scaffold coordinating these events. Statistics: (B) Fisher’s exact test, Bonferroni correction (significance level * = 0.0167, ** = 0.003, and *** = 0.0003); (C) Kruskal–Wallis P = 0.024, followed by Dunn’s multiple comparisons tests; (D) Brown–Forsythe ANOVA test F(3,44.1) = 7.49, P = 0.0004, followed by Dunnett’s T3 multiple comparisons test; (E) Brown–Forsythe ANOVA test F(3,29.6) = 17.23, P < 0.0001, followed by Dunnett’s T3 multiple comparisons tests; (F) At rest: Brown–Forsythe ANOVA testF(3, 24.55) = 6.384, P = 0.0024, followed by Dunnett’s T3 multiple comparisons tests; at −45 mV Kruskal–Wallis test P = 0.0001, followed by Dunn’s multiple comparisons test. (G) Kruskal–Wallis test (n/s). (H) Brown–Forsythe ANOVA test (n/s).

References

    1. Gurba K. N., Chaudhry R., Haroutounian S., Central neuropathic pain syndromes: Current and emerging pharmacological strategies. CNS Drugs 36, 483–516 (2022). - PubMed
    1. Cooper T. E., et al. , Morphine for chronic neuropathic pain in adults. Cochrane Database Syst. Rev. 5, Cd011669 (2017). - PMC - PubMed
    1. Woller S. A., Malik J. S., Aceves M., Hook M. A., Morphine self-administration following spinal cord injury. J. Neurotrauma 31, 1570–1583 (2014). - PMC - PubMed
    1. Garza Carbajal A., Bavencoffe A., Walters E. T., Dessauer C. W., Depolarization-dependent C-Raf signaling promotes hyperexcitability and reduces opioid sensitivity of isolated nociceptors after spinal cord injury. J. Neurosci. 40, 6522–6535 (2020). - PMC - PubMed
    1. Bavencoffe A., et al. , Persistent electrical activity in primary nociceptors after spinal cord injury is maintained by scaffolded adenylyl cyclase and protein kinase A and is associated with altered adenylyl cyclase regulation. J. Neurosci. 36, 1660–1668 (2016). - PMC - PubMed

MeSH terms