. 2024 Aug 15;134(18):e175447.
doi: 10.1172/JCI175447.

Modulation of NOX2 causes obesity-mediated atrial fibrillation

Affiliations

Modulation of NOX2 causes obesity-mediated atrial fibrillation

Arvind Sridhar et al. J Clin Invest. .

Abstract

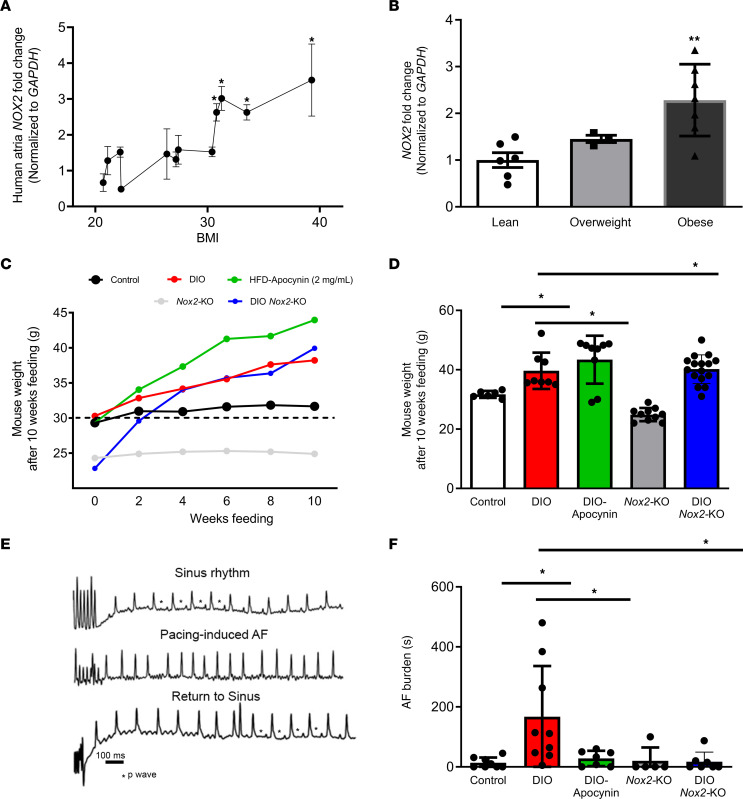
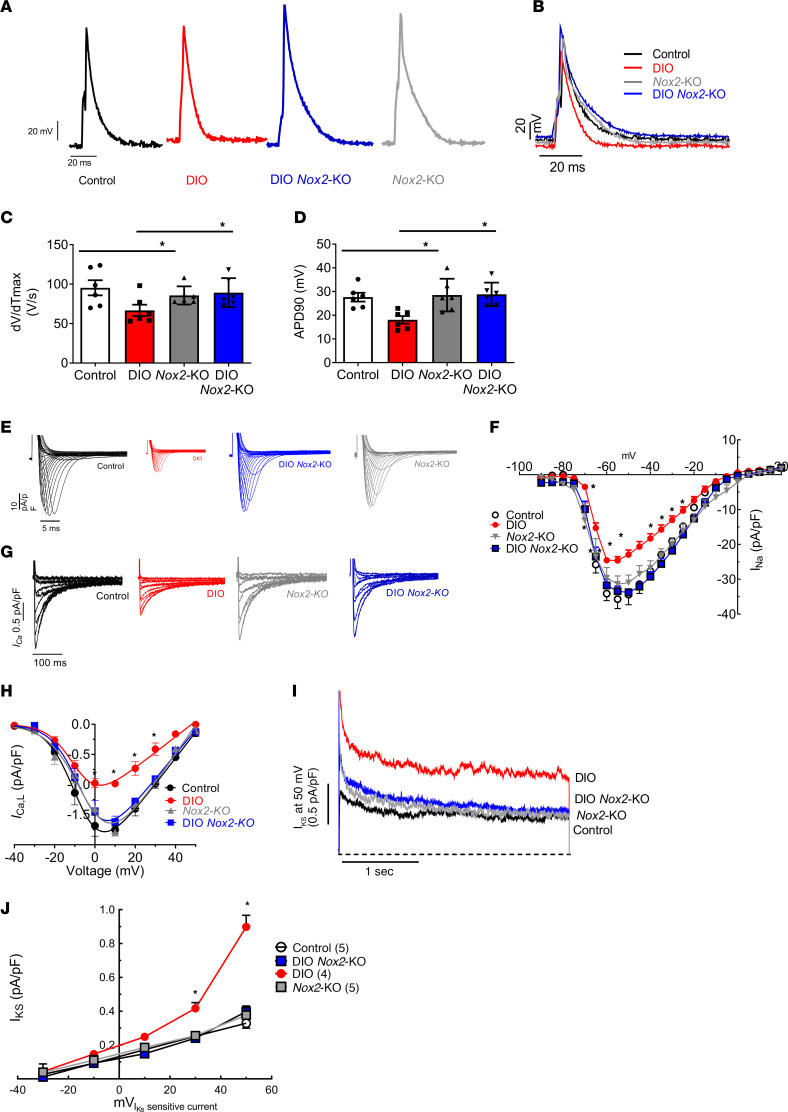
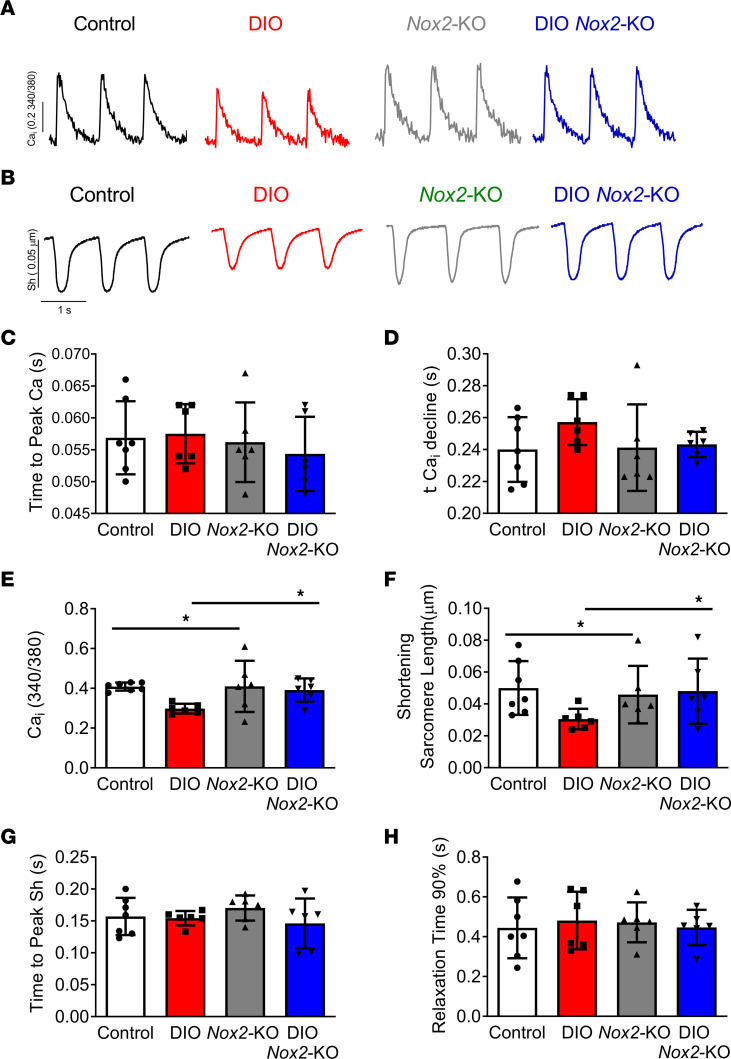
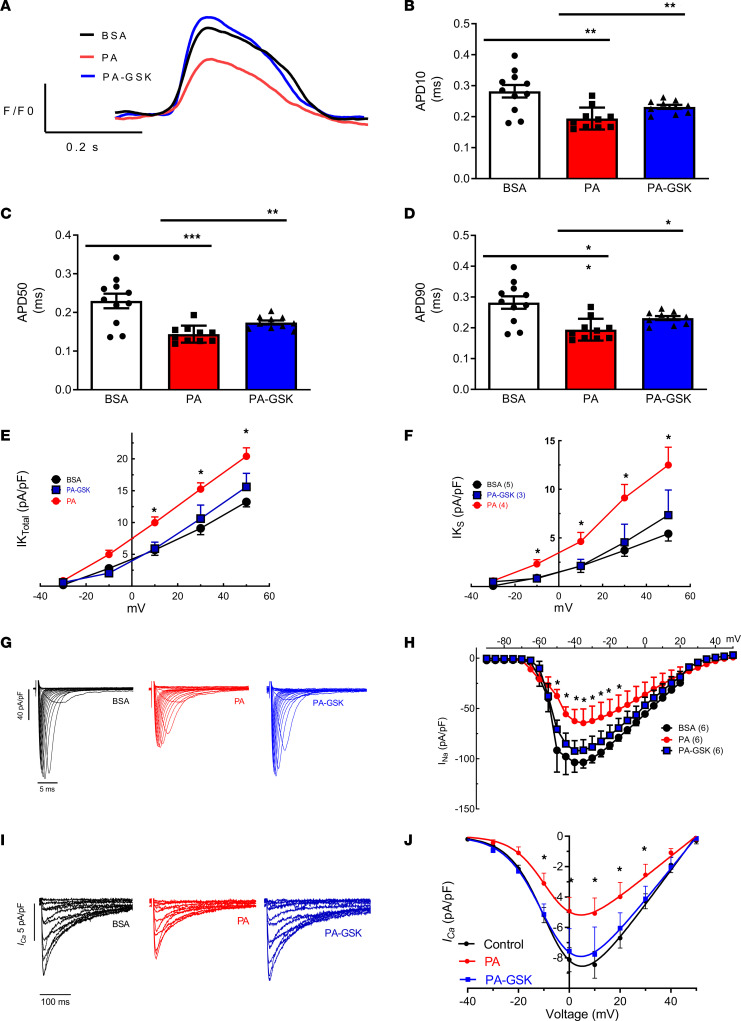
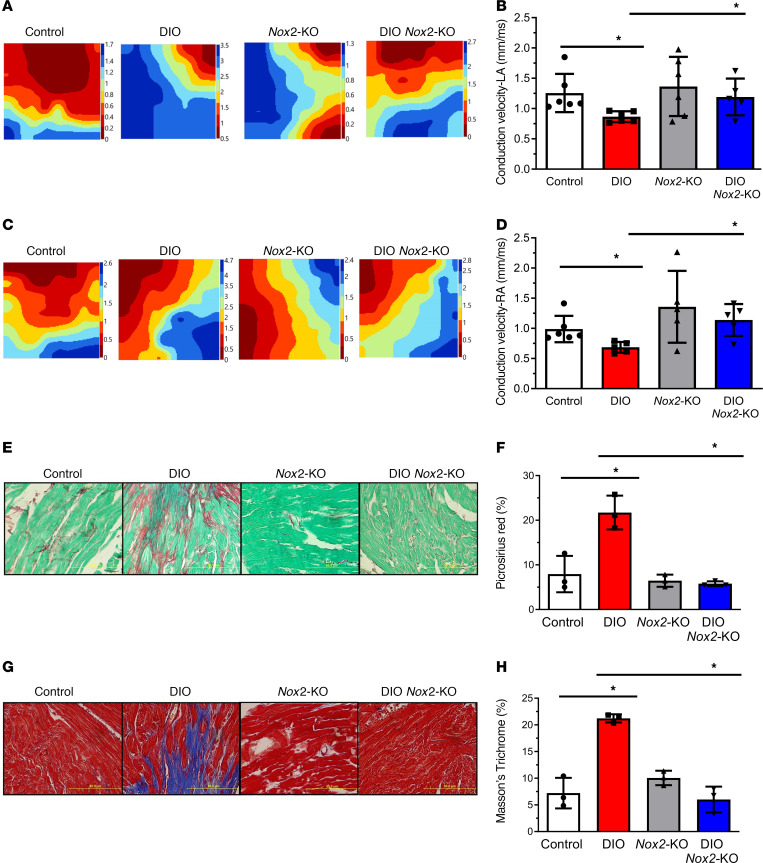
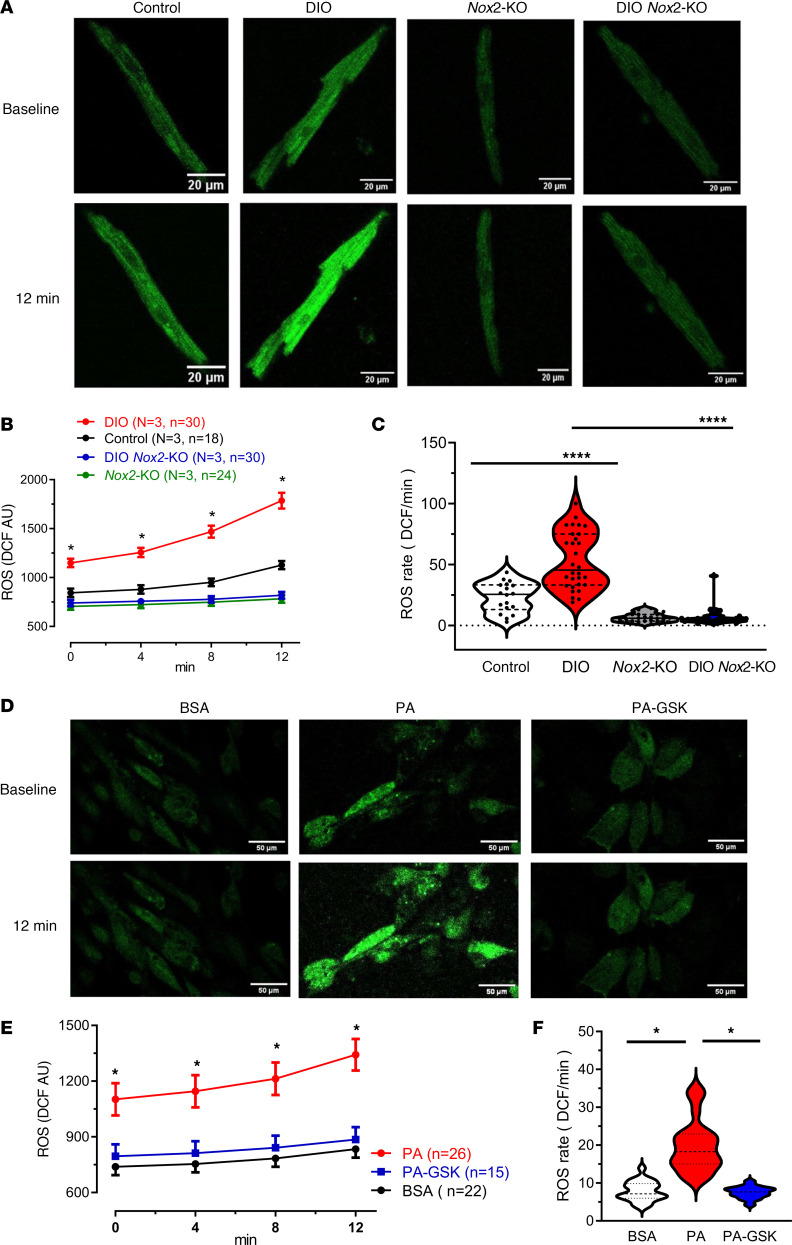
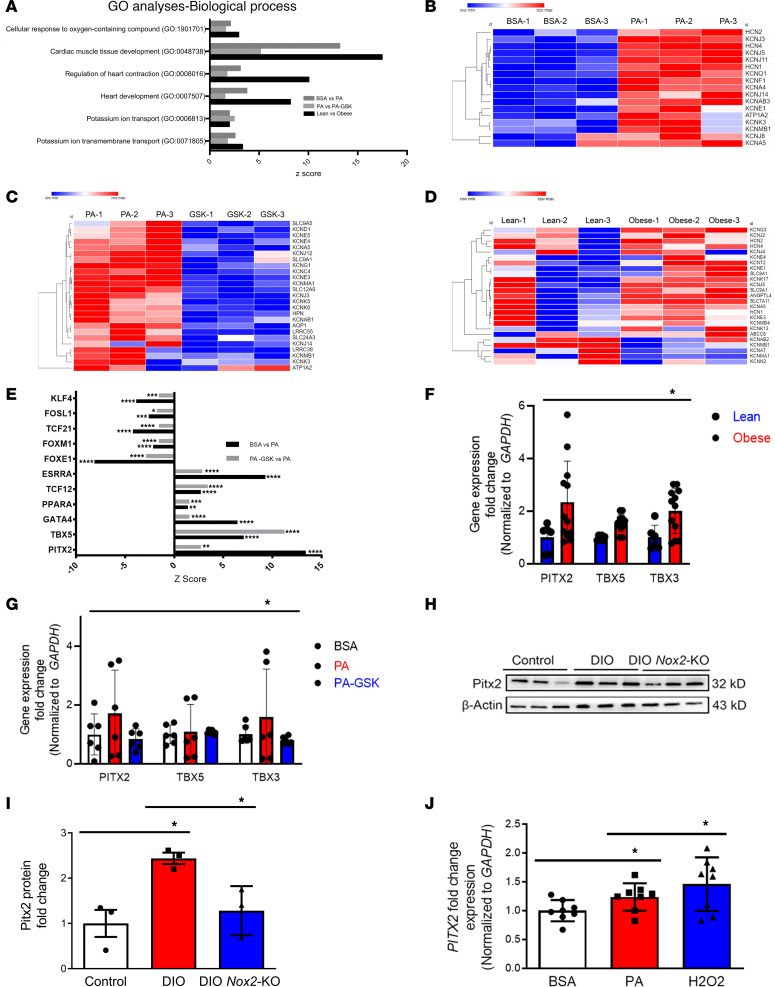
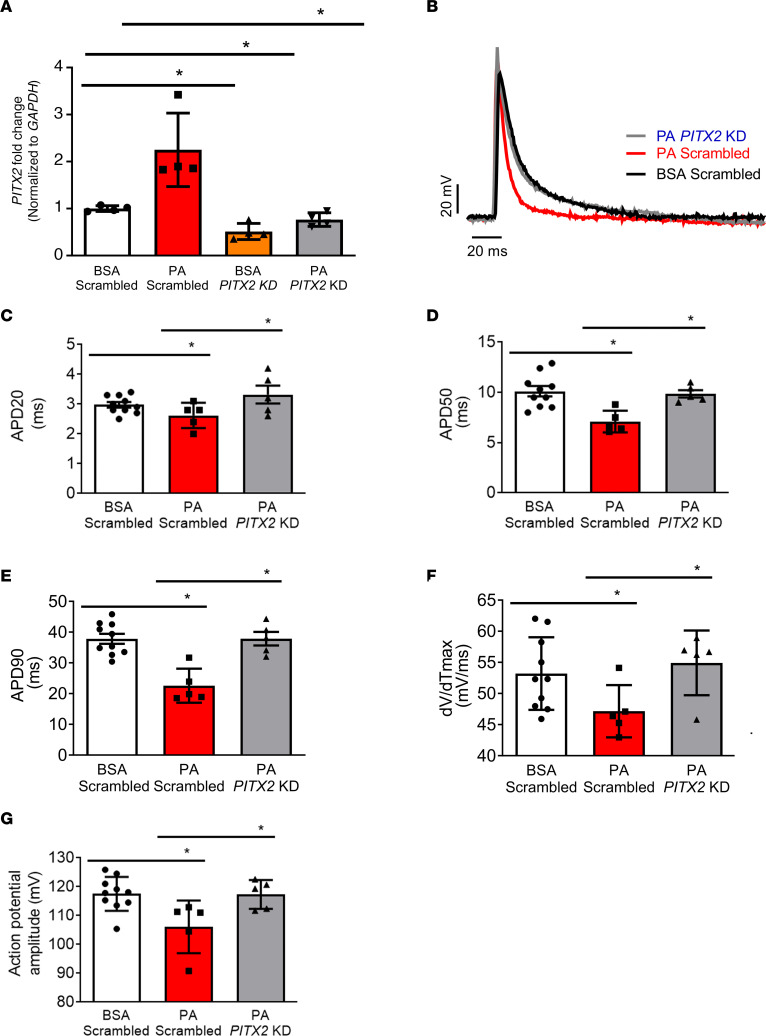
Obesity is linked to an increased risk of atrial fibrillation (AF) via increased oxidative stress. While NADPH oxidase 2 (NOX2), a major source of oxidative stress and reactive oxygen species (ROS) in the heart, predisposes to AF, the underlying mechanisms remain unclear. Here, we studied NOX2-mediated ROS production in obesity-mediated AF using Nox2-knockout mice and mature human induced pluripotent stem cell-derived atrial cardiomyocytes (hiPSC-aCMs). Diet-induced obesity (DIO) mice and hiPSC-aCMs treated with palmitic acid (PA) were infused with a NOX blocker (apocynin) and a NOX2-specific inhibitor, respectively. We showed that NOX2 inhibition normalized atrial action potential duration and abrogated obesity-mediated ion channel remodeling with reduced AF burden. Unbiased transcriptomics analysis revealed that NOX2 mediates atrial remodeling in obesity-mediated AF in DIO mice, PA-treated hiPSC-aCMs, and human atrial tissue from obese individuals by upregulation of paired-like homeodomain transcription factor 2 (PITX2). Furthermore, hiPSC-aCMs treated with hydrogen peroxide, a NOX2 surrogate, displayed increased PITX2 expression, establishing a mechanistic link between increased NOX2-mediated ROS production and modulation of PITX2. Our findings offer insights into possible mechanisms through which obesity triggers AF and support NOX2 inhibition as a potential novel prophylactic or adjunctive therapy for patients with obesity-mediated AF.

Keywords: Arrhythmias; Cardiology.


Conflict of interest statement

Conflict of interest: The authors have declared that no conflict of interest exists.

Figures

Figure 1
Figure 1. Genetic and pharmacological inhibition of NADPH oxidase 2 (NOX2) reduces obesity-mediated AF.
(A) Human NOX2 mRNA expression versus patient BMI (kg/m2). (B) Human NOX2 mRNA expression in lean (n = 6), overweight (n = 3), and obese individuals (n = 7). (C) Average weight (grams) of control, diet-induced obesity (DIO), DIO-apocynin, Nox2-knockout (KO), and DIO Nox2-KO mice over 10-week duration with an HFD. (D) Final weights (grams) of all 5 groups of mice after 10 weeks of HFD. (E) Atrial electrograms showing sinus rhythm at baseline (top), pacing-induced AF in DIO mice (middle), and sinus rhythm restoration in DIO mice (bottom). (F) Pacing-induced AF burden (duration, seconds) in control (n = 8), DIO (n = 9), DIO-apocynin (n = 7), Nox2-KO (n = 5), and DIO Nox2-KO (n = 7) mice. P > 0.05, *P < 0.05, **P < 0.01, by 2-tailed, unpaired Student’s t test.
Figure 2
Figure 2. DIO Nox2-KO mice display increased atrial action potential and abrogation of obesity-induced ion channel remodeling.
(A and B) Whole-cell patch clamping of atrial myocytes of DIO Nox2-KO mice showed increased prolongation of shortened action potential duration (APD) caused by obesity. Representative AP tracings in atrial myocytes in control (n = 6 cells, n = 4 mice), DIO (n = 6 cells, n = 4 mice), Nox2-KO (n = 6 cells, n = 3 mice), and DIO Nox2-KO mice (n = 6 cells, n = 3 mice). (C) Instantaneous rate of voltage change over time (dV/dTmax), an indicator of atrial conduction velocity (CV; n = 6 cells). (D) Measured APD at 90% repolarization (APD90; n = 6 cells). (E) Representative sodium current (INa) tracings from control, DIO, and DIO Nox2-KO mice showing increased currents in DIO Nox2-KO atrial myocytes (n = 6 atrial cells, n = 3 mice). (F) INa and voltage relationship (I-V curves) in control (n = 6), DIO (n = 6), and DIO Nox2-KO mice (n = 6). (G) Representative L-type calcium current (ICa,L) tracings from control, DIO, and DIO Nox2-KO mice showing increased currents in DIO Nox2-KO atrial myocytes (n = 4 cells, n = 3 mice). (H) ICa,L and voltage relationship (I-V curves) in control (n = 4), DIO (n = 4), Nox2-KO (n = 4), and DIO Nox2-KO mice (n = 4). (I) Slow delayed rectifier potassium current (IKs; treated with 1 μM HMR-1556) and voltage relationship (I-V curves) in control (n = 5 cells, n = 3 mice), DIO (n = 4 cells, n = 3 mice), Nox2-KO (n = 7 cells, n = 3 mice), and DIO Nox2-KO mice (n = 8 cells, 3 mice). (J) Comparison of IKs at 50 mV in control (n = 5 cells), DIO (n = 4 cells), Nox2-KO (n = 7 cells), and DIO Nox2-KO mice (n = 8 cells). P > 0.05, *P < 0.05, by 1-tailed ANOVA with Bonferroni’s post hoc test for multiple comparisons.
Figure 3
Figure 3. NOX2 inhibition improves atrial contractility in DIO mice.
(A) Representative calcium transient tracings from control, DIO, Nox2-KO, and DIO Nox2-KO atrial myocytes. (B) Representative cell shortening tracings from control, DIO, Nox2-KO, and DIO Nox2-KO atrial myocytes (n = 6 cells, n = 3 mice each). (CE) Quantification of calcium transient tracings. (C) Time to peak calcium. (D) Time for calcium decline. (E) Calcium transient peak amplitudes. (FH) Quantification of sarcomere cell shortening tracings. (F) Shortening sarcomeric length. (G) Time to peak cell shortening. (H) Time to 90% relaxation (n = 6 cells.) *P < 0.05.
Figure 4
Figure 4. NOX2 inhibition in PA-treated hiPSC-aCMs using the NOX2 small-molecule inhibitor GSK-2795039 reverses obesity-induced ion channel remodeling.
(A) Optical voltage mapping on vehicle BSA-, PA-, and PA-GSK-hiPSC-aCMs showed that the shortening of atrial AP duration observed in PA-hiPSC-aCMs is abrogated in PA-GSK-hiPSC-aCMs. (B) Measured APD at 10% repolarization (APD10). (C) Measured APD at 50% repolarization (APD50). (D) Measured APD at 90% repolarization (APD90). (E) Total potassium current (IK) and voltage relationship (I-V curves) in BSA- (n = 5), PA- (n = 4), and PA-GSK-hiPSC-aCMs (n = 3). (F) Slow delayed rectifier potassium current (IKs) and voltage relationship (I-V curves) in BSA- (n = 5), PA- (n = 4), and PA-GSK-hiPSC-aCMs (n = 3). (G) Representative INa traces in BSA- (n = 6), PA- (n = 6), and PA-GSK-hiPSC-aCMs (n = 6). (H) Peak INa current density in BSA- (n = 6), PA- (n = 4), and PA-GSK-hiPSC-aCMs (n = 3). (I) Representative ICa,L traces in BSA- (n = 6), PA- (n = 6), and PA-GSK-hiPSC-aCMs (n = 6). (J) Peak ICa,L current density in BSA- (n = 6), PA- (n = 5), and PA-GSK-hiPSC-aCMs (n = 4). *P < 0.05, **P < 0.01, ***P < 0.001, by 1-tailed ANOVA with Bonferroni’s post hoc test for multiple comparisons.
Figure 5
Figure 5. NOX2 inhibition prevents atrial fibrosis and increases atrial CV in DIO mice.
(A) Representative isochronal maps of the LA in the 3 groups of mice using electrical mapping. (B) Quantification of mean LA CV in control (n = 6), DIO (n = 6), Nox2-KO (n = 5), and DIO Nox2-KO mice (n = 6). (C) Representative isochronal maps of the RA in the 3 groups of mice using electrical mapping. (D) Quantification of mean RA CV in control (n = 6), DIO (n = 6), Nox2-KO (n = 5), and DIO Nox2-KO mice (n = 6). (E) Picrosirius red staining of atrial myocytes from control, DIO, Nox2-KO, and DIO Nox2-KO. (F) Change in fibrosis (%) in the 3 groups of mice showing a significant reduction in fibrosis in DIO Nox2-KO compared with DIO mice (n = 3 mice each). Scale bar: 50 μm. (G) Masson’s trichrome staining of atrial myocytes from control, DIO, and DIO Nox2-KO. Scale bar: 50 μm. (H) Change in fibrosis (%) in the 4 groups of mice showing a significant reduction in fibrosis in DIO Nox2-KO compared with DIO mice (n = 3 mice each). *P < 0.05, **P < 0.01, by 2-tailed, unpaired Student’s t test.
Figure 6
Figure 6. NOX2 inhibition in PA-treated hiPSC-aCMs using the NOX2 small-molecule inhibitor GSK-2795039 reverses obesity-induced ion channel remodeling.
(A) Representative H2DCF staining of atrial cells from control, DIO, Nox2-KO, and DIO Nox2-KO mice. Scale bars: 20 μm. (B) Measured H2DCF fluorescence of atrial cells from control (n = 18 cells), DIO (n = 30 cells), Nox2-KO (n = 24 cells), and DIO Nox2-KO mice (n = 24 cells) at 0, 4, 8, and 12 minutes. (C) Rate of H2DCF increase in atrial cells from the 4 mouse groups. (D) Representative H2DCF staining of BSA-, PA-, and PA-GSK-hiPSC-aCMs. Scale bars: 50 μm. (E) Measured H2DCF fluorescence of BSA- (n = 22 cells), PA- (n = 26 cells), and PA-GSK-hiPSC-aCMs (n = 15 cells) at 0, 4, 8, and 12 minutes. (F) Rate of H2DCF increase in the 3 hiPSC-aCM groups. P > 0.05, *P < 0.05, ****P < 0.0001, by 2-tailed, unpaired Student’s t test.
Figure 7
Figure 7. Transcriptomic and pathway enrichment analysis in BSA-, PA-, and PA-GSK-hiPSC-aCMs and lean and obese human atrial tissues.
(A) Common biological process Gene Ontology (GO) pathways between the 3 comparisons. (BD) Heatmaps of top upregulated and downregulated differentially expressed genes associated with the key GO pathway, potassium transmembrane transport heart contraction (GO0071805), in BSA- versus PA-hiPSC-aCMs (B), PA- versus PA-GSK-hiPSC-aCMs (C), and lean versus obese human atrial tissue (HAT) (D). (E) Common upregulated and downregulated cardiac-related transcription factors in hiPSC-aCMs. (F and G) qPCR validation of PITX2, TBX5, and TBX3 genes in both hiPSC-aCMs (n = 3 each group) and HAT (n = 3 for lean, n = 6 for obese). (H and I) Pitx2 protein quantification using Western blotting in control, DIO, and DIO Nox2-KO mice. (J) PITX2 qPCR quantification on BSA-, PA-, and H2O2-hiPSC-aCMs (n = 8 each group) (25 μM). *P < 0.05, **P < 0.01, ***P < 0.001, ****P < 0.0001, by 2-tailed, unpaired Student’s t test and 1-tailed ANOVA with Tukey’s multiple-comparison test.
Figure 8
Figure 8. siRNA knockdown of PITX2 abrogates the effect of PA on hiPSC-aCMs.
(A) PITX2 expression in BSA-scrambled, PA-scrambled, BSA-PITX2-KD, and PA-PITX2-KD hiPSC-aCMs (n = 4 each). (B) Whole-cell patch clamping of BSA-scrambled (n = 10), PA-scrambled (n = 5), and PA-PITX2-KD hiPSC-aCMs (n = 5). (C) Measured APD at 20% repolarization (APD20). (D) Measured APD at 50% repolarization (APD50). (E) Measured APD at 90% repolarization (APD90). (F) Instantaneous rate of voltage change over time (dV/dTmax), an indicator of atrial CV. (G) Maximum action potential amplitude (APAmax). P > 0.05, *P < 0.05, by 2-tailed unpaired Student’s t test.

References

    1. Morillo CA, et al. Atrial fibrillation: the current epidemic. J Geriatr Cardiol. 2017;14(3):195–203. doi: 10.11909/j.issn.1671-5411.2017.03.011. - DOI - PMC - PubMed
    1. Lavie CJ, et al. Obesity and atrial fibrillation prevalence, pathogenesis, and prognosis: effects of weight loss and exercise. J Am Coll Cardiol. 2017;70(16):2022–2035. doi: 10.1016/j.jacc.2017.09.002. - DOI - PubMed
    1. Vyas V, Lambiase P. Obesity and atrial fibrillation: epidemiology, pathophysiology and novel therapeutic opportunities. Arrhythm Electrophysiol Rev. 2019;8(1):28–36. doi: 10.15420/aer.2018.76.2. - DOI - PMC - PubMed
    1. Chatterjee NA, et al. Genetic obesity and the risk of atrial fibrillation: causal estimates from Mendelian randomization. Circulation. 2017;135(8):741–754. doi: 10.1161/CIRCULATIONAHA.116.024921. - DOI - PMC - PubMed
    1. Abed HS, et al. Effect of weight reduction and cardiometabolic risk factor management on symptom burden and severity in patients with atrial fibrillation: a randomized clinical trial. JAMA. 2013;310(19):2050–2060. doi: 10.1001/jama.2013.280521. - DOI - PubMed

MeSH terms